

$ time cmakebuild.sh --target deqp-vk [6/6] Linking CXX executable external/vulkancts/modules/vulkan/deqp-vk real 0m25.137s user 0m22.280s sys 0m3.440s

planet.freedesktop.org
After getting thouroughly nerd-sniped a few weeks back, we now have FreeBSD support through qemu in the freedesktop.org ci-templates. This is possible through the qemu image generation we have had for quite a while now. So let's see how we can easily add a FreeBSD VM (or other distributions) to our gitlab CI pipeline:
Now, so far this may all seem quite familiar. And indeed, this is almost exactly the same process as for normal containers (see Part 1), the only difference is the .fdo.qemu-build base template. Using this template means we build an image babushka: our desired BSD image is actual a QEMU RAW image sitting inside another generic container image. That latter image only exists to start the QEMU image and set up the environment if need be, you don't need to care what distribution it runs out (Fedora for now).
.freebsd:
  variables:
     FDO_DISTRIBUTION_VERSION: '13.0'
     FDO_DISTRIBUTION_TAG: 'freebsd.0' # some value for humans to read

build-image:
  extends:
     - .freebsd
     - .fdo.qemu-build@freebsd
  variables:
    FDO_DISTRIBUTION_PACKAGES: "curl wget"
Because of the nesting, we need to handle this accordingly in our script: tag for the actual test job - we need to start the image and make sure our jobs are actually built within. The templates set up an ssh alias "vm" for this and the vmctl script helps to do things on the vm:
Now, there's a bit to unpack but with the comments above it should be fairly obvious what is happening. We start the VM, copy our working directory over and then run a command on the VM before cleaning up. The reason we use touch .success is simple: it allows us to copy things out and clean up before actually failing the job.
test-build:
  extends:
    - .freebsd
    - .fdo.distribution-image@freebsd
  script:
    # start our QEMU image
    - /app/vmctl start

    # copy our current working directory to the VM
    # (this is a yaml multiline command to work around the colon)
    - |
      scp -r $PWD vm:

    # Run the build commands on the VM and if they succeed, create a .success file
    - /app/vmctl exec "cd $CI_PROJECT_NAME; meson builddir; ninja -C builddir" && touch .success || true

    # Copy results back to our run container so we can include them in artifacts:
    - |
      scp -r vm:$CI_PROJECT_NAME/builddir .

    # kill the VM
    - /app/vmctl stop

    # Now that we have cleaned up: if our build job before
    # failed, exit with an error
    - [[ -e .success ]] || exit 1
Obviously, if you want to build any other distribution you just swap the freebsd out for fedora or whatever - the process is the same. libinput has been using fedora qemu images for ages now.
Thanks to the work done by Josè Expòsito, libinput 1.19 will ship with a new type of gesture: Hold Gestures. So far libinput supported swipe (moving multiple fingers in the same direction) and pinch (moving fingers towards each other or away from each other). These gestures are well-known, commonly used, and familiar to most users. For example, GNOME 40 recently has increased its use of touchpad gestures to switch between workspaces, etc. Swipe and pinch gestures require movement, it was not possible (for callers) to detect fingers on the touchpad that don't move.
This gap is now filled by Hold gestures. These are triggered when a user puts fingers down on the touchpad, without moving the fingers. This allows for some new interactions and we had two specific ones in mind: hold-to-click, a common interaction on older touchscreen interfaces where holding a finger in place eventually triggers the context menu. On a touchpad, a three-finger hold could zoom in, or do dictionary lookups, or kill a kitten. Whatever matches your user interface most, I guess.
The second interaction was the ability to stop kinetic scrolling. libinput does not actually provide kinetic scrolling, it merely provides the information needed in the client to do it there: specifically, it tells the caller when a finger was lifted off a touchpad at the end of a scroll movement. It's up to the caller (usually: the toolkit) to implement the kinetic scrolling effects. One missing piece was that while libinput provided information about lifting the fingers, it didn't provide information about putting fingers down again later - a common way to stop scrolling on other systems.
Hold gestures are intended to address this: a hold gesture triggered after a flick with two fingers can now be used by callers (read: toolkits) to stop scrolling.
Now, one important thing about hold gestures is that they will generate a lot of false positives, so be careful how you implement them. The vast majority of interactions with the touchpad will trigger some movement - once that movement hits a certain threshold the hold gesture will be cancelled and libinput sends out the movement events. Those events may be tiny (depending on touchpad sensitivity) so getting the balance right for the aforementioned hold-to-click gesture is up to the caller.
As usual, the required bits to get hold gestures into the wayland protocol are either in the works, mid-flight or merge-ready so expect this to hit the various repositories over the medium-term future.
I have not talked about raytracing in RADV for a while, but after some procrastination being focused on some other things I recently got back to it and achieved my next milestone.
In particular I have been hacking away at CTS and got to a point where CTS on dEQP-VK.ray_tracing.* runs to completion without crashes or hangs. Furthermore, I got the passrate to 90% of non-skiped tests. So we’re finally getting somewhere close to usable.
As further show that it is usable my fixes for CTS also fixed the corruption issues in Quake 2 RTX (Github version), delivering this image:

Of course not everything is perfect yet. Besides the not 100% CTS passrate it has like half the Windows performance at 4k right now and we still have some feature gaps to make it really usable for most games.
TL;DR Because I haven’t optimized it yet and implemented every shortcut imaginable.
Raytracing with Vulkan works with two steps:
With RDNA2 AMD started accelerating this by adding an instruction that allowed doing intersection tests between a ray and a single BVH node, where the BVH node can either be
Of course this isn’t quite enough to deal with all geometry types in Vulkan so we also add two more:
With a search tree like a BVH it is very possibly to make trees that are very useless. As an example consider a binary search tree that is very unbalanced. We can have similarly bad things with a BVH including making it unbalanced or having overlapping bounding volumes.
And my implementation is the simplest thing possible: the input geometry becomes the leaves in exactly the same order and then internal nodes are created just as you’d draw them. That is probably decently fast in building the BVH but surely results in a terrible BVH to actually use.
After we built a BVH we can start tracing some rays. In rough pseudocode the current implementation is
stack = empty
insert root node into stack
while stack is not empty:

   node = pop a node from the stack

   if we left the bottom level BVH:
      reset ray origin/direction to initial origin/direction

   result = amd_intersect(ray, node)
   switch node type:
      triangle:
         if result is a hit:
            load some node data
            process hit
      box node:
         for each box hit:
            push child node on stack
      custom node 1 (instance):
         load node data
         push the root node of the bottom BVH on the stack
         apply transformation matrix to ray origin/direction
      custom node 2 (AABB geometry):
         load node data
         process hit
We already knew there were inherently going to be some difficulties:
Furthermore this also clearly shows some difficulties with how we approached the intersection instruction. Some advantages of the intersection instruction are that it avoids divergence in computing collisions if we have different node types in a subgroup and to be cheaper when there are only a few lanes active. (A single CU can process one ray/node intersection per cycle, modulo memory latency, while it can process an ALU instruction on 64 lanes per cycle).
However even if it avoids the divergence in the collision computation we still introduce a ton of divergence in the processing of the results of the intersection. So we are still doing pretty bad here.
Another thing to be noted is our traversal stack size. According to the Vulkan specification a bottom level acceleration structure should support 2^24 -1 triangles and a top level acceleration structure should support 2^24 - 1 bottom level structures. Combined with a tree with 4 children in each internal node we can end up with a tree depth of about 24 levels.
In each internal node iteration of our loop we pop one element and push up to 4 elements, so at the deepest level of traversal we could end up with a 72 entry stack. Assuming these are 32-bit node identifiers, that ends up with 288 bytes of stack per lane, or ~18 KiB per 64 lane workgroup (the minimum which could possibly keep a CU busy with an ALU only workload). Given that we have 64 KiB of LDS (yes I am using LDS since there is no divergent dynamic register addressing) per CU that leaves only 3 workgroups per CU, leaving very little options for parallelism between different hardware execution units (e.g. the ALU and the texture unit that executes the ray intersections) or latency hiding of memory operations.
So ideally we get this stack size down significantly.
First step is to get CTS passing and getting an initial merge request into upstream Mesa. As a follow on to that I’d like to get a minimal prototype going for some DXR 1.0 games with vkd3d-proton just to make sure we have the right feature coverage.
After that we’ll have to do all the traversal optimizations. I’ll probably implement a bunch of instrumentation so I actually have a clue on what to optimize. This is where having some runnable games really helps get the right idea about performance bottlenecks.
Finally, with some luck better shaders to build a BVH will materialize as well.
If you want to write an X application, you need to use some library that speaks the X11 protocol. For a long time this meant libX11, often called xlib, which - like most things about X - is a fantastic bit of engineering that is very much a product of its time with some confusing baroque bits. Overall it does a very nice job of hiding the icky details of the protocol from the application developer.
One of the details it hides has to do with how resource IDs are allocated in X. A resource ID (an XID, in the jargon) is a 32 29-bit integer that names a resource - window, colormap, what have you. Those 29 bits are split up netmask/hostmask style, where the top 8 or so uniquely identify the client, and the rest identify the resource belonging to that client. When you create a window in X, what you really tell the server is "I want a window that's initially this size, this background color (etc.) and from now on when I say (my client id + 17) I mean that window." This is great for performance because it means resource allocation is assumed to succeed and you don't have to wait for a reply from the server.
Key to all this is that in xlib the XID is the return value from the call that issues the resource creation request. Internally the request gets queued into the protocol's write buffer, but the client can march ahead and issue the next few commands as if creation had succeeded - because it probably did, and if it didn't you're probably going to crash anyway.
So to allocate XIDs the client just marches forward through its XID range. What happens when you hit the end of the range? Before X11R4, you'd crash, because xlib doesn't keep track of which XIDs it's allocated, just the lowest one it hasn't allocated yet. Starting in R4 the server added an extension called XC-MISC that lets the client ask the server for a list of unused XIDs, so when xlib hits the end of the range it can request a new range from the server.
But. UI programming tends to want threads, and xlib is perhaps not the most thread-friendly. So XCB was invented, which sacrifices some of xlib's ease of use for a more direct binding to the protocol and (in theory) an explicitly thread-safe design. We then modified xlib and XCB to coexist in the same process, using the same I/O buffers, reply and event management, etc.
This literal reflection of the protocol into the API has consequences. In XCB, unlike xlib, XID generation is an explicit step. The client first calls into XCB to allocate the XID, and then passes that XID to the creation request in order to give the resource a name.
Which... sorta ruins that whole thread-safety thing.
Let's say you call xcb_generate_id in thread A and the XID it returns is the last one in your range. Then thread B schedules in and tries to allocate another XID. You'll ask the server for a new range, but since thread A hasn't called its resource creation request yet, from the server's perspective that "allocated" XID looks like it's still free! So now, whichever thread issues their resource creation request second will get BadIDChoice thrown at them if the other thread's resource hasn't been destroyed in the interim.
A library that was supposed to be about thread safety baked a thread safety hazard into the API. Good work, team.
How do you fix this without changing the API? Maybe you could keep a bitmap on the client side that tracks XID allocation, that's only like 256KB worst case, you can grow it dynamically and most clients don't create more than a few dozen resources anyway. Make xcb_generate_id consult that bitmap for the first unallocated ID, and mark it used when it returns. Then track every resource destruction request and zero it back out of the bitmap. You'd only need XC-MISC if some other client destroyed one of your resources and you were completely out of XIDs otherwise.
And you can implement this, except. One, XCB has zero idea what a resource destruction request is, that's simply not in the protocol description. Not a big deal, you can fix that, there's only like forty destructors you'd need to annotate. But then two, that would only catch resource destruction calls that flow through XCB's protocol binding API, which xlib does not, xlib instead pushes raw data through xcb_writev. So now you need to modify every client library (libXext, libGL, ...) to inform XCB about resource destruction.
Which is doable. Tedious. But doable.
I think.
I feel a little weird writing about this because: surely I can't be the first person to notice this.
Debugging programs using printf statements is not a technique that everybody appreciates. However, it can be quite useful and sometimes necessary depending on the situation. My past work on air traffic control software involved using several forms of printf debugging many times. The distributed and time-sensitive nature of the system being studied made it inconvenient or simply impossible to reproduce some issues and situations if one of the processes was stalled while it was being debugged.
In the context of Vulkan and graphics in general, printf debugging can be useful to see what shader programs are doing, but some people may not be aware it’s possible to “print” values from shaders. In Vulkan, shader programs are normally created in a high level language like GLSL or HLSL and then compiled to SPIR-V, which is then passed down to the driver and compiled to the GPU’s native instruction set. That final binary, many times outside the control of user applications, runs in a quite closed and highly parallel environment without many options to observe what’s happening and without text input and output facilities. Fortunately, tools like glslang can generate some debug information when compiling shaders to SPIR-V and other tools like Nsight can use that information to let you debug shaders being run.
Still, being able to print the values of different expressions inside a shader can be an easy way to debug issues. With the arrival of Ray Tracing, this is even more useful than before. In ray tracing pipelines, the shaders being executed and resources being used are chosen based on the scene geometry, the origin and the direction of the ray being traced. printf debugging can let you see where you are and what you’re using. So how do you print values from shaders?
Vulkan’s debug printf is implemented as part of the Validation Layers and the general procedure is well documented. If you were to implement this kind of mechanism yourself, you’d likely use a storage buffer to save the different values you want to print while shader invocations are running and, later, you’d go over the contents of that buffer and print the associated message with each value or values. And that is, essentially, what debug printf does but in a very convenient and automated way so that you don’t have to deal with the gory details and corner cases.
In a GLSL shader, simply:
Enable the GL_EXT_debug_printf extension.
Sprinkle your code with debugPrintfEXT() calls.
Use the Vulkan Configurator that’s part of the SDK or manually edit vk_layer_settings.txt for your app enabling VK_VALIDATION_FEATURE_ENABLE_DEBUG_PRINTF_EXT.
Normally, disable other validation features so as not to get too much output.
Take a look at the debug report or debug utils info messages containing printf results, or set printf_to_stdout to true so printf messages are sent to stdout directly.
You can find an example shader in the validation layers test code. The debug printf feature has helped me a lot in the past, so I wanted to make sure it’s widely known and used.
Due to the observer effect, you may end up in situations where your code works correctly when enabling debug printf but incorrectly without it. This may be due to multiple reasons but one of the main ones I’ve encountered is improper synchronization. When debug printf is used, the layers use additional synchronization primitives to sync the contents of auxiliary buffers, which can mask synchronization bugs present in the app.
Finally, RenderDoc 1.14, released at the end of May, also supports Vulkan’s shader printf statements and will let you take a look at the print statements produced during a draw call. Furthermore, the print statements don’t have to be present in the original shader. You can also use the shader edit system to insert them on the fly and use them to debug the results of a particular shader invocation. Isn’t that awesome? Great work by Baldur Karlsson as always.
PS: As a happy coincidence, just yesterday LunarG published a white paper on Vulkan’s debug printf with additional information on this excellent feature. Be sure to check it out!
In order to expose OpenGL 4.6 the last missing feature in llvmpipe is anisotropic texture filtering. Adding support for this also allows lavapipe expose the Vulkan samplerAnisotropy feature.
I started writing anisotropic support > 6 months ago. At the time we were trying to deprecate the classic swrast driver, and someone pointed out it had support for anisotropic filtering. This support had also been ported to the softpipe driver, but never to llvmpipe.
I had also considered porting swiftshaders anisotropic support, but since I was told the softpipe code was functional and had users I based my llvmpipe port on that.
Porting the code to llvmpipe means rewriting it to generate LLVM IR using the llvmpipe vector processing code. This is a lot messier than just writing linear processing code, and when I thought I had it working it passes GL CTS, but failed the VK CTS. The results also to my eye looked worse than I'd have thought was acceptable, and softpipe seemed to be as bad.
Once I swung back around to this I decided to port the VK CTS test to GL and run it on softpipe and llvmpipe code. Initially llvmpipe had some more bugs to solve esp where the mipmap levels were being chosen, but once I'd finished aligning softpipe and llvmpipe I started digging into why the softpipe code wasn't as nice as I expected.
The softpipe code was based on an implementation of an Elliptical Weighted Average Filter (EWA). The paper "Creating Raster Omnimax Images from Multiple Perspective Views Using the Elliptical Weighted Average Filter" described this. I sat down with the paper and softpipe code and eventually found the one line where they diverged.[1] This turned out to be a bug introduced in a refactoring 5 years ago, and nobody had noticed or tracked it down.
I then ported the same fix to my llvmpipe code, and VK CTS passes. I also optimized the llvmpipe code a bit to avoid doing pointless sampling and cleaned things up. This code landed in [2] today.
For GL4.6 there are still some fixes in other areas.
[1] https://gitlab.freedesktop.org/mesa/mesa/-/merge_requests/11917
[2] https://gitlab.freedesktop.org/mesa/mesa/-/merge_requests/8804
After a month of reverse-engineering, we’re excited to release documentation on the Valhall instruction set, available as a PDF. The findings are summarized in an XML architecture description for machine consumption. In tandem with the documentation, we’ve developed a Valhall assembler and disassembler as a reverse-engineering aid.
Valhall is the fourth Arm® Mali™ architecture and the fifth Mali instruction set. It is implemented in the Arm® Mali™-G78, the most recently released Mali hardware, and Valhall will continue to be implemented in Mali products yet to come.
Each architecture represents a paradigm shift from the last. Midgard generalizes the Utgard pixel processor to support compute shaders by unifying the shader stages, adding general purpose memory access, and supporting integers of various bit sizes. Bifrost scalarizes Midgard, transitioning away from the fixed 4-channel vector (vec4) architecture of Utgard and Midgard to instead rely on warp-based execution for parallelism, better using the hardware on modern workloads. Valhall linearizes Bifrost, removing the Very Long Instruction Word mechanisms of its predecessors. Valhall replaces the compiler’s static scheduling with hardware dynamic scheduling, trading additional control hardware for higher average performance. That means padding with “no operation” instructions is no longer required, which may decrease code size, promising better instruction cache use.
All information in this post and the linked PDF and XML is published in good faith and for general information purpose only. We do not make any warranties about the completeness, reliability and accuracy of this information. Any action you take upon the information you find here, is strictly at your own risk. We are not be liable for any losses and/or damages in connection with the use of this information.
While we strive to make the information as accurate as possible, we make no claims, promises, or guarantees about its accuracy, completeness, or adequacy. We expressly disclaim liability for content, errors and omissions in this information.
Let’s dig in.
In June, Collabora procured an International edition of the Samsung Galaxy S21 phone, powered by a system-on-chip with Mali G78. Although Arm announced Valhall with the Mali G77 in May 2019, roll out has been slow due to the COVID-19 pandemic. At the time of writing, there are not yet Linux friendly devices with a Valhall chip, forcing use of a locked down Android device. There’s a silver lining: we have a head start on the reverse-engineering, so by the time hacker-friendly devices arrive with Valhall GPUs, we can have open source drivers ready.
Android complicates reverse-engineering (though not as much as macOS). On Linux, we can compile a library on the device to intercept data sent to the GPU. On Android, we must cross-compile from a desktop with the Android Native Development Kit, ironically software that doesn’t run on Arm processors. Further, where on Linux we can track the standard system calls, Android device drivers replace the standard open() system call with a complicated Android-only “binder” interface. Adapting the library to support binder would be gnarly, but do we have to? We could sprinkle in one little hack anywhere we see a file descriptor without the file name.
#define MALI0 "/dev/mali0"

bool is_mali(int fd)
{
    char in[128] = { 0 }, out[128] = { 0 };
    snprintf(in, sizeof(in), "/proc/self/fd/%d", fd);

    int count = readlink(in, out, sizeof(out) - 1);
    return count == strlen(MALI0) && strncmp(out, MALI0, count) == 0;
}
Now we can hook the Mali ioctl() calls without tracing binder and easily dump graphics memory.
We’re interested in the new instruction set, so we’re looking for the compiled shader binaries in memory. There’s a chicken-and-egg problem: we need to find the shaders to reverse-engineer them, but we need to reverse-engineer the shaders to know what to look for. Fortunately, there’s an escape hatch. The proprietary Mali drivers allow an OpenGL application to query the compiled binary with the ARM_mali_program_binary extension, returning a file in the Mali Binary Shader format. That format was reverse-engineered years ago by Connor Abbott for earlier Mali architectures, and the basic structure is unchanged in Valhall. Our task is simple: compile a test shader, dump both GPU memory and the Mali Binary Shader, and find the common section. Searching for the common bytes produces an address in executable graphics memory, in this case 0x7f0002de00. Searching for that address in turn finds the “shader program descriptor” which references it.
18 00 00 80 00 10 00 00 00 DE 02 00 7F 00 00 00Another search shows this descriptor’s address in the payload of an index-driven vertex shading job for graphics or a compute job for OpenCL. Those jobs contain the Job Manager header introduced a decade ago for Midgard, so we understand them well: they form a linked list of jobs, and only the first job is passed to the kernel. The kernel interface has a “job chain” parameter on the submit system call taking a GPU address. We understand the kernel interface well as it is open source due to kernel licensing requirements.
With each layer identified, we teach the wrapper library to chase the pointers and dump every shader executed, enabling us to reverse-engineer the new instruction set and develop a disassembler.
Reverse-engineering in the dark is possible, but it’s easier to have some light. While waiting for the Valhall phone to arrive, I read everything Arm made public about the instruction set, particularly this article from Anandtech. Without lifting a finger, that article tells us Valhall is…
It also says that Valhall has a 16KB instruction cache, holding 2048 instructions. Since Valhall has a regular encoding, we divide 16384 bytes by 2048 instructions to find a Valhall instruction is 8 bytes. Our first attempt at a “disassembler” can print hex dumps of every 8 bytes on a line; our calculation ensures that is the correct segmentation.
From here on, reverse-engineering is iterative. We have a baseline level of knowledge, and we want to grow that knowledge. To do so, we input test programs into the proprietary driver to observe the output, then perturbe the input program to see how the output changes.
As we discover new facts about the architecture, we update our disassembler, demonstrating new knowledge and separating the known from the unknown. Ideally, we encode these facts in a machine-readable file forming a single reference for the architecture. From this file, we can generate a disassembler, an assembler, an instruction encoder, and documentation. For Valhall, I use an XML file, resembling Bifrost’s equivalent XML.
Filling out this file is usually straightforward though tedious. Modern APIs are large, so there is a great deal of effort required to map the API requirements to the hardware features.
However, some hardware features do not map to any API. Here are subtler tales from reversing Valhall.
Arithmetic is faster than memory access, so modern processors execute arithmetic in parallel with pending memory accesses. Modern GPU architectures require the compiler to manage this mechanism by analyzing the program and instructing the hardware to wait for the results before they’re needed.
For this purpose, Bifrost uses an explicit scoreboarding system. Bifrost groups up to 16 instructions together in a clause, and each clause has a fixed header. The compiler assigns a “dependency slot” between 0 and 7 to each clause, specified in the header. Each clause can wait on any set of slots, specified with another 8-bits in the clause header. Specifying dependencies per-clause is a compromise between precision and code size.
We expect Valhall to feature a similar scheme, but Valhall doesn’t have clauses or clause headers, so where does it specify this info?
Studying compiled shaders, we see the last byte of every instruction is usually zero. But when the result of a memory access is first read, the previous instruction has a bit set in the last byte. Which bit is set depends on the number of memory accesses in flight, so it seems the last byte encodes a dependency wait. The memory access instructions themselves are often zero in their last bytes, so it doesn’t look like the last byte is used to encode the dependency slot – but executing many memory access instructions at once and comparing the bits, we see a single 2-bit field stands out as differing. The dependency slot is specified inside the instruction, not in the metadata.
What makes this design practical? Two factors.
One, only the waits need to be specified in general. Arithmetic instructions don’t need a dependency slot, since they complete immediately. The longest message passing instructions is shorter than the longer arithmetic instruction, so there is space in the instruction itself to specify only when needed.
Two, the performance gain from adding extra slots levels off quickly. Valhall cuts back on Bifrost’s 8 slots (6 general purpose). Instead it has 4 or 5 slots, with only 3 general purpose, saving 4-bits for every instruction.
This story exemplifies a general pattern: Valhall is a flattening of Bifrost. Alternatively, Bifrost is “Valhall with clauses”, although that description is an anachronism. Why does Bifrost have clauses, and why does Valhall remove them? The pattern in this story of dependency waits generalizes to answer the question: grouping many instructions into Bifrost clauses allows the hardware to amortize operations like dependency waits and reduce the hardware gate count of the shader core. However, clauses add substantial encoding overhead, compiler complexity, and imprecision. Bifrost optimizes for die space; Valhall optimizes for performance.
Hardware features that are unused by the proprietary driver are a perennial challenge for reverse-engineering. However, we have a complete Bifrost reference at our disposal, and Valhall instructions are usually equivalent to Bifrost. Special instructions and modes from Bifrost cast a shadow on Valhall, showing where there are gaps in our knowledge. Sometimes these gaps are impractical to close, short of brute-forcing the encoding space. Other times we can transfer knowledge and make good guesses.
Consider the Cross Lane PERmute instruction, CLPER, which takes a register and the index of another lane in the warp, and returns the value of the register in the specified lane. CLPER is a “subgroup operation”, required for Vulkan and used to implement screen-space derivatives in fragment shaders. On Bifrost, the CLPER instruction is defined as:
<ins name="+CLPER.i32" mask="0xfc000" exact="0x7c000">
  <src start="0" mask="0x7"/>
  <src start="3"/>
  <mod name="lane_op" start="6" size="2">
    <opt>none</opt>
    <opt>xor</opt>
    <opt>accumulate</opt>
    <opt>shift</opt>
  </mod>
  <mod name="subgroup" start="8" size="2">
    <opt>subgroup2</opt>
    <opt>subgroup4</opt>
    <opt>subgroup8</opt>
  </mod>
  <mod name="inactive_result" start="10" size="4">
    <opt>zero</opt>
    <opt>umax</opt>
    ....
    <opt>v2infn</opt>
    <opt>v2inf</opt>
  </mod>
</ins>
We expect a similar definition for Valhall. One modification is needed: Valhall warps contain 16 threads, so there should be a subgroup16 option after subgroup8, with the natural binary encoding 11. Looking at a binary Valhall CLPER instruction, we see a 11 pair corresponding to the subgroup field. Similarly experimenting with different subgroup operations in OpenCL lets us figure out the lane_op field. We end up with an instruction definition like:
<ins name="CLPER.u32" title="Cross-lane permute" dests="1" opcode="0xA0" opcode2="0xF">
  <src/>
  <src widen="true"/>
  <subgroup/>
  <lane_op/>
</ins>
Notice we do not specify the encoding in the Valhall XML, since Valhall encoding is regular. Also notice we lack the inactive_result modifier. On Bifrost, inactive_result specifies the value returned if the program attempts to access an inactive lane. We may guess Valhall has the same mechanism, but that modifier is not directly controllable by current APIs. How do we proceed?
If we can run code on the device, we can experiment with the instruction. Inactive lanes may be caused by divergent control flow, where one lane in the thread branches but another lane does not, forcing the hardware to execute only part of the warp. After reverse-engineering Valhall’s branch instructions, we can construct a situation where a single lane is active and the rest are inactive. Then we insert a CLPER instruction with extra bits set, store the result to main memory, and print the result. This assembly program does the trick:
# Elect a single lane
BRANCHZ.reconverge.id lane_id, offset:3

# Try to read a value from an inactive thread
CLPER.u32 r0, r0, 0x01000000.b3, inactive_result:VALUE

# Store the value
STORE.i32.slot0.reconverge @r0, u0, offset:0

# End shader
NOP.return
With the assembler we’re writing, we can assemble this compute kernel. How do we run it on the device without knowing the GPU data structures required to dispatch compute shaders? We make use of another classic reverse-engineering technique: instead of writing the initialization code ourselves, piggyback off the proprietary driver. Our wrapper library allows us to access graphics memory before the driver submits work to the hardware. We use this to read the memory, but we may also modify it. We already identified the shader program descriptor, so we can inject our own shaders. From here, we can jury-rig a script to execute arbitrary shader binaries on the device in the context of an OpenCL application running under the proprietary driver.
Putting it together, we find the inactive_result bits in the CLPER encoding and write one more script to dump all values.
for ((i = 0 ; i < 16 ; i++)); do
  sed -e "s/VALUE/$i/" shader.asm | python3 asm.py shader.bin
  adb push shader.bin /data/local/tmp/
  adb shell 'REPLACE=/data/local/tmp/shader.bin '\
    'LD_PRELOAD=/data/local/tmp/panwrap.so '\
    '/data/local/tmp/test-opencl'
done
The script’s output contains sixteen possibilities – and they line up perfectly with Bifrost’s sixteen options. Success.
There’s more to learn about Valhall, but we’ve reverse-engineered enough to develop a Valhall compiler. As Valhall is a simplification of Bifrost, and we’ve already developed a free and open source compiler for Bifrost, this task is within reach. Indeed, adapting the Bifrost compiler to Valhall will require refactoring but little new development.
Mali G78 does bring changes beyond the instruction set. The data structures are changed to reduce Vulkan driver overhead. For example, the monolithic “Renderer State Descriptor” on Bifrost is split into a “Shader Program Descriptor” and a “Depth Stencil Descriptor”, so changes to the depth/stencil state no longer require the driver to re-emit shader state. True, the changes require more reverse-engineering. Fortunately, many data structures are adapted from Bifrost requiring few changes to the Mesa driver.
Overall, supporting Valhall in Mesa is within reach. If you’re designing a Linux-friendly device with Valhall and looking for open source drivers, please reach out!
Originally posted on Collabora’s blog
Some days ago my Igalia colleague Adrián Pérez pointed us to mold, a new drop-in replacement for existing Unix linkers created by the original author of LLVM lld. While mold is pretty new and does not aim to be 100% compatible with GNU ld, GNU gold or LLVM lld (at least as of the time I’m writing this), I noticed the benchmark table in its README file also painted a pretty picture about the performance of lld, if inferior to that of mold.
In my job at Igalia I work most of the time on VK-GL-CTS, Vulkan and OpenGL’s Conformance Test Suite, which contains thousands of tests for OpenGL and Vulkan. These tests are provided by different executable files and the Vulkan tests on which I’m focused are contained in a binary called deqp-vk. When built with debug information, deqp-vk can be quite large. A recent build, for example, is taking 369 MB in my drive. But the worst part is that linking the binary typically takes around 25 seconds on my work laptop.
$ time cmakebuild.sh --target deqp-vk
  [6/6] Linking CXX executable external/vulkancts/modules/vulkan/deqp-vk

  real    0m25.137s
  user    0m22.280s
  sys     0m3.440s
I had never paid much attention to the linker before, always relying on the default choice in Fedora or any other distribution. However, I decided to install lld, which has an official package, and gave it a try. You Will Not Believe What Happened Next.
$ time cmakebuild.sh --target deqp-vk
  [6/6] Linking CXX executable external/vulkancts/modules/vulkan/deqp-vk

  real    0m2.622s
  user    0m5.456s
  sys     0m1.764s
lld is capable of correctly linking deqp-vk in 1/10th of the time the default linker (GNU ld) takes to do the same job. If you want to try lld yourself you have several options. Ideally, you’d be able to run update-alternatives --set ld /usr/bin/lld as root but that option is notably not available in Fedora. There was a proposal to make that work but it never materialized, so it cannot be made the default system-wide linker.
However, depending on the build system used by a particular project, there should be a way to make it use lld instead of /usr/bin/ld. For example, VK-GL-CTS uses CMake, which invokes the compiler to link executable files, instead of calling the linker directly, which would be unusual. Both GCC and Clang can be passed -fuse-ld=lld as a command line option to use lld instead of the default linker. That flag should be added to CMake’s CMAKE_EXE_LINKER_FLAGS variable, either by reconfiguring an existing project with, for example, ccmake, or by adding the flag to the LDFLAGS environment variable before running CMake on a build directory for the first time.
Looking forward to start using the mold linker in the future and its multithreading capabilities. In the mean time, I’m very happy to have checked lld. It’s not that usual that a simple tooling change as this one gives me such a clear advantage.

That’s right.
Zink(-wip) now fully supports GL_KHR_blend_equation_advanced, which means ES 3.2 is a go (once my local CI clears me to push today’s snapshot).
And all it took was one brief exchange with a top Mesa reviewer who is incidentally rumored to be undergoing training deep in the mountains to become an expert BBQ master on the extremely professional #zink channel on OFTC:
That's the thing. You can totally do it in Zink.
My mind was blown.
Why hadn’t I thought of that sooner?
I could just…do it? Just like that? And then it’d be done?
Truly the experts are on a different level from us mortals.
So now it’s done, and that means zink is finished. I don’t expect there will be any more work to do now that the final boss has been defeated. Don’t even bother trying to file bug reports.
You may not like it, but this is what peak Friday looks like.
This is going to be less of a technical post and more of a have you thought about post from me personally (usual disclaimer: this post represents only my views). With that said, I think this is more important than the average post here, meaning that expectations should be set somewhere between I need to stop everything else I’m doing until I finish reading and this is the most important event in my life.
Let’s talk about open source. No, Open Source. The idea of it.
Those of you who are veterans are rolling your eyes. Another post about the glory of Open Source.
The thing about Open Source is that it’s sort of whatever you make of it. At its core, it’s about getting people together to solve a problem—community building. Whether that community is large or small, the goal is the same: write some quality software.
To that end, you’ve got your usual corporate powerpoint slide of community roles:
In Mesa, the maintainer and developer roles are mostly the same among core contributors: these are the people who write the code that gets posted about on all the news sites.
The reviewer is a bit more mysterious though. Who are reviewers, and what separates them from the others?
Reviewers are the grease that makes the project work. There’s really no other way of saying it.
Outside of a few components of Mesa that are effectively the wild west, without any form of oversight or approval needed for changes to be landed, every driver and utility in the tree requires that changes undergo review before they land. This means that each and every patch which affects code or build has to have a person stop everything else they’re doing and physically scroll through each patch, line-by-line, then add a Reviewed-by or Acked-by tag.
If you’re unclear as to the meanings of these tags, consider it like you’re going skydiving with someone you’ve never met before who has been in charge of preparing your parachute:
It’s then up to the developer to decide whether to merge the code based on the feedback given to them by the reviewer.
This, of course, assumes they get feedback at all.
Too often on news sites (and in certain corporate metrics) you’ll see something like “Patches McCodesAlot, working for GreatCodingCompany, authored the most code changes for this release cycle (9001 patches), which is over 100x more than the next highest contributor.”
The manager at a company sees this and thinks “I’ll send this up the chain. We should poach Patches so we can have greater control over this project which underpins our entire business strategy. Also it’ll make my powerpoint pie charts look rad.”
The casual reader sees this and says “Wow, Patches is awesome! Without Patches, I probably couldn’t even play Fororantwatch on my Linux gaming desktop!”
But how do the patches that Patches writes get merged into the release? Unless Patches works exclusively in one of the undermaintained areas of the project, in which case it’s unlikely that their work is being widely used, the odds are that someone’s pulling a huge lift on the review side to enable all of those patches landing into the repository.
This is the job of the reviewer.
As this Mesa release cycle starts to wind down, I hope that readers of this blog and news sites can take a moment to look past Patches McCodesAlot and see the people who make it possible for Patches to land so many damn patches.
At the time of this post, this is what the top 10 reviewers managed to accomplish over the past few months:
| Number of Reviews | Reviewer Name | Corporate Affiliation |
|---|---|---|
| 91 | Erik Faye-Lund | Collabora |
| 94 | Samuel Pitoiset | Valve |
| 99 | Alejandro Piñeiro | Igalia |
| 115 | Kenneth Graunke | Intel |
| 116 | Bas Nieuwenhuizen | Blogger |
| 121 | Lionel Landwerlin | Intel |
| 128 | Adam Jackson | Red Hat |
| 140 | Marek Olšák | AMD |
| 176 | Jason Ekstrand | Intel |
| 300 | Dave Airlie | Red Hat |
Summed up, that’s over 1300 patches reviewed! For perspective, that’s around 30% of all the patches in this release, and it’s about 70% of the total number of patches that zink has received in the course of its existence.
Looking at it another way though, this is over 1300 patches that other people wrote which were able to land because these people took the time to look over the proposed changes—to triple-check the parachutes, as it were.
So thanks, Mesa reviewers. The project wouldn’t exist without all of you (and your generous employers, who should be blasting these metrics in the press when they talk about being good Open Source citizens).
I’d be remiss if I didn’t also mention the people working on Mesa CI. There’s no patch counts or review counts or anything to recognize everyone hard at work here, but CI is what keeps the triangles blasting out of your GPUs looking how they should.
Thanks, CI team. You’re awesome.
According to a recent metric, the Mesa CI infrastructure only had a 0.6% accidental failure rate. That’s pretty good considering how many thousands of jobs run every day.
This year, I decided to participate as speaker in esLibre 2021 conference. esLibre is a Spanish free software conference that covers a lot of different topics related to open-source projects: from the technical point of view to its social impact.
This year the conference had talks about game development with Godot, KDE, LibreOffice, Free Software in Universities among many others. Check out the program.

This is my first time participating in this conference and I enjoyed it a lot. Huge applause to the organization team for the huge work to organize this edition, for helping out the speakers with different testing days and for their kindness to reply any question from me and other attendees. They did a superb job!
My talk was an introduction to Mesa where I covered things like where is Mesa in the open-source graphics stack, a summary of what it does, the drivers implemented in Mesa, how our community is organized and how to contribute to it. If you know Spanish, you can check it out here (PDF). But in case you want an English version of it, this talk is very similar to the one I gave at Ubucon Europe 2018.
My esLibre talk was recorded as well! I’ll update this post with the link to the recording once it is publicly available.
Enjoy it!

Today it's part 3 of my Outreachy Saga it’s been 5 weeks of my Outreachy internship, and everything is not sailing smoothly how I would like! Why?? Because I had a little problem with my setup and I was stuck for 2 days without working until be able to correctly do my setup, how I said in my introduction post, one thing that I'm learning at my internship is "learning", because not everything goes as I would like, sometimes it is necessary to stop, breathe, redo everything and, after redoing everything, it is so rewarding when things start to flow.
Today my week’s blog will be focusing on the Linux Kernel Community at which I’m interning and the project on which I’m working. So, let’s get started!
A small context: the core of an Operating System (OS) is the Kernel, as this is responsible for the integration of the physical devices (hardware) of the computer with the programs (software). In a Linux OS this core is also known as Linux Kernel, has open source code, and is freely available for the community, how I said in my introduction blog https://open-sourceress.com/outreachy-introduction/, the community it's a set of people and companies that want to collaborate in the development of the system.
Due to these contributions Linux Kernel has grown a lot, with over 8 million lines of code and well over 1000 contributors to each release, is one of the largest and most active free software projects in existence. The kernel codebase has been logically broken down into a set of subsystems: network, architecture-specific support (x86, ARM, MIPS, ...), memory management, devices video, real-time systems, among others. This makes it a little easier to manage the contributions made in the Kernel, as most subsystems have a designated maintainer, and they handle verifying and accepting contributions before they are incorporated in Linux kernel mainline
About my project at Linux Kernel – “Improvements to DRI-devel (aka kernel GPU subsystem)“
In laptops, tablets, phones, and lots of other places GPU/display uses more silicon die space than everything else combined (humans are mostly visual people after all), dri-devel (and the wider set of projects under the X.org Foundation's umbrella) is the community that makes this all work and shine.
In my project, I would like to create new features and better understand how the DRM core works. To achieve this goal, I chose these tasks: Clean up the debugfs support and remove custom dumbmapoffset implementations
Anyone can contribute to the development of the kernel, just develop a patch, send it to the system's mailing list, wait for community considerations, fix whatever it takes, and that's it.
But yes, I know well, that starting to contribute to the kernel is scary, especially for anyone who is a noob (beginner, newbie) in the Free Software development world and also doesn't know where to start.
But there are several things and initiatives to help, for example:
A beginners guide to linux kernel development
Write and Submit your first Linux kernel Patch
Outreachy is a paid, remote internship program. Outreachy's goal is to support people from groups underrepresented in tech. We help newcomers to free software and open source make their first contributions. Outreachy provides internships to open source work. People apply from all around the world. Interns work remotely and are not required to move. Interns are paid a stipend of $5,500 USD for the three month internship. Interns have a $500 USD travel stipend to attend conferences or events. Interns work with experienced mentors from open source communities. Outreachy internship projects may include programming, user experience, documentation, illustration, graphical design, or data science. Interns often find employment after their internship with Outreachy sponsors or in jobs that use the skills they learned during their internship.
Google Summer of Code is a global program focused on bringing more student developers into open source software development. Students work with an open source organization on a 10 week programming project during their break from school.
In Brazil, I met 2 of these groups
In Campinas - LKCamp
In São Paulo - FLUSP
It's scary I know, but as you can see there are several initiatives and content to start contributing to the Linux Kernel. So don't be afraid, try to contribute to the Linux kernel and ask the community for help there will always be someone who can help you!
Ah!!! And I almost forgot, if you need help you can send a message, I'm also starting in this world of kernel contribution, but I'll do my best to help and my goal with the blog besides showing my Outreachy internship progress is also to create content to help with the contribution and development of the kernel for beginners, both in English and in Portuguese (my native language).
Thank you for following me so far, please feel free to comment! And stay tuned to the next chapters of this Saga!!!
Take care and have a great day!
For today, at least.
Today, this blog is a Gallium blog. And it’s a momentous day indeed.
We all know what this is:

It’s a screenshot of Portal 2 with the Gallium HUD activated and VSync disabled.
But what driver is that underneath?
Well, for today’s blog it’s RadeonSI, the reference implementation of a Gallium driver.
And why is this, I can hear you all asking.
What if I told you that this screenshot with 10% higher FPS is also Portal 2 with VSync disabled on RadeonSI using one trick that graphics developers WON’T TELL YOU:

Interested?

We did it.
By assembling an elite team of individuals with a few minutes to spare here and there over the past week, including:
it is now (technically) possible to run DXVK-compatible Source Engine games through Gallium’s Nine state tracker, providing a native D3D9 runtime.
Is your Portal 2 in-game FPS sad and barely even 500 like this screenshot?

Why not jack it up to more than TWICE THAT NUMBER* with riced out, GPU-fan-shredding technology that Mesa Gallium drivers have been shipping for years?

This post does not represent any form of official statement or address from Valve and is only a small project that was started out of boredom while I waited for CTS runs to finish.
This post also does not make any claims or statements regarding performance on other drivers, or performance comparisons using alternative graphics emulation layers, though whew, it sure would be interesting to see what those kinds of numbers look like!
The Khronos Group has released today a new version of the Vulkan specification that includes the VK_EXT_multi_draw extension. This new extension has been championed by Mike Blumenkrantz, contracted by Valve to work on Zink, an OpenGL implementation that’s part of Mesa and runs on top of Vulkan. Mike has been working very hard to make OpenGL-on-Vulkan performant and better, and came up with this extension to close an existing gap between the two APIs. As part of the ongoing collaboration between Igalia and Valve, I had the chance to participate in the release process by reviewing the specification text in depth, providing feedback and fixes, and writing a set of CTS tests to check conformance for drivers implementing the extension. As you can see in the contributors list, VK_EXT_multi_draw had input and feedback from more vendors. Special mention to Jason Ekstrand from Intel, who provided an initial review of the text, and Piers Daniell from NVIDIA, who was also involved since the early stages.
Thanks to VK_EXT_multi_draw, Vulkan will have equivalents to the glMultiDrawArrays and glMultiDrawElements functions from OpenGL. They’re called vkCmdDrawMultiEXT and vkCmdDrawMultiIndexedEXT. These two new functions allow recording a batch of draw commands in a command buffer using a single call, and they can be used in situations where an application would be recording a high number of draws without changing state. Although Vulkan already had mechanisms that allowed applications to record batches of draw commands in the form of indirect draws, these need the array of draw parameters to reside in a GPU-accessible buffer. VK_EXT_multi_draw, on the other hand, lets applications provide arrays of draw parameters using CPU memory.
vkCmdDrawMultiEXT is essentially equivalent to calling vkCmdDraw multiple times in a row, and vkCmdDrawMultiIndexedEXT does the same for vkCmdDrawIndexed. To improve application performance and reduce CPU overhead, Vulkan drivers are allowed and encouraged to omit checks for API function arguments provided by applications (these correctness checks are provided by the Vulkan Validation Layers mainly during application development), and thanks to mechanisms like primary and secondary command buffers, Vulkan makes it possible to prepare sequences of commands for the GPU to execute using multiple threads and CPU cores. In this situation, you may be wondering how much of an improvement the new functions provide apart from saving a few microseconds processing some function calls. In other words, what’s the practical difference between calling vkCmdDraw a thousand times and batching a thousand draws using vkCmdDrawMultiEXT?
The answer is that most of the overhead of recording a draw command doesn’t come from having to call a function, but in the checks the implementation has to run when recording the command. These checks may not be related to correctness, but to additional actions and options that may need to be taken depending on the state of the command buffer in the moment the draw command is recorded. For example, see the calls to radv_before_draw when RADV processes a draw command (note: RADV is Mesa’s super nice free software Vulkan driver for AMD cards). These checks only need to run once when using the new functions. In bechmark-like scenarios using real drivers, Mike has been able to verify that, while the overhead varies per driver and some of them are lightweight and have minimal overhead, some mainstream drivers can double their draw call processing rate when using VK_EXT_multi_draw.
Mike has work-in-progress implementations for Mesa’s ANV and RADV drivers (the Vulkan drivers for Intel and AMD GPUs, respectively) which pass conformance and will hopefully land soon in Mesa’s main branch, and more drivers are expected to ship support for the extension in the near future.
After months and months of the construction crews hammering away, VK_EXT_multi_draw has now been released for general use.
Will this suddenly make zink the fastest GPU driver in history?
Obviously.
Long-time readers will recall that I memed about this extension some time ago, and the numbers in a synthetic benchmark targeted at exactly this feature are phenomenal.
For more on the topic, we go to our Senior Multidraw Correspondent and my personal Khronos BFF, Ricardo Garcia, who has been following this story since the beginning.
In short, an issue was filed recently about getting the Nine state tracker working with zink.
Was it the first? No..
Was it the first one this year? Yes.
Thus began a minutes-long, helter-skelter sequence of events to get Nine up and running, spread out over the course of a day or two. In need of a skilled finagler knowledgeable in the mysterium of Gallium state trackers, I contacted the only developer I know with a rockstar name, Axel Davy. We set out at dawn, and I strapped on my parachute. It was almost immediately that I heard a familiar call: there’s a build issue.
Next stop was crashing in unimplemented interface methods with a stopover in flailing about wildly in TGSI what even is this before I arrivated at my target:

Ah, glorious triangles.
Hi all, hope you all are doing fine!
It's been 3 weeks since I started the Outreachy internship, I've done a lot but at the same time, I don't think I've done anything.
In the first week, it was that week of setup machine, fighting with IRC to be able to send messages, sending some information necessary for Outreachy organizers. I also needed to configure my blog's RSS Feed (yes, at a time when I was in doubt whether I wanted to work with backend or frontend, I decided to learn how to develop a blog) as I use Gatsby as the base of the blog, it was relatively easy to configure the RSS (Hooray!! One thing worked \o/)
To do my setup, my mentor Melissa gave me 2 tutorials as a base:
How to compile and install the Linux Kernel
And I needed to redo them a few times to understand how they worked (it's in my GIANT to-do list, a tutorial with my steps explaining where I had a problem, one day it leaves...) because I was going to use a virtual machine to run the tests and see if I didn't break the kernel too much after it was configured I needed to test to see if everything was right, for that I used the tutorial
Ok, setup working and now?? I still needed to configure one thing: The VKMS (a software-only model of a KMS driver that is useful for testing and for running X (or similar) on headless machines) and the IGT (a test suite used specifically for debugging and development of the DRM drivers), for this I used the tutorial:
I was stuck for a few days in this task, the tests failed but why??? Configuration error? Tool installation error??
Nooo! It was my own mistake... That I didn't read the tutorial properly, and I didn't see the message that said:
“The tests need to be run without a composer, so you need to switch to text-only mode”
For that I only needed to do:
sudo systemctl isolate multi-user.target Ready! Solved, tests working \o/ and now what?
Now my task for the next few days is to “create a debugfs file for vkms using drmstatedump()”, but that's a subject for the next post.
Thank you for following me so far, please feel free to comment! And stay tuned to the next chapters of this Saga called Outreachy!!
Take care and have a great day!
A long, long time ago in a month far, far away I said I was going to blog about some improvements I’d been working on for zink. I blogged about some of them, but one was conspicuously absent from the original list:
There’s a lot that goes into this item. The post you’re reading now isn’t about to go so far as to claim that zink(-wip) is usable for gaming. No, that day is still far, far away. But this post is going to be the first step.
To begin with, a riddle: what change was made to zink between these two screenshots?


That’s right, I put the punchline in the title.
A suballocator.
A suballocator is a mechanism by which small blocks of memory can be suballocated out of larger one. For example, if I want to allocate an 64byte chunk of memory, I could allocate it directly and get my block, or I could allocate a 4096byte chunk of memory and then take 64bytes out of it.
When performance is involved, it’s important to consider the time-cost of allocations, and so yes, it’s useful to have already allocated another 63 instances of 64bytes when I need a second one, but there’s another, deeper issue that’s also necessary to address, especially as it relates to gaming: 32bit environments.
In a 32bit process, the amount of address space available is limited to 4GB, regardless of how much actual memory is physically present, some of which is dedicated to system resources and unavailable for general use. Any time a buffer or image is mapped by the driver in a process, this uses up address space in order to create an addressable region of memory that can be read or written to. Once all the address space has been used up, no other resources can be mapped, and it becomes impossible to continue normal operations.
In short, the game crashes.
In Vulkan, and just generally in driver work, it’s important to keep allocation sizes aligned to the preference of the hardware for a given usage; this amounts to minMemoryMapAlignment, which is 4096bytes on many drivers. Similarly, vkGetBufferMemoryRequirements and vkGetImageMemoryRequirements return aligned memory sizes, so even if only 64bytes are needed, 4096bytes must still be allocated—4032 bytes unused. This ends up wasting tons of memory when an app is allocating lots of smaller regions, and it’s further wasting address space since Vulkan prohibits memory from being mapped multiple times, meaning that each 64byte buffer is wasting an additional 4032bytes of address space.
While 4k of memory may seem like a small amount, and why would anyone ever need more than 256kb memory anyway, these allocations all add up, fast enough that zink runs out of address space in a 32bit game like Tomb Raider within a couple minutes.
Playable?
Probably not.
If you’re working in Mesa, you basically have two options when you come across a new problem: delete some code or copy some code. It’s not often that I come across an issue which can’t be resolved by one of the two.
In this case, I had known for quite a while that the solution was going to be copying some code. Thus I entered the realm of Gallium’s awesome auxilliary/pipebuffer, a fearsome component that had only been leveraged by one driver.

Yup, it was time to throw more galaxybrain.jpg code into the blender and see what came out. Ultimately, I was able to repurpose a lot of the core calculation code for sizing allocations, which saved me from having to do any kind of thinking or maffs. This let me cut down my suballocator implementation to a little under 700 lines, leaving much, much, much more space for bugsactivities.
At a high level, here’s an overview of aux/pb:
pb_cache_init to set up a memory cachepb_slabs_initpb_slab_alloc to reuse/reclaim a slab allocation, otherwise manually allocate new memorypb_reference_with_winsysThere’s more under the hood, but it mostly boils down to filling in the interface functions to manage detecting whether resources are busy or can be reclaimed for reuse. The actual caching/reclaiming/reusing are all handled by aux/pb, meaning I was free to go about breaking everything with all the leftover time that I had.
Cultured users of zink-wip can now enjoy massively improved performance (and have already been enjoying it for the past month) in many apps. The rest of you get to sit around and watch while I bang my head against CI while ajax showers me with memes.
There’s a lot that has happened in the world of Zink since my last update, so let’s see if I can bring you up to date on the most important stuff.
Gosh, when I last blogged about Zink, it hadn’t even landed upstream in Mesa yet! Well, by now it’s been upstream for quite a while, and most development has moved there.
At the time of writing, we have merged 606 merge-requests
labeled “zink”. The current tip of mesa’s main branch is totaling 1717
commits touching the src/gallium/drivers/zink/ sub-folder, written by
42 different contributors. That’s pretty awesome in my eyes, Zink has
truly become a community project!
Another noteworthy change is that Mike Blumenkrantz has come aboard the project, and has churned out an incredible amount of improvements to Zink! He got hired by Valve to work on Zink (among other things), and is now the most prolific contributor, with more than twice the amount of commits than I have written.
If you want a job in Open Source graphics, Zink has a proven track-record as a job-creator! :smile:
In addition to Mike, there’s some other awesome people who have been helping out lately.
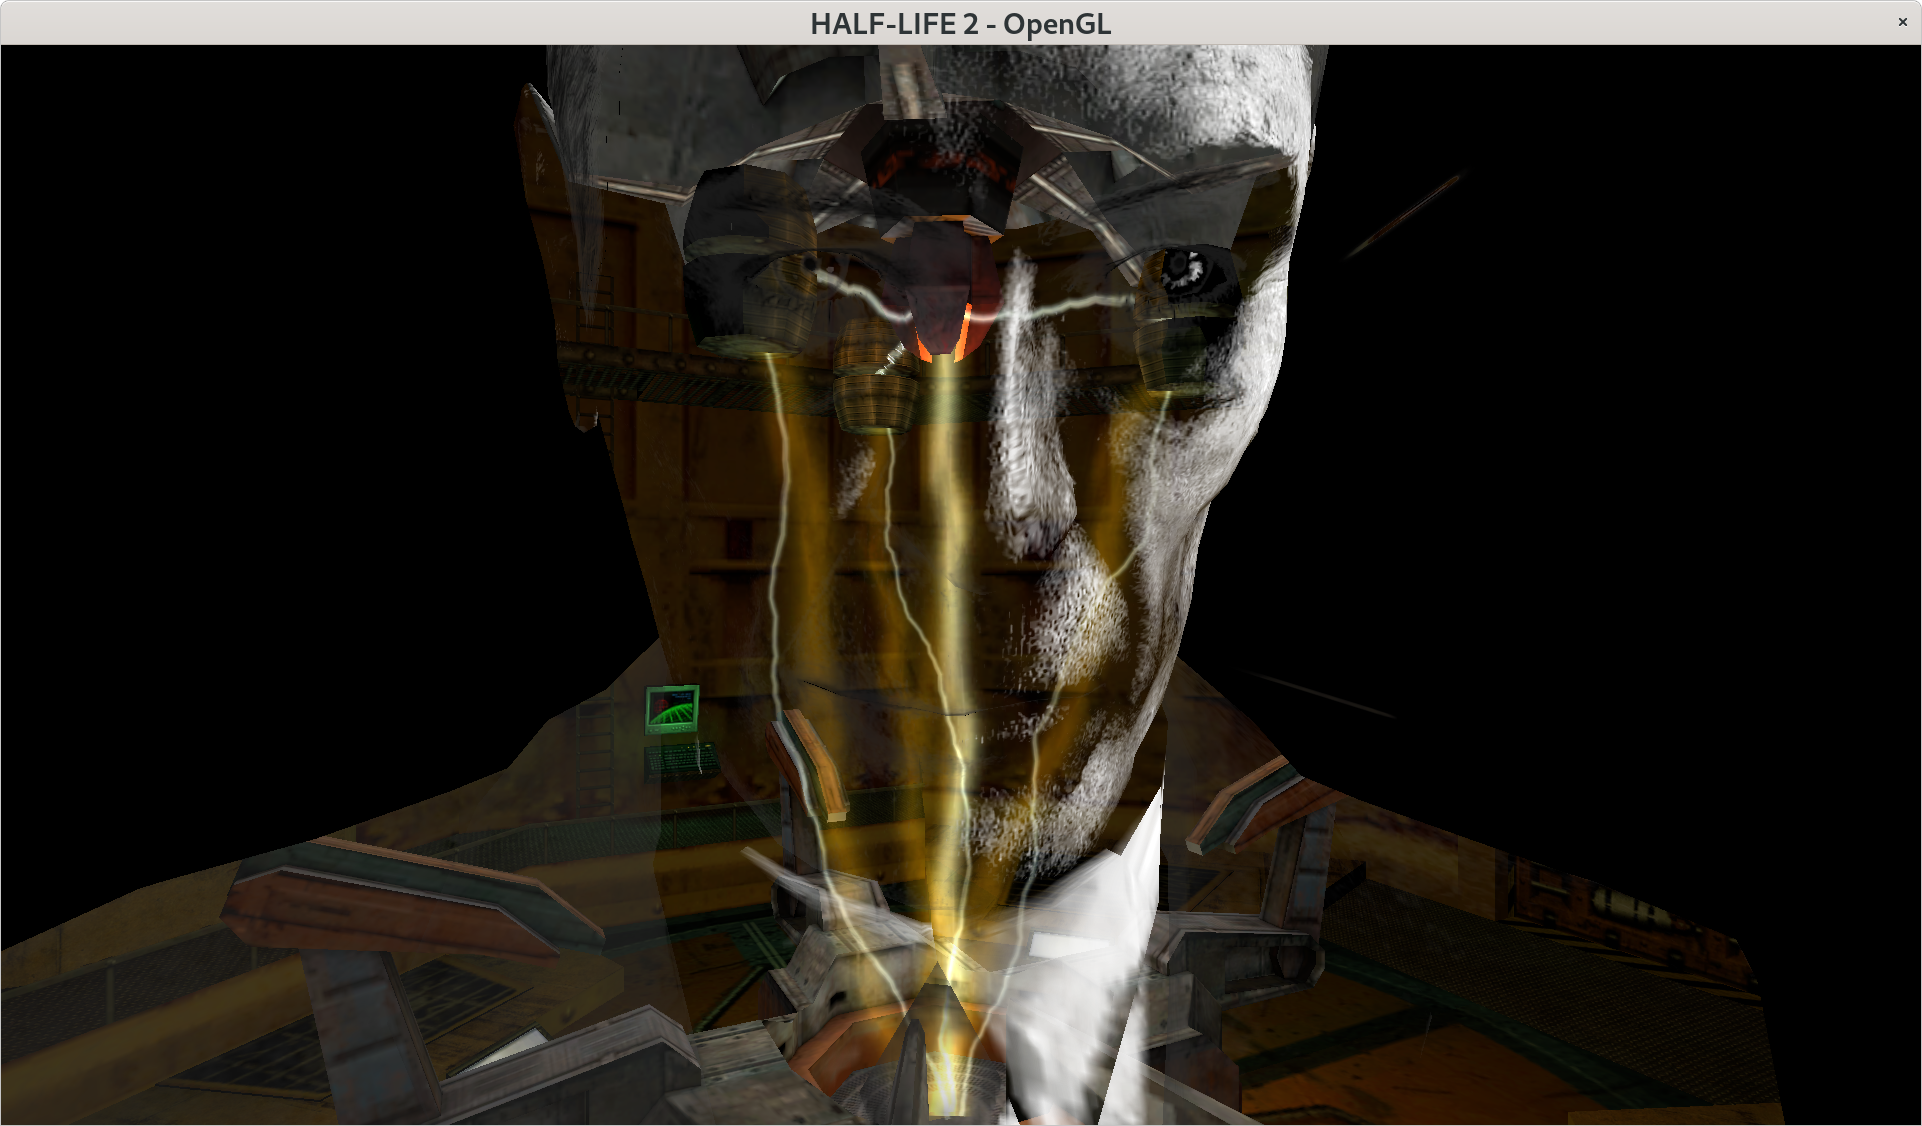 Half-Life 2 running with Zink.
Thanks to a lot of hard work by Mike assisted by Dave Airlie and Adam Jackson, both of RedHat, Zink is now able to expose the OpenGL 4.6 (Core Profile) feature set, given enough Vulkan features! :tada:
Please note that this doesn’t mean that Zink is yet a conformant implementation, there’s some details left to be ironed out before we can claim that. In particular, we need to pass the conformance tests, and submit a conformance report to Khronos. We’re not there yet.
I’m also happy to see that Zink is currently at the top of MesaMatrix (together with LLVMpipe, i965 and RadeonSI), reporting a total of 160 OpenGL extensions at the time of writing!
In theory, that means you can run any OpenGL application you can think of on top of Zink. Mike is hard at work testing the entire Steam game library, and things are working pretty well.
Is this the end of the line for Zink? Are we done now? Not at all! :laughing:
We’re still stuck at OpenGL 3.0 for compatibility contexts, mainly due to lack of testing. There’s a lot of features that need to work together in relatively complicated ways for this to work for us.
Note that this only matters for applications that rely on legacy OpenGL features. Modern OpenGL programs gets OpenGL 4.6 support, as mentioned previously.
I don’t think this is going to be a big deal to enable, but I haven’t spent time on it.
Similar to the OpenGL 4.6 support, we’re now able to expose the OpenGL ES 3.1 feature set. This is again thanks to a lot of hard work by Mike and the gang.
Why not OpenGL ES 3.2? This comes down to the
GL_KHR_blend_equation_advanced feature. Mike
blogged about the issue a while ago.
To prevent regressions, we’ve started testing Zink on the Mesa CI system for every change. This is made possible thanks to Lavapipe, a Vulkan software implementation in Mesa that reuse the rasterizer from LLVMpipe.
This means we can run tests on virtual cloud machines without having to depend on unreliable hardware. :robot:
At the time of writing, we’re only exposing OpenGL 4.1 on top of Lavapipe, due to some lacking features. But we have patches in the works to bring this up to OpenGL 4.5, and OpenGL 4.6 probably won’t be far off when that lands.
Basic support for Zink on Microsoft Windows has landed. This isn’t particularly useful at the moment, because we need better window-system integration to get anywhere near reasonable performance. But it’s there.
Thanks to work by Duncan Hopkins of The Foundry, there’s also some support for macOS. This uses MoltenVK as the Vulkan implementation, meaning that we also support the Vulkan Portability Extension to some degree.
This support isn’t quite as drop-in as on other platforms, because it’s completely lacking window-system integration. But it seems to work for the use-cases they have at The Foundry, so it’s worth mentioning as well.
Beyond this, Igalia has brought up Zink on the V3DV driver, and I’ve heard some whispers that there’s some people running Zink on top of Turnip, an open-source Vulkan driver for recent Qualcomm Adreno GPUs.
I’ve heard some people have some success getting things running on NVIDIA, but there’s a few obvious problems in the way there due to the lack of proper DRI support… Which brings us to:
Another awesome new development is that Adam is working on Penny. So, what’s Penny?
Penny is another way of bringing up Zink, on systems without DRI support.
It works as a dedicated GLX integration that uses the
VK_KHR_swapchain extension to integrate properly with
the native Vulkan driver’s window-system integration instead of Mesa baking
its own.
This solves a lot of small, nasty issues in the DRI code-path. I’ll say the magic “implicit synchronization” word, and hope that scares away anyone wondering what it’s about.
A lot more has happened on the performance front as well, again all thanks to Mike. However, much of this is still out-of-tree, and waiting in Mike’s zink-wip branch.
So instead, I suggest you check out Mike’s blog for the latest performance information (and much more up-to-date info on Zink). There’s been a lot going on, and I’m sure there’s even more to come!
I think this should cover the most interesting bits of development.
On a personal note, I recently became a dad for the first time, and as a result I’ll be away for a while on paternity leave, starting early this fall. Luckily, Zink is in good hands with Mike and the rest of the upstream community taking care of things.
I would like to again plug Mike’s blog as a great source of Zink-related news, if you’re not already following it. He posts a lot more frequent than I do, and he’s also an epic meme master, so it’s all great fun!
(Added a section on load/store pairs on June 14th)
This question probably seems absurd. An unoptimized memcpy is a simple loop that copies bytes. How hard can that be? Well...
There's a fascinating thread on llvm-dev started by George Mitenkov proposing a new family of "byte" types. I found the proposal and discussion difficult to follow. In my humble opinion, this is because the proposal touches some rather subtle and underspecified aspects of LLVM IR semantics, and rather than address those fundamentals systematically, it jumps right into the minutiae of the instruction set. I look forward to seeing how the proposal evolves. In the meantime, this article is a byproduct of me attempting to digest the problem space.
Here is a fairly natural way to (attempt to) implement memcpy in LLVM IR:
define void @memcpy(i8* %dst, i8* %src, i64 %n) {
entry:
%dst.end = getelementptr i8, i8* %dst, i64 %n
%isempty = icmp eq i64 %n, 0
br i1 %isempty, label %out, label %loop
loop:
%src.loop = phi i8* [ %src, %entry ], [ %src.next, %loop ]
%dst.loop = phi i8* [ %dst, %entry ], [ %dst.next, %loop ]
%ch = load i8, i8* %src.loop
store i8 %ch, i8* %dst.loop
%src.next = getelementptr i8, i8* %src.loop, i64 1
%dst.next = getelementptr i8, i8* %dst.loop, i64 1
%done = icmp eq i8* %dst.next, %dst.end
br i1 %done, label %out, label %loop
out:
ret void
}
Unfortunately, the copy that is written to the destination is not a perfect copy of the source.
Hold on, I hear you think, each byte of memory holds one of 256 possible bit patterns, and this bit pattern is perfectly copied by the `load`/`store` sequence! The catch is that in LLVM's model of execution, a byte of memory can in fact hold more than just one of those 256 values. For example, a byte of memory can be poison, which means that there are at least 257 possible values. Poison is forwarded perfectly by the code above, so that's fine. The trouble starts because of pointer provenance.
From a machine perspective, a pointer is just an integer that is interpreted as a memory address.
For the compiler, alias analysis -- that is, the ability to prove that different pointers point at different memory addresses -- is crucial for optimization. One basic tool in the alias analysis toolbox is to recognize that if pointers point into different "memory objects" -- different stack or heap allocations -- then they cannot alias.
Unfortunately, many pointers are obtained via getelementptr (GEP) using dynamic (non-constant) indices. These dynamic indices could be such that the resulting pointer points into a different memory object than the base pointer. This makes it nearly impossible to determine at compile time whether two pointers point into the same memory object or not.
Which is why there is a rule which says (among other things) that if a pointer P obtained via GEP ends up going out-of-bounds and pointing into a different memory object than the pointer on which the GEP was based, then dereferencing P is undefined behavior even though the pointer's memory address is valid from the machine perspective.
As a corollary, a situation is possible in which there are two pointers whose underlying memory address is identical but whose provenance is different. In that case, it's possible that one of them can be dereferenced while dereferencing the other is undefined behavior.
This only makes sense if, in the formal semantics of LLVM IR, pointer values carry more information than just an integer interpreted as a memory address. They also carry provenance information, which is essentially the set of memory objects that can be accessed via this pointer and any pointers derived from it.
What is the provenance of a pointer that results from a load instruction? In a clean operational semantics, the load must derive this provenance from the values stored in memory.
If bytes of memory can only hold one of 256 bit patterns (or poison), that doesn't give us much to work with. We could say that the provenance of the pointer is "empty", meaning the pointer cannot be used to access any memory objects -- but that's clearly useless. Or we could say that the provenance of the pointer is "all", meaning the pointer (or pointers derived from it) can be freely used to access all memory objects, assuming the underlying address is adjusted appropriately. That isn't much better.[0]
Instead, we must say that -- as far as LLVM IR semantics are concerned -- each byte of memory holds pointer provenance information in addition to its i8 content. The provenance information in memory is written by pointer store, and pointer load uses it to reconstruct the original provenance of the loaded pointer.
What happens to provenance information in non-pointer load/store? A load can simply ignore the additional information in memory. For store, I see 3 possible choices:
1. Leave the provenance information that already happens to be in memory unmodified.
2. Set the provenance to "empty".
3. Set the provenance to "all".
Looking back at our attempt to implement memcpy, there is no choice which results in a perfect copy. All of the choices lose provenance information.
Without major changes to LLVM IR, only the last choice is potentially viable because it is the only choice that allows dereferencing pointers that are loaded from the memcpy destination.
Without major changes to LLVM IR, we can only implement a memcpy that loses provenance information during the copy.
So what? Alias analysis around memcpy and code like it ends up being conservative, but reasonable people can argue that this doesn't matter. The burden of evidence lies on whoever wants to make a large change here in order to improve alias analysis.
That said, we cannot just call it a day and go (or stay) home either, because there are related correctness issues in LLVM today, e.g. bug 37469 mentioned in the initial email of that llvm-dev thread.
Here's a simpler example of a correctness issue using our hand-coded memcpy:
define i32 @sample(i32** %pp) {
%tmp = alloca i32*
%pp.8 = bitcast i32** %pp to i8*
%tmp.8 = bitcast i32** %tmp to i8*
call void @memcpy(i8* %tmp.8, i8* %pp.8, i64 8)
%p = load i32*, i32** %tmp
%x = load i32, i32* %p
ret i32 %x
}
A transform that should be possible is to eliminate the memcpy and temporary allocation:
define i32 @sample(i32** %pp) {
%p = load i32*, i32** %pp
%x = load i32, i32* %p
ret i32 %x
}
This transform is incorrect because it introduces undefined behavior.
To see why, remember that this is the world where we agree that integer stores write an "all" provenance to memory, so %p in the original program has "all" provenance. In the transformed program, this may no longer be the case. If @sample is called with a pointer that was obtained through an out-of-bounds GEP whose resulting address just happens to fall into a different memory object, then the transformed program has undefined behavior where the original program didn't.
We could fix this correctness issue by introducing an unrestrict instruction which elevates a pointer's provenance to the "all" provenance:
define i32 @sample(i32** %pp) {
%p = load i32*, i32** %pp
%q = unrestrict i32* %p
%x = load i32, i32* %q
ret i32 %x
}
Here, %q has "all" provenance and therefore no undefined behavior is introduced.
I believe that (at least for address spaces that are well-behaved?) it would be correct to fold inttoptr(ptrtoint(x)) to unrestrict(x). The two are really the same.
For that reason, unrestrict could also be used to fix the above-mentioned bug 37469. Several folks in the bug's discussion stated the opinion that the bug is caused by incorrect store forwarding that should be weakened via inttoptr(ptrtoint(x)). unrestrict(x) is simply a clearer spelling of the same idea.
A natural thought at this point is that the situation could be improved by adding provenance information to integers. This is technically correct: our hand-coded memcpy would then produce a perfect copy of the memory contents.
However, we would get into serious trouble elsewhere because global value numbering (GVN) and similar transforms become incorrect: two integers could compare equal using the icmp instruction, but still be different because of different provenance. Replacing one by the other could result in miscompilation.
GVN is important enough that adding provenance information to integers is a no-go.
I suspect that the unrestrict instruction would allow us to apply GVN to pointers, at the cost of making later alias analysis more conservative and sprinkling unrestrict instructions that may inhibit other transforms. I have no idea what the trade-off is on that.
With all the above in mind, I can see the first-principles appeal of the proposed "byte" types. They allow us to represent the contents of memory accurately in SSA values, and so they fill a real gap in the expressiveness of LLVM IR.
That said, the software development cost of adding a whole new family of types to LLVM is very high, so it better be justified by more than just aesthetics.
Our hand-coded memcpy can be turned into a perfect copier with straightforward replacement of i8 by b8:
define void @memcpy(b8* %dst, b8* %src, i64 %n) {
entry:
%dst.end = getelementptr b8, b8* %dst, i64 %n
%isempty = icmp eq i64 %n, 0
br i1 %isempty, label %out, label %loop
loop:
%src.loop = phi b8* [ %src, %entry ], [ %src.next, %loop ]
%dst.loop = phi b8* [ %dst, %entry ], [ %dst.next, %loop ]
%ch = load b8, b8* %src.loop
store b8 %ch, b8* %dst.loop
%src.next = getelementptr b8, b8* %src.loop, i64 1
%dst.next = getelementptr b8, b8* %dst.loop, i64 1
%done = icmp eq b8* %dst.next, %dst.end
br i1 %done, label %out, label %loop
out:
ret void
}
Looking at the concrete choices made in the proposal, I disagree with some of them.
Memory should not be typed. In the proposal, storing an integer always results in different memory contents than storing a pointer (regardless of its provenance), and implicitly trying to mix pointers and integers is declared to be undefined behavior. In other words, a sequence such as:
store i64 %x, i64* %p
%q = bitcast i64* %p to i8**
%y = load i8*, i8** %q
... is undefined behavior under the proposal instead of being effectively inttoptr(%x). That seems fine for C/C++, but is it going to be fine for other frontends?
The corresponding distinction between bytes-as-integers and bytes-as-pointers complicates the proposal overall, e.g. it forces them to add a bytecast instruction.
Conversely, the benefits of the distinction are unclear to me. One benefit appears to be guaranteed non-aliasing between pointer and non-pointer memory accesses, but that is a form of type-based alias analysis which in LLVM should idiomatically be done via TBAA metadata. (Update: see the addendum for another potential argument in favor of typed memory.)
So let's keep memory untyped, please.
Bitwise poison in byte values makes me really nervous due to the arbitrary deviation from how poison works in other types. I don't see any justification for it in the proposal. I can kind of see how one could be motivated by implementing memcpy with vector intrinsics operating on, for example, <8 x b32>, but a simpler solution would be to just use <32 x b8> instead. And if poison is indeed bitwise, then certainly pointer provenance would also have to be bitwise!
Finally, no design discussion is complete without a little bit of bike-shedding. I believe the name "byte" is inspired by C++'s std::byte, but given that types such as b256 are possible, this name would forever be a source of confusion. Naming is hard, and I think we should at least try to look for a better one. Let me kick off the brainstorming by suggesting we think of them as "memory content" values, because that's what they are. The types could be spelled m8, m32, etc. in IR assembly.
In the llvm-dev thread, Jeroen Dobbelaere points out work being done to introduce explicit `ptr_provenance` operands on certain instructions, in service of C99's restrict keyword. I haven't properly digested this work, but it inspired the thoughts of this section.
Values of the proposed byte types have both a bit pattern and a pointer provenance. Do we really need to have both pieces of information in the same SSA value? We could instead split them up into an integer bit pattern value and a pointer provenance value with an explicit provenance type. Loads of integers could read out the provenance information stored in memory and provide it as a secondary result. Similarly, stores of integers could accept the desired provenance to be stored in memory as a secondary data operand. This would allow us to write a perfect memcpy by replacing the core load/store sequence with something like:
%ch, %provenance = load_with_provenance i8, i8* %src
store_with_provenance i8 %ch, provenance %provenance, i8* %dst
The syntax and instruction names in the example are very much straw men. Don't take them too seriously, especially because LLVM IR doesn't currently allow multiple result values.
Interestingly, this split allows the derivation of pointer provenance to follow a different path than the calculation of the pointer's bit pattern. This in turn allows us in principle to perform GVN on pointers without being conservative for alias analysis.
One of the steps in bug 37469 is not quite GVN, but morally similar. Simplifying a lot, the original program sequence:
%ch1 = load i8, i8* %p1
%ch2 = load i8, i8* %p2
%eq = icmp eq i8 %ch1, %ch2
%ch = select i1 %eq, i8 %ch1, i8 %ch2
store i8 %ch, i8* %p3
... is transformed into:
%ch2 = load i8, i8* %p2
store i8 %ch2, i8* %p3
This is correct for the bit patterns being loaded and stored, but the program also indirectly relies on pointer provenance of the data. Of course, there is no pointer provenance information being copied here because i8 only holds a bit pattern. However, with the "byte" proposal, all the i8s would be replaced by b8s, and then the transform becomes incorrect because it changes the provenance information.
If we split the proposed use of b8 into a use of i8 and explicit provenance values, the original program becomes:
%ch1, %prov1 = load_with_provenance i8, i8* %p1
%ch2, %prov2 = load_with_provenance i8, i8* %p2
%eq = icmp eq i8 %ch1, %ch2
%ch = select i1 %eq, i8 %ch1, i8 %ch2
%prov = select i1 %eq, provenance %prov1, provenance %prov2
store_with_provenance i8 %ch, provenance %prov, i8* %p3
This could be transformed into something like:
%prov1 = load_only_provenance i8* %p1
%ch2, %prov2 = load_with_provenance i8, i8* %p2
%prov = merge provenance %prov1, %prov2
store_with_provenance i8 %ch2, provenance %prov, i8* %p3
... which is just as good for code generation but loses only very little provenance information.
Without major changes to LLVM IR, a perfect memcpy cannot be implemented because pointer provenance information is lost.
Nevertheless, one could still define the @llvm.memcpy intrinsic to be a perfect copy. This helps memcpys in the original source program be less conservative in terms of alias analysis. However, it also makes it incorrect to replace a memcpy loop idiom with a use of @llvm.memcpy: without adding unrestrict instructions, the replacement may introduce undefined behavior; and there is no way to bound the locations where such unrestricts may be needed.
We could augment @llvm.memcpy with an immediate argument that selects its provenance behavior.
In any case, one can argue that bug 37469 is really a bug in the loop idiom recognizer. It boils down to the details of how everything is defined, and unfortunately, these weird corner cases are currently underspecified in the LangRef.
We started with the question of whether memcpy can be implemented in LLVM IR. The answer is a qualified Yes. It is possible, but the resulting copy is imperfect because pointer provenance information is lost. This has surprising implications which in turn happen to cause real miscompilation bugs -- although those bugs could be fixed even without a perfect memcpy.
The "byte" proposal has a certain aesthetic appeal because it fixes a real gap in the expressiveness of LLVM IR, but its software engineering cost is large and I object to some of its details. There are also alternatives to consider.
The miscompilation bugs obviously need to be fixed, but they can be fixed much less intrusively, albeit at the cost of more conservative alias analysis in the affected places. It is not clear to me whether improving alias analysis justifies the more complex solutions.
I would like to understand better how all of this interacts with the C99 restrict work. That work introduces mechanisms for explicitly talking about pointer provenance in the IR, which may allow us to kill two birds with one stone.
In any case, this is a fascinating topic and discussion, and I feel like we're only at the beginning.
(Added this section on June 14th)
Harald van Dijk on Phrabricator and Ralf Jung on llvm-dev, referring to a Rust issue, explicitly and implicitly point out a curious issue with loading and storing integers.
Here is Harald's example:
define i8* @f(i8* %p) {
%buf = alloca i8*
%buf.i32 = bitcast i8** %buf to i32*
store i8* %p, i8** %buf
%i = load i32, i32* %buf.i32
store i32 %i, i32* %buf.i32
%q = load i8*, i8** %buf
ret i8* %q
}
There is a pair of load/store of i32 which is fully redundant from a machine perspective and so we'd like to optimize that away, after which it becomes obvious that the function really just returns %p -- at least as far as bit patterns are concerned.
However, in a world where memory is untyped but has provenance information, this optimization is incorrect because it can introduce undefined behavior: the load/store of i32 resets the provenance information in memory to "all", so that the original function returns an unrestricted version of %p. This is no longer the case after the optimization.
There are at least two possible ways of resolving this conflict.
We could define memory to be typed, in the sense that each byte of memory remembers whether it was most recently stored as a pointer or a non-pointer. A load with the wrong type returns poison. In that case, the example above returns poison before the optimization (because %i is guaranteed to be poison). After the optimization it returns non-poison, which is an acceptable refinement, so the optimization is correct.
The alternative is to keep memory untyped and say that directly eliminating the i32 store in the example is incorrect.
We are facing a tradeoff that depends on how important that optimization is for performance.
Two observations to that end. First, the more common case of dead store elimination is one where there are multiple stores to the same address in a row, and we remove all but the last one of them. That more common optimization is unaffected by provenance issues either way.
Second, we can still perform store forwarding / peephole optimization across such load/store pairs, as long as we are careful to introduce unrestrict where needed. The example above can be optimized via store forwarding to:
define i8* @f(i8* %p) {
%buf = alloca i8*
%buf.i32 = bitcast i8** %buf to i32*
store i8* %p, i8** %buf
%i = load i32, i32* %buf.i32
store i32 %i, i32* %buf.i32
%q = unrestrict i8* %p
ret i8* %q
}
We can then dead-code eliminate the bulk of the function and obtain:
define i8* @f(i8* %p) {
%q = unrestrict i8* %p
ret i8* %q
}
... which is as good as it can possibly get.
So, there is a good chance that preventing this particular optimization is relatively cheap in terms of code quality, and the gain in overall design simplicity may well be worth it.
[0] We could also say that the loaded pointer's provenance is magically the memory object that happens to be at the referenced memory address. Either way, provenance would become a useless no-op in most cases. For example, mem2reg would have to insert unrestrict instructions (defined later) everywhere because pointers become effectively "unrestricted" when loaded from alloca'd memory.
In an earlier article I showed how reading from VRAM with the CPU can be very slow. It however turns out there there are ways to make it less slow.
The key to this are instructions with non-temporal hints, in particular VMOVNTDQA. The Intel Instruction Manual says the following about this instruction:
“MOVNTDQA loads a double quadword from the source operand (second operand) to the destination operand (first operand) using a non-temporal hint if the memory source is WC (write combining) memory type. For WC memory type, the nontemporal hint may be implemented by loading a temporary internal buffer with the equivalent of an aligned cache line without filling this data to the cache. Any memory-type aliased lines in the cache will be snooped and flushed. Subsequent MOVNTDQA reads to unread portions of the WC cache line will receive data from the temporary internal buffer if data is available. “ (Intel® 64 and IA-32 Architectures Software Developer’s Manual Volume 2)
This sounds perfect for our VRAM and WC System Memory buffers as we typically only read 16-bytes per instruction and this allows us to read entire cachelines at time.
It turns out that Mesa already implemented a streaming memcpy using these instructions so all we had to do was throw that into our benchmark and write a corresponding memcpy that does non-temporal stores to benchmark writing to these memory regions.
As a reminder, we look into three allocation types that are exposed by the amdgpu Linux kernel driver:
VRAM. This lives on the GPU and is mapped with Uncacheable Speculative Write Combining (USWC) on the CPU. This means that accesses from the CPU are not cached, but writes can be write-combined.
Cacheable system memory. This is system memory that has caching enabled on the CPU and there is cache snooping to ensure the memory is coherent between the CPU and GPU (up till the top level caches. The GPU caches do not participate in the coherence).
USWC system memory. This is system memory that is mapped with Uncacheable Speculative Write Combining on the CPU. This can lead to slight performance benefits compared to cacheable system memory due to lack of cache snooping.
Furthermore this still uses a RX 6800 XT + a 2990WX with 4 channel 3200 MT/s RAM.
| method (MiB/s) | VRAM | Cacheable System Memory | USWC System Memory |
|---|---|---|---|
| read via memcpy | 15 | 11488 | 137 |
| write via memcpy | 10028 | 18249 | 11480 |
| read via streaming memcpy | 756 | 6719 | 4409 |
| write via streaming memcpy | 10550 | 14737 | 11652 |
Using this memcpy implementation we get significantly better performance in uncached memory situations, 50x for VRAM and 26x for USWC system memory. If this is a significant bottleneck in your workload this can be a gamechanger. Or if you were using SDMA to avoid this hit, you might be able to do things at significantly lower latency. That said it is not at a level where it does not matter. For big copies using DMA can still be a significant win.
Note that I initially gave an explanation on why the non-temporal loads should be faster, but the increases in performance are significantly above what something that just fiddles with loading entire cachelines would achieve. I have not dug into the why of the performance increase.
I have been claiming DMA is faster for CPU readbacks of VRAM in both this article and the previous article on the topic. One might ask how fast DMA is then. To demonstrate this I benchmarked VRAM<->Cacheable System Memory copies using the SDMA hardware block on Radeon GPUs.
Note that there is a significant overhead per copy here due to submitting work to the GPU, so I will shows results vs copy size. The rate is measured while doing a wait after each individual copy and taking the wall clock time as these usecases tend to be latency sensitive and hence batching is not too interesting.
| copy size | copy from VRAM (MiB/s) | copy to VRAM (MiB/s) |
|---|---|---|
| 4 KiB | 62 | 63 |
| 16 KiB | 245 | 240 |
| 64 KiB | 953 | 1015 |
| 256 KiB | 3106 | 3082 |
| 1 MiB | 6715 | 7281 |
| 4 MiB | 9737 | 11636 |
| 16 MiB | 12129 | 12158 |
| 64 MiB | 13041 | 12975 |
| 256 MiB | 13429 | 13387 |
This shows that for reads DMA is faster than a normal memcpy at 4 KiB and faster than a streaming memcpy at 64 KiB. Of course one still needs to do their CPU access at that point, but at both these thresholds even with an additional CPU memcpy the total process should still be fast with DMA.
TL;DR: Tag your GPT partitions with the right, descriptive partition types, and the world will become a better place.
A number of years ago we started the Discoverable Partitions Specification which defines GPT partition type UUIDs and partition flags for the various partitions Linux systems typically deal with. Before the specification all Linux partitions usually just used the same type, basically saying "Hey, I am a Linux partition" and not much else. With this specification the GPT partition type, flags and label system becomes a lot more expressive, as it can tell you:
/home/ partition or a root file system?)/etc/fstab)By embedding all of this information inside the GPT partition table
disk images become self-descriptive: without requiring any other
source of information (such as /etc/fstab) if you look at a
compliant GPT disk image it is clear how an image is put together and
how it should be used and mounted. This self-descriptiveness in
particular breaks one philosophical weirdness of traditional Linux
installations: the original source of information which file system
the root file system is, typically is embedded in the root file system
itself, in /etc/fstab. Thus, in a way, in order to know what the
root file system is you need to know what the root file system is. 🤯
🤯 🤯
(Of course, the way this recursion is traditionally broken up is by
then copying the root file system information from /etc/fstab into
the boot loader configuration, resulting in a situation where the
primary source of information for this — i.e. /etc/fstab — is
actually mostly irrelevant, and the secondary source — i.e. the copy
in the boot loader — becomes the configuration that actually matters.)
Today, the GPT partition type UUIDs defined by the specification have been adopted quite widely, by distributions and their installers, as well as a variety of partitioning tools and other tools.
In this article I want to highlight how the various tools the systemd project provides make use of the concepts the specification introduces.
But before we start with that, let's underline why tagging partitions with these descriptive partition type UUIDs (and the associated partition flags) is a good thing, besides the philosophical points made above.
Simplicity: in particular OS installers become simpler — adjusting
/etc/fstab as part of the installation is not necessary anymore,
as the partitioning step already put all information into place for
assembling the system properly at boot. i.e. installing doesn't
mean that you always have to get fdisk and /etc/fstab into
place, the former suffices entirely.
Robustness: since partition tables mostly remain static after
installation the chance of corruption is much lower than if the
data is stored in file systems (e.g. in /etc/fstab). Moreover by
associating the metadata directly with the objects it describes the
chance of things getting out of sync is reduced. (i.e. if you lose
/etc/fstab, or forget to rerun your initrd builder you still know
what a partition is supposed to be just by looking at it.)
Programmability: if partitions are self-descriptive it's much easier to automatically process them with various tools. In fact, this blog story is mostly about that: various systemd tools can naturally process disk images prepared like this.
Alternative entry points: on traditional disk images, the boot
loader needs to be told which kernel command line option root= to
use, which then provides access to the root file system, where
/etc/fstab is then found which describes the rest of the file
systems. Where precisely root= is configured for the boot loader
highly depends on the boot loader and distribution used, and is
typically encoded in a Turing complete programming language
(Grub…). This makes it very hard to automatically determine the
right root file system to use, to implement alternative entry points
to the system. By alternative entry points I mean other ways to boot
the disk image, specifically for running it as a systemd-nspawn
container — but this extends to other mechanisms where the boot
loader may be bypassed to boot up the system, for example qemu
when configured without a boot loader.
User friendliness: it's simply a lot nicer for the user looking at a partition table if the partition table explains what is what, instead of just saying "Hey, this is a Linux partition!" and nothing else.
Now that we cleared up the Why?, lets have a closer look how this is
currently used and exposed in systemd's various components.
If a disk image follows the Discoverable Partition Specification then
systemd-nspawn
has all it needs to just boot it up. Specifically, if you have a GPT
disk image in a file foobar.raw and you want to boot it up in a
container, just run systemd-nspawn -i foobar.raw -b, and that's it
(you can specify a block device like /dev/sdb too if you like). It
becomes easy and natural to prepare disk images that can be booted
either on a physical machine, inside a virtual machine manager or
inside such a container manager: the necessary meta-information is
included in the image, easily accessible before actually looking into
its file systems.
/etc/fstab or kernel command line root=If a disk image follows the specification in many cases you can remove
/etc/fstab (or never even install it) — as the basic information
needed is already included in the partition table. The
systemd-gpt-auto-generator
logic implements automatic discovery of the root file system as well
as all auxiliary file systems. (Note that the former requires an
initrd that uses systemd, some more conservative distributions do not
support that yet, unfortunately). Effectively this means you can boot
up a kernel/initrd with an entirely empty kernel command line, and the
initrd will automatically find the root file system (by looking for a
suitably marked partition on the same drive the EFI System Partition
was found on).
(Note, if /etc/fstab or root= exist and contain relevant
information they always takes precedence over the automatic logic. This
is in particular useful to tweaks thing by specifying additional mount
options and such.)
The
systemd-dissect
tool may be used to introspect and manipulate OS disk images that
implement the specification. If you pass the path to a disk image (or
block device) it will extract various bits of useful information from
the image (e.g. what OS is this? what partitions to mount?) and display it.
With the --mount switch a disk image (or block device) can be
mounted to some location. This is useful for looking what is inside
it, or changing its contents. This will dissect the image and then
automatically mount all contained file systems matching their GPT
partition description to the right places, so that you subsequently
could chroot into it. (But why chroot if you can just use systemd-nspawn? 😎)
The
systemd-dissect
tool also has two switches --copy-from and --copy-to which allow
copying files out of or into a compliant disk image, taking all
included file systems and the resulting mount hierarchy into account.
The
RootImage=
setting in service unit files accepts paths to compliant disk images
(or block device nodes), and can mount them automatically, running
service binaries directly off them (in chroot() style). In fact,
this is the base for the Portable
Service concept of systemd.
systemd provides various tools that can run operations provisioning
disk images in an "offline" mode. Specifically:
systemd-tmpfilesWith the --image= switch
systemd-tmpfiles
can directly operate on a disk image, and for example create all
directories and other inodes defined in its declarative configuration
files included in the image. This can be useful for example to set up
the /var/ or /etc/ tree according to such configuration before
first boot.
systemd-sysusersSimilar, the --image= switch of
systemd-sysusers
tells the tool to read the declarative system user specifications
included in the image and synthesizes system users from it, writing
them to the /etc/passwd (and related) files in the image. This is
useful for provisioning these users before the first boot, for example
to ensure UID/GID numbers are pre-allocated, and such allocations not
delayed until first boot.
systemd-machine-id-setupThe --image= switch of
systemd-machine-id-setup
may be used to provision a fresh machine ID into
/etc/machine-id
of a disk image, before first boot.
systemd-firstbootThe --image= switch of
systemd-firstboot
may be used to set various basic system setting (such as root
password, locale information, hostname, …) on the specified disk
image, before booting it up.
The
journalctl
switch --image= may be used to show the journal log data included in
a disk image (or, as usual, the specified block device). This is very
useful for analyzing failed systems offline, as it gives direct access
to the logs without any further, manual analysis.
The
systemd-repart
tool may be used to repartition a disk or image in an declarative and
additive way. One primary use-case for it is to run during boot on
physical or VM systems to grow the root file system to the disk size,
or to add in, format, encrypt, populate additional partitions at boot.
With its --image= switch it the tool may operate on compliant disk
images in offline mode of operation: it will then read the partition
definitions that shall be grown or created off the image itself, and
then apply them to the image. This is particularly useful in
combination with the --size= which allows growing disk images to the
specified size.
Specifically, consider the following work-flow: you download a
minimized disk image foobar.raw that contains only the minimized
root file system (and maybe an ESP, if you want to boot it on
bare-metal, too). You then run systemd-repart --image=foo.raw
--size=15G to enlarge the image to the 15G, based on the declarative
rules defined in the
repart.d/
drop-in files included in the image (this means this can grow the root
partition, and/or add in more partitions, for example for /srv or
so, maybe encrypted with a locally generated key or so). Then, you
proceed to boot it up with systemd-nspawn --image=foo.raw -b, making
use of the full 15G.
Disk images implementing this specifications can carry OS executables in one of three ways:
Only a root file system
Only a /usr/ file system (in which case the root file system is automatically picked as tmpfs).
Both a root and a /usr/file system (in which case the two are
combined, the /usr/ file system mounted into the root file system,
and the former possibly in read-only fashion`)
They may also contain OS executables for different architectures,
permitting "multi-arch" disk images that can safely boot up on
multiple CPU architectures. As the root and /usr/ partition type
UUIDs are specific to architectures this is easily done by including
one such partition for x86-64, and another for aarch64. If the
image is now used on an x86-64 system automatically the former
partition is used, on aarch64 the latter.
Moreover, these OS executables may be contained in different versions,
to implement a simple versioning scheme: when tools such as
systemd-nspawn or systemd-gpt-auto-generator dissect a disk image,
and they find two or more root or /usr/ partitions of the same type
UUID, they will automatically pick the one whose GPT partition label
(a 36 character free-form string every GPT partition may have) is the
newest according to
strverscmp()
(OK, truth be told, we don't use strverscmp() as-is, but a modified
version with some more modern syntax and semantics, but conceptually
identical).
This logic allows to implement a very simple and natural A/B update
scheme: an updater can drop multiple versions of the OS into separate
root or /usr/ partitions, always updating the partition label to the
version included there-in once the download is complete. All of the
tools described here will then honour this, and always automatically
pick the newest version of the OS.
When building modern OS appliances, security is highly relevant. Specifically, offline security matters: an attacker with physical access should have a difficult time modifying the OS in a way that isn't noticed. i.e. think of a car or a cell network base station: these appliances are usually parked/deployed in environments attackers can get physical access to: it's essential that in this case the OS itself sufficiently protected, so that the attacker cannot just mount the OS file system image, make modifications (inserting a backdoor, spying software or similar) and the system otherwise continues to run without this being immediately detected.
A great way to implement offline security is via Linux' dm-verity
subsystem: it allows to securely bind immutable disk IO to a single,
short trusted hash value: if an attacker manages to offline modify the
disk image the modified disk image won't match the trusted hash
anymore, and will not be trusted anymore (depending on policy this
then just result in IO errors being generated, or automatic
reboot/power-off).
The Discoverable Partitions Specification declares how to include
Verity validation data in disk images, and how to relate them to the file
systems they protect, thus making if very easy to deploy and work with
such protected images. For example systemd-nspawn supports a
--root-hash= switch, which accepts the Verity root hash and then
will automatically assemble dm-verity with this, automatically
matching up the payload and verity partitions. (Alternatively, just
place a .roothash file next to the image file).
The above already is a powerful tool set for working with disk images. However, there are some more areas I'd like to extend this logic to:
bootctlSimilar to the other tools mentioned above,
bootctl
(which is a tool to interface with the boot loader, and install/update
systemd's own EFI boot loader
sd-boot)
should learn a --image= switch, to make installation of the boot
loader on disk images easy and natural. It would automatically find
the ESP and other relevant partitions in the image, and copy the boot
loader binaries into them (or update them).
coredumpctlSimilar to the existing journalctl --image= logic the coredumpctl
tool should also gain an --image= switch for extracting coredumps
from compliant disk images. The combination of journalctl --image=
and coredumpctl --image= would make it exceptionally easy to work
with OS disk images of appliances and extracting logging and debugging
information from them after failures.
And that's all for now. Please refer to the specification and the man pages for further details. If your distribution's installer does not yet tag the GPT partition it creates with the right GPT type UUIDs, consider asking them to do so.
Thank you for your time.
We’ve all been there. No matter how 10x someone is or feels, everyone has had a moment where abruptly they say to themselves, HOW THE FUCK DO THREADS EVEN WORK?
This may be precipitated by any number of events, including, but not limited to:
I’m not going to say that I’ve been there recently.
I’m not going to say that it was today, nor am I going to state, on the record, that at least one existing zink-wip snapshot may or may not be affected by an issue which may or may not be on the above list.
I’m not going to say any of these things.
What I am going to do is talk about a new oom handler I’ve been working on to handle the dreaded spec@!opengl 1.1@streaming-texture-leak case from piglit.
This test is annoying in that it is effectively a test of a driver’s ability to throttle itself when an app is generating and using $infinity textures without ever explicitly triggering a flush.
In short, it’s:
for (i = 0; i < 5000; i++) {
   glGenTextures(1, &texture);
   glBindTexture(GL_TEXTURE_2D, texture);
   glTexImage2D(GL_TEXTURE_2D, 0, GL_RGBA, TEX_SIZE, TEX_SIZE, 0, GL_RGBA, GL_UNSIGNED_BYTE, tex_buffer);
   piglit_draw_rect_tex(0, 0, piglit_width, piglit_height, 0, 0, 1, 1);
   glDeleteTextures(1, &texture);
}
The textures are “deleted”, yes, but because they’re in use, the driver can’t actually delete them at this point of call, meaning that they can only truly be deleted once they are no longer in use by the GPU. At some iteration, this will begin to oom the GPU, and the driver will have to determine how to handle things.
At present, mainline zink uses a hammer-and-nail methodology that I came up with last year: the total amount of GPU memory in use by resources in a given cmdbuf is tracked, and that amount is tracked per-context. If the in-use context memory exceeds a threshold of the total VRAM, the driver stalls, thereby freeing up all the resources that are in use so they can be recycled into new ones.
There’s a number of problems with this approach, but the biggest one is that it fails to account for cases like a AAA game that just uses as much memory as it can in order to optimize performance/resolution/graphics. I discovered such a case some time ago while running Tomb Raider, and then I set out to improve things since it was costing me about 10% of my perf on the title screen.
The annoying part of this problem is that the piglit test is a very uncommon case, and it’s tricky to handle it in a way that doesn’t also impact other cases which appear similar but need to not get memory-clamped. As a result, it’s tough to really do anything based on “overall” memory usage.
In the end, what I decided on was using the per-cmdbuf memory usage counter to trigger a check for completed cmdbufs on submit, iterating over all the pending ones to check whether they’ve completed, resetting them and freeing associated resources when possible. This yields good memory reclaiming behavior for problem cases while leaving games like Tomb Raider untouched and definitely not deadlocking or anything like that.
I said I’d be blogging every day about some changes? And that was a month ago or however long it’s been? And we all had a good chuckle at the idea that I could blog every day like how things used to be?
Yeah, I remember that too.
Anyway, Bas still hasn’t blogged, so let’s check the blogenda:
I guess it’s that time of the week again because the schedule says it’s time to talk about this week’s (or whenever it was) major rewrite of zink’s queue handling. But first, only 90s kids will remember that time I blogged about a major queue rewrite and was excited to almost be hitting 70% of native performance.
A common use of GL for big games is using multiple GL contexts to parallelize work. There’s a lot of tricky restrictions for this, both on the app side and the driver side, but this is sort of the closest thing to multiple cmdbufs that GL provides.
We all recall how zink now uses a monotonic queue: upon commencing recording, each cmdbuf gets tagged with a 32bit integer id that doubles as a timeline semaphore id for fencing. The queue iterates, the cmdbuf counter increments, queue submission is done per-context in a thread, the GPU gets triangles, everyone is happy.
But how well does that work out with multiple contexts?
Pretty well, it turns out, as long as you’re using a Vulkan driver that doesn’t actually check to ensure you’re using monotonic ids for your timeline values. Let’s check out a totally hypothetical scenario that isn’t just Steam:
So far so good. But then we get past the “Checking for updates” window:

So now context B’s submit thread is dumping cmdbuf 4’s triangles into the GPU, then context A’s submit thread is also trying to dump cmdbuf 3’s triangles into the GPU, but the wait order for the timeline is still A -> B, meaning that the values are not monotonic.
Will any drivers care?
Magic 8-ball says no, no drivers care about this and everything still works fine. That’s cool and interesting, but probably it’d be better to not do that.
The problem here is two problems:
The first problem is easy to fix: just deduplicate the thread and move the struct member.
The second one is trickier because everything in zink relies on cmdbufs getting an id as soon as they become active. This is done so that any resources written to by a given cmdbuf can have their usage tracked for synchronization purposes, e.g., reading back a buffer only after all its writes have landed.
The problem is further complicated by zink not having a great API barrier between directly accessing the “usage” for a resource and the value itself, by which I mean parts of the codebase directly reading the integer value vs having an API to wrap it; the latter would enable replacing the mechanism with whatever I wanted, so I decided to start by creating such a wrapper based on this:
struct zink_batch_usage {
   uint32_t usage;
   bool unflushed;
};
This is the existing struct zink_batch_usage but now with a bool value indicating that this cmdbuf is yet to be flushed. Each cmdbuf batch now has this sub-struct inlined onto it, and resources in zink can take references (pointers) to a specific cmdbuf’s usage struct. Because batches are never destroyed, this means the wrapper API can always dereference the struct to determine how to synchronize the usage: if it’s unflushed, it can flush or sync the flush thread; if it’s real, pending usage, it can safely wait on that usage as a timeline value and guarantee monotonic ordering.
bool
zink_screen_usage_check_completion(struct zink_screen *screen, const struct zink_batch_usage *u)
{
   if (!zink_batch_usage_exists(u))
      return true;
   if (zink_batch_usage_is_unflushed(u))
      return false;

   return zink_screen_batch_id_wait(screen, u->usage, 0);
}

bool
zink_batch_usage_check_completion(struct zink_context *ctx, const struct zink_batch_usage *u)
{
   if (!zink_batch_usage_exists(u))
      return true;
   if (zink_batch_usage_is_unflushed(u))
      return false;
   return zink_check_batch_completion(ctx, u->usage);
}

void
zink_batch_usage_wait(struct zink_context *ctx, const struct zink_batch_usage *u)
{
   if (!zink_batch_usage_exists(u))
      return;
   if (zink_batch_usage_is_unflushed(u))
      zink_fence_wait(&ctx->base);
   else
      zink_wait_on_batch(ctx, u->usage);
}
Now things render exactly the same, but with a truly monotonic queue underneath that’s conformant to specifications.
As the President of the GNOME Foundation Board of Directors, I’m really pleased to see the number and breadth of candidates we have for this year’s election. Thank you to everyone who has submitted their candidacy and volunteered their time to support the Foundation. Allan has recently blogged about how the board has been evolving, and I wanted to follow that post by talking about where the GNOME Foundation is in terms of its strategy. This may be helpful as people consider which candidates might bring the best skills to shape the Foundation’s next steps.
Around three years ago, the Foundation received a number of generous donations, and Rosanna (Director of Operations) gave a presentation at GUADEC about her and Neil’s (Executive Director, essentially the CEO of the Foundation) plans to use these funds to transform the Foundation. We would grow our activities, increasing the pace of events, outreach, development and infrastructure that supported the GNOME project and the wider desktop ecosystem – and, crucially, would grow our funding to match this increased level of activity.
I think it’s fair to say that half of this has been a great success – we’ve got a larger staff team than GNOME has ever had before. We’ve widened the GNOME software ecosystem to include related apps and projects under the GNOME Circle banner, we’ve helped get GTK 4 out of the door, run a wider-reaching program in the Community Engagement Challenge, and consistently supported better infrastructure for both GNOME and the Linux app community in Flathub.
Aside from another grant from Endless (note: my employer), our fundraising hasn’t caught up with this pace of activities. As a result, the Board recently approved a budget for this financial year which will spend more funds from our reserves than we expect to raise in income. Due to our reserves policy, this is essentially the last time we can do this: over the next 6-12 months we need to either raise more money, or start spending less.
For clarity – the Foundation is fit and well from a financial perspective – we have a very healthy bank balance, and a very conservative “12 month run rate” reserve policy to handle fluctuations in income. If we do have to slow down some of our activities, we will return to a “steady state” where our regular individual donations and corporate contributions can support a smaller staff team that supports the events and infrastructure we’ve come to rely on.
However, this isn’t what the Board wants to do – the previous and current boards were unanimous in their support of the idea that we should be ambitious: try to do more in the world and bring the benefits of GNOME to more people. We want to take our message of trusted, affordable and accessible computing to the wider world.
Typically, a lot of the activities of the Foundation have been very inwards-facing – supporting and engaging with either the existing GNOME or Open Source communities. This is a very restricted audience in terms of fundraising – many corporate actors in our community already support GNOME hugely in terms of both financial and in-kind contributions, and many OSS users are already supporters either through volunteer contributions or donating to those nonprofits that they feel are most relevant and important to them.
To raise funds from new sources, the Foundation needs to take the message and ideals of GNOME and Open Source software to new, wider audiences that we can help. We’ve been developing themes such as affordability, privacy/trust and education as promising areas for new programs that broaden our impact. The goal is to find projects and funding that allow us to both invest in the GNOME community and find new ways for FOSS to benefit people who aren’t already in our community.
Bringing it back to the election, I’d like to make clear that I see this – reaching the outside world, and finding funding to support that – as the main priority and responsibility of the Board for the next term. GNOME Foundation elections are a slightly unusual process that “filters” our board nominees by being existing Foundation members, which means that candidates already work inside our community when they stand for election. If you’re a candidate and are already active in the community – THANK YOU – you’re doing great work, keep doing it! That said, you don’t need to be a Director to achieve things within our community or gain the support of the Foundation: being a community leader is already a fantastic and important role.
The Foundation really needs support from the Board to make a success of the next 12-18 months. We need to understand our financial situation and the trade-offs we have to make, and help to define the strategy with the Executive Director so that we can launch some new programs that will broaden our impact – and funding – for the future. As people cast their votes, I’d like people to think about what kind of skills – building partnerships, commercial background, familiarity with finances, experience in nonprofit / impact spaces, etc – will help the Board make the Foundation as successful as it can be during the next term.
Specifically when it’s right outside my house and starts at 5:30AM with heavy machinery moving around.
With this said, I’m overdue for a post, and if I don’t set a good example by continuing to blog, why would anyone else? PS. BAS IT’S TIME.
Let’s see what’s on the agenda:
Looks like the next thing on the list is shader caching.
If you’re a long-time zink connoisseur, or if you’re just a casual reader of the blog, you know that zink has a shader cache.
But did you know that it doesn’t actually do anything at present?
Indeed, it was to my chagrin that, upon diving back into my slapdash pipeline cache implementation, I discovered that it was doing absolutely nothing. And this was a different nothing than that one time I didn’t actually pass the cache back to the vulkan driver! Yes, this was the nothing of I have a cache, why am I still compiling a hundred pipelines per frame? that the occasional lucky developer runs into every now and again.
But hwhy? Who would do such a thing?

Past recriminations aside, how does a shader/pipeline cache work, anyway? The gist of it in most Mesa drivers is this:
Thus a shader gets cached based on its text representation, enabling matching shaders across programs to use the same cache entry. After noting the success of Steam’s fossilize-based single file cache, I decided to use a single file for zink’s shader cache.
Oops.
The problem in this case was that I was just jamming all the pipelines into a single file, written once at program exit, and expecting the Vulkan driver to figure things out.
But what if the program didn’t exit cleanly? Or what if the write failed for some reason?
In short, the pipeline cache was mostly being written as a big block of garbage data. Not very useful.
Clearly I needed to reeducate myself in the ways of managing a cache, something that, in my former life as a GUI expert, I did routinely, but that I could no longer comprehend now that I only speak bitfields and command buffers.
I sought out the reclusive Timothy Arceri, a well-known sage in many esoteric, arcane arts, and, as I recall it, purveyor of great wisdom such as (paraphrased because the original text has been lost to the ages): We Both Know The GLSL Compiler Code For Uniform Blocks Is Unfathomable, Why Do You Insist On Attempting To Modify It?
The answers I received from my sojourn were swift and concise:
Stop that. Fossilize caching wasn’t meant to work that way.
My thoughts whirling, confidence badly shaken, I stumbled and fell from the summit of the mountain and dashed my heretical cache implementation against the solid foundation of git rebase -i.
What had I been thinking?
It was back to the charts for me, and this time I had a number of different goals:
Turns out this wasn’t actually as hard as expected?
Because we’re all big Vulkan adults, we do big Vulkan pipeline caches instead of wimpy OpenGL shader caches like so:
This has the added benefit of providing all the state variants for a given shader pipeline, saving additional lookups and ensuring that all the potential compiled pipelines are available at once. Furthermore, because there’s a (very) short delay between knowing what shaders are grouped together and needing the actual compiled pipeline, I can dump this all into a thread and handle the lookup while I update descriptors #2021 ASYNC THREADS++++++ BAYBEEEEEE.
But also, also, the one thing to absolutely not ever forget or else it’ll be really embarrassing is to ensure that you add your driver’s sha1 hash to your disk cache lookup, otherwise the whole thing explodes and @tarceri will frown down upon you.
I am Beatriz Carvalho, brazilian, living in Fundão, Portugal. I am graduated in computer engineering at Unipampa in Brazil. I work mostly with C, Python and I am learning JavaScript, CSS, among other things to create this site... I like Harry Potter, Lord of the Rings, One Piece, The Witcher... I also like to drink wine and some cocktails and last but not least: I love cats, I have two: Ophélia and Cisco.
I've just been selected as an Outreachy intern for Linux Kernel working with my mentors Melissa Wen and Daniel Vetter on the project "Improvements to DRI-devel (aka kernel GPU subsystem)".
As an Outreachy intern, my first step is to say out loud for everyone to see my core values, Outreachy organizers make available a list with some values, and going through the list made me realize some things I value the most in life as an individual and once I started to work in the Linux Kernel these values caught my attention:
I grew up inside a religious community, where my family and I always tried our best to help people and the community in general. Then when I started studying about the Linux Kernel, I could enforce this concept, because there you have enthusiasts group (people who want to contribute voluntarily to development) working alongside companies from all over the world, to the development of the kernel, contributing to its evolution and adapting it to different platforms making the Linux Kernel one of the biggest free and open-source projects. Another thing that I think as one of the most important in a community is the chance to learn from one another, specially on feedbacks during the code review process. And of course, the community it's a great place to get to know new (awesome) people, to get job opportunities and (why not) make friends!
Another value that catches my attention in the Kernel is the importance of you are always learning, and trying to get a better understanding on how the project works. Leaving the comfort zone, because often the projects are huge, and sometimes you will have to "burn some (or many) neurons" to understand what you need to do, but on the other hand it is really cool and rewarding when things start to work.
And finally, a value I am learning is the responsibility to work on a project as big and complex as the kernel, because a change in a drive that you make, can impact thousands (or would it be millions?) of people who use it.
During my graduation, I attended several events about open source software, for example, tcheLinux, FISL. I always wished to contribute to the community but finding compatible materials/tutorials for beginners was really hard, mostly because despite being considered for beginners, it always required previous knowledge that were beyond my current skills.
Then on 2019 I took part in LKCamp (Linux Kernel study group), where I learned more about Linux Kernel, step-by-step on how to contribute to the community, and on how we could contribute with Open Source Software through internship programs such as Google Summer of Code (GSoC) and Outreachy. By the time, I got really excited about it but couldn't participate on the second stage of selection.
So, this year I gave my best at the selection process, made some patches and wrote my intern plan together with my mentors. And now that I was selected to Outreachy program, I can't believe that I have got this opportunity to be a part of it!
Now I need to control my anxiety and work to control the imposter syndrome in order to get the best of this opportunity, absorb all I can, and hopefully get a job to continue work with kernel.
Thank you for accompanying me so far, please feel free to comment! And stay tuned to the next chapters of this Saga called Outreachy!!
Take care and have a great day!
I had planned to write more posts about some optimizations and whatever other cool stuff I’ve been working on.
I had planned to make more zink-wip snapshots.
I did shower; stop spamming frog emotes at me.
But I also encountered a bug so bizarre, so infruating, so esoteric, that I need to take a bit of a victory lap now that I’ve successfully corralled it. So let’s get into a real, vintage SGC blog post like we used to have back when SGC was a good blog and dive into what it took to fix a bug that took me four full days to resolve.
In the course of writing a suballocator, I ran zero tests, as is my way. When the coding fugue ended, I stumbled weakly to my local CI script and managed to hit the Enter key before collapsing into a restless sleep where I was chased by angry triangles. Things were different when I awoke; namely I now had a lot of failing tests.
But I fixed them, because that’s what driver developers do.
All except one, which I assumed was a flake after running it a few times and seeing no failures.
This was how I got to know the horror of dEQP-GLES3.functional.vertex_array_objects.all_attributes.
The test itself is awful to debug. It generates GL_MAX_VERTEX_ATTRIBS vertex attributes to use with the maximum number of vertex buffers and does a series of draws, verifying the results. Normal enough.
Except the attributes are completely randomized, even whether they’re enabled, so no two runs are the same.
And the bisect hit just right.
When a new bug is found with a driver, the first question is usually “Did this used to work?” followed quickly by “When did it start?” if the first answer was yes. The reason for this is that determining exactly when a problem began and what caused it to manifest gives the developer some vague starting point for determining what is happening to cause a bug.
So it was that I embarked on a bisect to figure out why dEQP-GLES3.functional.vertex_array_objects.all_attributes was suddenly failing. But obviously I couldn’t just bisect for this test. No, no, that would be far too easy.
This test only fails if run in conjunction with a series of other tests. Thus my deqp caselist file:
dEQP-GLES3.functional.vertex_array_objects.all_attributes
dEQP-GLES3.functional.vertex_arrays.single_attribute.first.byte.first6_offset1_stride2_quads256
dEQP-GLES3.functional.vertex_arrays.single_attribute.output_types.int.components2_ivec4_quads256
dEQP-GLES3.functional.vertex_arrays.single_attribute.usages.static_copy.stride32_fixed_quads1
The problem test always runs last, so something was clearly going on over time that was causing the failure. Armed with this knowledge, and so sure that this would end up being some trivial one-liner that I could fix in a few minutes, I set up my startpoint and endpoint for the bisect and went to work.
Generally speaking, I assume every bug I find is going to be a zink bug. Just by the numbers, that’s usually the case, but then also it’s just always the case. It was therefore no surprise that my bisect landed on a certain commit:
commit 6b13e7cede95504ce8309744d8b9d83c7dbab7c9
Author: Mike Blumenkrantz <michael.blumenkrantz@gmail.com>
Date:   Mon May 17 08:44:02 2021 -0400

    try better map flags

diff --git a/src/gallium/drivers/zink/zink_resource.c b/src/gallium/drivers/zink/zink_resource.c
index 55f37380d9f..121f6f0076e 100644
--- a/src/gallium/drivers/zink/zink_resource.c
+++ b/src/gallium/drivers/zink/zink_resource.c
@@ -1201,7 +1201,7 @@ buffer_transfer_map(struct zink_context *ctx, struct zink_resource *res, unsigne
          /* At this point, the buffer is always idle (we checked it above). */
          usage |= PIPE_MAP_UNSYNCHRONIZED;
       }
-   } else if ((usage & PIPE_MAP_READ) && !(usage & PIPE_MAP_PERSISTENT)) {
+   } else if (((usage & PIPE_MAP_READ) && !(usage & PIPE_MAP_PERSISTENT)) || !res->obj->host_visible) {
       assert(!(usage & (TC_TRANSFER_MAP_THREADED_UNSYNC | PIPE_MAP_THREAD_SAFE)));
       if (usage & PIPE_MAP_DONTBLOCK) {
          /* sparse/device-local will always need to wait since it has to copy */
@@ -1209,7 +1209,7 @@ buffer_transfer_map(struct zink_context *ctx, struct zink_resource *res, unsigne
             return NULL;
          if (!zink_resource_usage_check_completion(ctx, res, ZINK_RESOURCE_ACCESS_WRITE))
             return NULL;
-      } else if (!res->obj->host_visible) {
+      } else if (!res->obj->host_visible || res->base.b.usage != PIPE_USAGE_STAGING) {
          trans->staging_res = pipe_buffer_create(&screen->base, PIPE_BIND_LINEAR, PIPE_USAGE_STAGING, box->x + box->width);
          if (!trans->staging_res)
             return NULL;
@@ -1218,8 +1218,12 @@ buffer_transfer_map(struct zink_context *ctx, struct zink_resource *res, unsigne
          zink_copy_buffer(ctx, NULL, staging_res, res, box->x, box->x, box->width);
          res = staging_res;
          zink_fence_wait(&ctx->base);
-      } else
-         zink_resource_usage_wait(ctx, res, ZINK_RESOURCE_ACCESS_WRITE);
+      } else {
+         if (!(usage & PIPE_MAP_WRITE))
+            zink_resource_usage_wait(ctx, res, ZINK_RESOURCE_ACCESS_WRITE);
+         else
+            zink_resource_usage_wait(ctx, res, ZINK_RESOURCE_ACCESS_RW);
+      }
    }

    if (!ptr) {
As clearly explained by my laconic commit log, this patch aims to improve non-persistent buffer mappings by forcing non-staging resources to use a snooped staging resource. For more details on why this is desirable, check out this encyclopedia of wisdom on the topic, written by RADV co-founder and Commander Of The Rays, Bas Nieuwenhuizen.
But somehow this small patch was breaking the test, so I set out to investigate.
Once a problem area is identified, it’s usually helpful to try and isolate the exact hunks of a patch which cause the problem. In this case, I had three distinct and only vaguely-related hunks, so it was an ideal case for this strategy. The middle hunk ended up being the culprit:
@@ -1209,7 +1209,7 @@ buffer_transfer_map(struct zink_context *ctx, struct zink_resource *res, unsigne
             return NULL;
          if (!zink_resource_usage_check_completion(ctx, res, ZINK_RESOURCE_ACCESS_WRITE))
             return NULL;
-      } else if (!res->obj->host_visible) {
+      } else if (!res->obj->host_visible || res->base.b.usage != PIPE_USAGE_STAGING) {
          trans->staging_res = pipe_buffer_create(&screen->base, PIPE_BIND_LINEAR, PIPE_USAGE_STAGING, box->x + box->width);
          if (!trans->staging_res)
             return NULL;
It seemed a bit odd to me, but nothing that stood out as impossible; perhaps there was some manner of issue with buffer copying offsets for setting up the staging resource, or some synchronization issue, or whatever. There were options, and I now knew that the problem was caused by setting up a staging buffer. Further prinfs revealed that this conditional was only hit for read access, so it was now narrowed down even further.
Was it a buffer offset problem with copying the data for the staging resource?
Well.
No.
As interesting as it would’ve been for that to have been the case, there’s zero chance that this one test case was invoking a magical offset that wasn’t also triggered in other cases. If the general buffer copying code here was broken, it was probably broken everywhere in zink, so there would’ve been many, many more failures. There was only this one case, however, and deeper investigation confirmed this, as I directly mapped both buffers and compared the data ranges, which matched.
Synchronization it was, then, and I can hear the disembodied voice of Dave Airlie now shouting “Barriers!” before vanishing off into the ether.
First, I tried adding more GPU stalls. Like, lots more. Like, so many that the test took minutes to complete. There was no change, however. Just for hahas, I even added some usleep calls around.
Still nothing.
At this point I was seriously stumped. By now I’d fully instrumented all of the buffer access codepaths with asserts to verify the mapped contents matched the real buffer contents in all cases, and none of the asserts were ever hit.
But if it wasn’t actually an issue with synchronizing the staging buffer, what could it be?
I decided to check the test with with ANV at this point, being the case that I always run CTS against lavapipe to avoid killing my session in case I’ve foolished and added some code which triggers hangs, and…
And the test passed with ANV.

This was a real thinker, so I went to get a second opinion from Bas and RADV. RADV told me that ANV didn’t know what it was talking about, and the test was definitely failing, so I went with that answer because it seemed more sane.
As a final idea, I did the truly unthinkable: I threw in a malloc call, allocated some host memory, and copied the map contents directly into that buffer.
And leaked it.
Yes, I know, I know, We Don’t Do That, but it was just this one time. Just a little bit. Just to see if I could valg—Of course valgrind crashes when running anything in lavapipe due to unimplemented instructions, so why did I bother?
There comes a time when saying We Need To Go Deeper isn’t just a meme. That time was now, and I was about to get, as they say in technical terms when such depth is approached, deep as fuck.
Continuing to experiment with my memory leaking, the conditional block in question had by now degenerated into spaghetti:
         trans->staging_res = pipe_buffer_create(&screen->base, PIPE_BIND_LINEAR, PIPE_USAGE_STAGING, box->x + box->width);
         if (!trans->staging_res)
            return NULL;
         struct zink_resource *staging_res = zink_resource(trans->staging_res);
         trans->offset = staging_res->obj->offset;
         uint8_t *p = map_resource(screen, res);
         trans->data = malloc(box->x + box->width);
         trans->data2 = malloc(box->x + box->width);
         memset(trans->data, 0, box->x + box->width);
         memset(trans->data2, 0, box->x + box->width);
         memcpy(trans->data, p, box->x + box->width);
         memcpy(trans->data2, p, box->x + box->width);
         printf("SIZE NEEDED %u\n", box->x + box->width);
      for (unsigned i = 0; i < box->x + box->width; i++) {
         uint8_t *map = res->obj->map;
         assert(trans->data[i] == trans->data2[i]);
         assert(map[i] == trans->data2[i]);
         printf("MAP[%u] = %u\n", i, trans->data2[i]);
      }
         //zink_copy_buffer(ctx, NULL, staging_res, res, box->x, box->x, MIN2(box->width + 4, res->base.b.width0-box->x));
         //zink_copy_buffer(ctx, NULL, staging_res, res, box->x, box->x, box->width);
         ptr = trans->data;

         res = staging_res;
         zink_fence_wait(&ctx->base);
Obviously I’m gonna double buffer my memory leak so I can verify that it’s not secretly being modified on unmap (it wasn’t), and then also verify that the data matches before returning the pointer. And print it all, of course, because if you can actually read your terminal when you reach this sort of depth in the course of a debugging session, probably you’re doing it wrong.
But the time had come to start applying hacks elsewhere: namely the test itself. Being a random test case made it impossible to figure out what was going on between runs, but I’d determined one thing of interest: no matter what, unless I returned the direct mapping for the buffer, the test failed.
Let’s see what Mr. Crowbar had to say about that though when I applied him to the CTS case:
diff --git a/modules/gles3/functional/es3fVertexArrayObjectTests.cpp b/modules/gles3/functional/es3fVertexArrayObjectTests.cpp
index 82578b1ce..e231c4b1a 100644
--- a/modules/gles3/functional/es3fVertexArrayObjectTests.cpp
+++ b/modules/gles3/functional/es3fVertexArrayObjectTests.cpp
@@ -765,14 +765,14 @@ void MultiVertexArrayObjectTest::init (void)
 		m_spec.buffers.push_back(shortCoordBuffer48);

 		m_spec.state.attributes.push_back(Attribute());
-		m_spec.state.attributes[attribNdx].enabled		= (m_random.getInt(0, 4) == 0) ? GL_FALSE : GL_TRUE;
-		m_spec.state.attributes[attribNdx].size			= m_random.getInt(2,4);
-		m_spec.state.attributes[attribNdx].stride		= 2*m_random.getInt(1, 3);
+		m_spec.state.attributes[attribNdx].enabled		= GL_TRUE;
+		m_spec.state.attributes[attribNdx].size			= (attribNdx % 2) + 2;
+		m_spec.state.attributes[attribNdx].stride	= 2 * ((attribNdx % 2) + 1);
 		m_spec.state.attributes[attribNdx].type			= GL_SHORT;
-		m_spec.state.attributes[attribNdx].integer		= m_random.getBool();
-		m_spec.state.attributes[attribNdx].divisor		= m_random.getInt(0, 1);
-		m_spec.state.attributes[attribNdx].offset		= 2*m_random.getInt(0, 2);
-		m_spec.state.attributes[attribNdx].normalized	= m_random.getBool();
+		m_spec.state.attributes[attribNdx].integer		= attribNdx % 3 == 1;
+		m_spec.state.attributes[attribNdx].divisor		= 0;
+		m_spec.state.attributes[attribNdx].offset		= attribNdx % 5;
+		m_spec.state.attributes[attribNdx].normalized	= attribNdx % 3 == 1;
 		m_spec.state.attributes[attribNdx].bufferNdx	= attribNdx+1;

 		if (attribNdx == 0)
@@ -783,14 +783,14 @@ void MultiVertexArrayObjectTest::init (void)
 		}

 		m_spec.vao.attributes.push_back(Attribute());
-		m_spec.vao.attributes[attribNdx].enabled		= (m_random.getInt(0, 4) == 0) ? GL_FALSE : GL_TRUE;
-		m_spec.vao.attributes[attribNdx].size			= m_random.getInt(2,4);
-		m_spec.vao.attributes[attribNdx].stride			= 2*m_random.getInt(1, 3);
+		m_spec.vao.attributes[attribNdx].enabled		= GL_TRUE;
+		m_spec.vao.attributes[attribNdx].size			= (attribNdx % 2) + 2;
+		m_spec.vao.attributes[attribNdx].stride			= 2 * ((attribNdx % 2) + 1);
 		m_spec.vao.attributes[attribNdx].type			= GL_SHORT;
-		m_spec.vao.attributes[attribNdx].integer		= m_random.getBool();
-		m_spec.vao.attributes[attribNdx].divisor		= m_random.getInt(0, 1);
-		m_spec.vao.attributes[attribNdx].offset			= 2*m_random.getInt(0, 2);
-		m_spec.vao.attributes[attribNdx].normalized		= m_random.getBool();
+		m_spec.vao.attributes[attribNdx].integer		= attribNdx % 3 == 1;
+		m_spec.vao.attributes[attribNdx].divisor		= 0;
+		m_spec.vao.attributes[attribNdx].offset			= attribNdx % 5;
+		m_spec.vao.attributes[attribNdx].normalized		= attribNdx % 3 == 1;
 		m_spec.vao.attributes[attribNdx].bufferNdx		= attribCount - attribNdx;

 		if (attribNdx == 0)
Now I had a consistently failing test (as long as I ran it with the other test cases so it didn’t feel too lonely and accidentally pass) with consistent data, and I was dumping it all to logs that I could compare if I returned the direct pointer for the map to legitimately pass the test.
Naturally the output data that I was printing matched. It’d be pretty weird if it didn’t considering all the asserts that I had in the code, right? Hah, yeah, that’d be… That’d be pretty weird, all right…
By this point I had determined that it was a specific range of buffer mappings causing the problem, specifically those sized between 50 and 100 bytes. I also knew that these buffers were being mapped by u_vbuf, also known colloquially as the hinterlands of Gallium, an obscure component used to handle translating unsupported vertex buffer formats.
Veteran Mesa developers reading along are going full sensiblechuckle.gif right now, but I’ll request that we continue our no spoiler policy.
If the buffer contents were the same as the mapped contents but the test was still failing, then there had to be a reason for that. I fumbled my way over to the vertex attribute translator and fingerpainted in a printf to dump the translated vertex attributes. This enabled me to diff between a good run and a bad run.
It was then that I made a bewildering discovery.
Any time I had a 96-byte buffer map, the attributes starting at offset 92 didn’t match in cases when the test failed.
This was another thinker, so I decided to enhance my memory leaks a bit to copy more buffer since this was all 4096-aligned and it wasn’t like I was going to be copying out of bounds. This was when things started to get really weird.
Returning a copy of the resquested 96 bytes of the buffer failed the test, but returning 100 bytes passed it.
Uh-oh.
Now that I took a closer look at those vertex attribs, I realized that the ones which were failing were the ones that were read from bytes 96 and 97 of the buffer. The buffer which only had 96 bytes mapped, meaning that only the range of [0..95] was valid…
Resolution. What I had tripped over was a buffer overrun, one that was undetectable through normal means because of reasons like:
Iteration on various fixes finally yielded a patch that was upstreamable; the crux of the problem here was that the stride of vertex attributes was being used to calculate the size of the region to map, but the stride only determines the number of bytes between elements, not their size. For example, if the stride was 4 bytes but the element was 8 bytes, the overrun would be 4 bytes for the last element. The solution was to calculate the offset of the last element being mapped, then add the size of the element using the attribute’s format block size, which guarantees that the last attribute won’t be truncated.
Fuck that bug.
So we are looking to hire quite a few people into the Desktop team currently. First of all we are looking to hire two graphics engineers to help us work on Linux Graphics drivers. The first of those two jobs is now online on the Red Hat jobs site. This is a job in our core graphics team focusing on RHEL, Fedora and upstream around the Intel, AMD and NVidia open source drivers. This is an opportunity to join a team of incredibly talented engineers working on everything from the graphics system of the Linux kernel and on the userspace bits like Vulkan, OpenGL and Wayland. The job is listed as Senior Engineer, but for the right candidate we have flexibility there. We also have flexibility for people who want to work remotely, so as long as there is a Red Hat office in your home country you can work remotely for us. The second job, which we hope to have up soon, will be looking more at ARM graphics and be tied to our automotive effort, but we will be looking at the applications for either position in combination so feel free to apply for the already listed job even if you are more interested in the second one as we will discuss both jobs with potential candidates.
The second job we have up is for – Software Engineer – GPU, Input and Multimedia which is also for joining our Graphics team. This job is targetted at our office in Brno, Czechia and is a great entry level position if you are interested in the field of graphics. The job listing can be found here and outlines the kind of things we want you to look at, but do expect initially your job will be focused on helping the rest of the team manage their backlog and then grow from there.
The last job we have online now is for the automotive team, where we are looking for someone at the Senior/Principal level to join our Infotainment team, working with car makers around issues related to multimedia and help identifying needs and gaps and then work with upstream communities to figure out how we can resolve those issues. The job is targeted at Madrid, Spain as it is where we hope to center some of the infotainment effort and it makes things easier in terms of hardware access and similar, but for the right candidate we might be open to looking for candidates wanting to work remote or in another Red Hat office. You can find this job listing here.
We expect to be posting further jobs for the infotainment team within a week or two, so I will update once they are up.
There’s no shortage of very smart people working on Mesa. One of those, aspiring benchmark-quadrupler Marek Olšák, had a novel idea some time ago: Could C++ function templates were used to optimize draw dispatch in driver?
The answer was yes, and so began what was probably five or ten minutes of furiously jamming brackets and braces into a C++ file in order to achieve the intended result. Let’s check out what’s going on here.
To start, the templates must be accessible from C, as this is what the driver is written in. The methodology here is simple: Generate the templates as an array of function pointers such that they can be accessed by indexing the arrays with the template values. Here’s what the code looks like:
template <chip_class GFX_VERSION, si_has_tess HAS_TESS, si_has_gs HAS_GS,
          si_has_ngg NGG, si_has_prim_discard_cs ALLOW_PRIM_DISCARD_CS>
static void si_init_draw_vbo(struct si_context *sctx)
{
   /* Prim discard CS is only useful on gfx7+ because gfx6 doesn't have async compute. */
   if (ALLOW_PRIM_DISCARD_CS && GFX_VERSION < GFX7)
      return;

   if (NGG && GFX_VERSION < GFX10)
      return;

   sctx->draw_vbo[GFX_VERSION - GFX6][HAS_TESS][HAS_GS][NGG][ALLOW_PRIM_DISCARD_CS] =
      si_draw_vbo<GFX_VERSION, HAS_TESS, HAS_GS, NGG, ALLOW_PRIM_DISCARD_CS>;
}

template <chip_class GFX_VERSION, si_has_tess HAS_TESS, si_has_gs HAS_GS>
static void si_init_draw_vbo_all_internal_options(struct si_context *sctx)
{
   si_init_draw_vbo<GFX_VERSION, HAS_TESS, HAS_GS, NGG_OFF, PRIM_DISCARD_CS_OFF>(sctx);
   si_init_draw_vbo<GFX_VERSION, HAS_TESS, HAS_GS, NGG_OFF, PRIM_DISCARD_CS_ON>(sctx);
   si_init_draw_vbo<GFX_VERSION, HAS_TESS, HAS_GS, NGG_ON, PRIM_DISCARD_CS_OFF>(sctx);
   si_init_draw_vbo<GFX_VERSION, HAS_TESS, HAS_GS, NGG_ON, PRIM_DISCARD_CS_ON>(sctx);
}

template <chip_class GFX_VERSION>
static void si_init_draw_vbo_all_pipeline_options(struct si_context *sctx)
{
   si_init_draw_vbo_all_internal_options<GFX_VERSION, TESS_OFF, GS_OFF>(sctx);
   si_init_draw_vbo_all_internal_options<GFX_VERSION, TESS_OFF, GS_ON>(sctx);
   si_init_draw_vbo_all_internal_options<GFX_VERSION, TESS_ON, GS_OFF>(sctx);
   si_init_draw_vbo_all_internal_options<GFX_VERSION, TESS_ON, GS_ON>(sctx);
}

static void si_init_draw_vbo_all_families(struct si_context *sctx)
{
   si_init_draw_vbo_all_pipeline_options<GFX6>(sctx);
   si_init_draw_vbo_all_pipeline_options<GFX7>(sctx);
   si_init_draw_vbo_all_pipeline_options<GFX8>(sctx);
   si_init_draw_vbo_all_pipeline_options<GFX9>(sctx);
   si_init_draw_vbo_all_pipeline_options<GFX10>(sctx);
   si_init_draw_vbo_all_pipeline_options<GFX10_3>(sctx);
}

static void si_invalid_draw_vbo(struct pipe_context *pipe,
                                const struct pipe_draw_info *info,
                                const struct pipe_draw_indirect_info *indirect,
                                const struct pipe_draw_start_count *draws,
                                unsigned num_draws)
{
   unreachable("vertex shader not bound");
}

extern "C"
void si_init_draw_functions(struct si_context *sctx)
{
   si_init_draw_vbo_all_families(sctx);

   /* Bind a fake draw_vbo, so that draw_vbo isn't NULL, which would skip
    * initialization of callbacks in upper layers (such as u_threaded_context).
    */
   sctx->b.draw_vbo = si_invalid_draw_vbo;
   sctx->blitter->draw_rectangle = si_draw_rectangle;

   si_init_ia_multi_vgt_param_table(sctx);
}
This calls through a series of functions, ultimately reaching si_init_draw_vbo where a template is set to a member of the function pointer array based on the template parameters. Specialized functions can then be generated based on hardware type, pipeline shader presence, and more.
Once initialized, there’s an inline function used to set the current function pointer:
static inline void si_select_draw_vbo(struct si_context *sctx)
{
   sctx->b.draw_vbo = sctx->draw_vbo[sctx->chip_class - GFX6]
                                    [!!sctx->shader.tes.cso]
                                    [!!sctx->shader.gs.cso]
                                    [sctx->ngg]
                                    [si_compute_prim_discard_enabled(sctx)];
   assert(sctx->b.draw_vbo);
}
Thus the parameters are pulled directly from the context, and the function can be called whenever the draw function pointer needs to be updated, such as when new shaders are bound or primitive discard is enabled.
The result is that now the draw dispatch can be fully optimized for the codepath required by the active hardware and graphics pipeline, reducing the CPU overhead and making the draw code the tiniest bit faster. For example, here’s just the top part of the templated function:
template <chip_class GFX_VERSION, si_has_tess HAS_TESS, si_has_gs HAS_GS, si_has_ngg NGG,
          si_has_prim_discard_cs ALLOW_PRIM_DISCARD_CS>
static void si_draw_vbo(struct pipe_context *ctx,
                        const struct pipe_draw_info *info,
                        unsigned drawid_offset,
                        const struct pipe_draw_indirect_info *indirect,
                        const struct pipe_draw_start_count_bias *draws,
                        unsigned num_draws)
{
   /* Keep code that uses the least number of local variables as close to the beginning
    * of this function as possible to minimize register pressure.
    *
    * It doesn't matter where we return due to invalid parameters because such cases
    * shouldn't occur in practice.
    */
   struct si_context *sctx = (struct si_context *)ctx;

   /* Recompute and re-emit the texture resource states if needed. */
   unsigned dirty_tex_counter = p_atomic_read(&sctx->screen->dirty_tex_counter);
   if (unlikely(dirty_tex_counter != sctx->last_dirty_tex_counter)) {
      sctx->last_dirty_tex_counter = dirty_tex_counter;
      sctx->framebuffer.dirty_cbufs |= ((1 << sctx->framebuffer.state.nr_cbufs) - 1);
      sctx->framebuffer.dirty_zsbuf = true;
      si_mark_atom_dirty(sctx, &sctx->atoms.s.framebuffer);
      si_update_all_texture_descriptors(sctx);
   }

   unsigned dirty_buf_counter = p_atomic_read(&sctx->screen->dirty_buf_counter);
   if (unlikely(dirty_buf_counter != sctx->last_dirty_buf_counter)) {
      sctx->last_dirty_buf_counter = dirty_buf_counter;
      /* Rebind all buffers unconditionally. */
      si_rebind_buffer(sctx, NULL);
   }

   si_decompress_textures(sctx, u_bit_consecutive(0, SI_NUM_GRAPHICS_SHADERS));
   si_need_gfx_cs_space(sctx, num_draws);

   /* If we're using a secure context, determine if cs must be secure or not */
   if (GFX_VERSION >= GFX9 && unlikely(radeon_uses_secure_bos(sctx->ws))) {
      bool secure = si_gfx_resources_check_encrypted(sctx);
      if (secure != sctx->ws->cs_is_secure(&sctx->gfx_cs)) {
         si_flush_gfx_cs(sctx, RADEON_FLUSH_ASYNC_START_NEXT_GFX_IB_NOW |
                               RADEON_FLUSH_TOGGLE_SECURE_SUBMISSION, NULL);
      }
   }

   if (HAS_TESS) {
      struct si_shader_selector *tcs = sctx->shader.tcs.cso;

      /* The rarely occuring tcs == NULL case is not optimized. */
      bool same_patch_vertices =
         GFX_VERSION >= GFX9 &&
         tcs && info->vertices_per_patch == tcs->info.base.tess.tcs_vertices_out;

      if (sctx->same_patch_vertices != same_patch_vertices) {
         sctx->same_patch_vertices = same_patch_vertices;
         sctx->do_update_shaders = true;
      }

      if (GFX_VERSION == GFX9 && sctx->screen->info.has_ls_vgpr_init_bug) {
         /* Determine whether the LS VGPR fix should be applied.
          *
          * It is only required when num input CPs > num output CPs,
          * which cannot happen with the fixed function TCS. We should
          * also update this bit when switching from TCS to fixed
          * function TCS.
          */
         bool ls_vgpr_fix =
            tcs && info->vertices_per_patch > tcs->info.base.tess.tcs_vertices_out;

         if (ls_vgpr_fix != sctx->ls_vgpr_fix) {
            sctx->ls_vgpr_fix = ls_vgpr_fix;
            sctx->do_update_shaders = true;
         }
      }
Note that the hardware version parts are templated, as is the HAS_TESS conditional, enabling it to be skipped entirely if there’s no tessellation shader active.
With techniques like this, it’s no surprise that RadeonSI is the driver to beat in performance and low overhead. The latest zink-wip snapshots include similar work, skipping considerable amounts of the draw dispatch when possible, and (hopefully) lowering the CPU overhead of the draw dispatch.
TL;DR: don't use select() + bump the RLIMIT_NOFILE soft limit to
the hard limit in your modern programs.
The primary way to reference, allocate and pin runtime OS resources on
Linux today are file descriptors ("fds"). Originally they were used to
reference open files and directories and maybe a bit more, but today
they may be used to reference almost any kind of runtime resource in
Linux userspace, including open devices, memory
(memfd_create(2)),
timers
(timefd_create(2))
and even processes (with the new
pidfd_open(2)
system call). In a way, the philosophically skewed UNIX concept of
"everything is a file" through the proliferation of fds actually
acquires a bit of sensible meaning: "everything has a file
descriptor" is certainly a much better motto to adopt.
Because of this proliferation of fds, non-trivial modern programs tend to have to deal with substantially more fds at the same time than they traditionally did. Today, you'll often encounter real-life programs that have a few thousand fds open at the same time.
Like on most runtime resources on Linux limits are enforced on file
descriptors: once you hit the resource limit configured via
RLIMIT_NOFILE
any attempt to allocate more is refused with the EMFILE error —
until you close a couple of those you already have open.
Because fds weren't such a universal concept traditionally, the limit
of RLIMIT_NOFILE used to be quite low. Specifically, when the Linux
kernel first invokes userspace it still sets RLIMIT_NOFILE to a low
value of 1024 (soft) and 4096 (hard). (Quick explanation: the soft
limit is what matters and causes the EMFILE issues, the hard limit
is a secondary limit that processes may bump their soft limit to — if
they like — without requiring further privileges to do so. Bumping the
limit further would require privileges however.). A limit of 1024 fds
made fds a scarce resource: APIs tried to be careful with using fds,
since you simply couldn't have that many of them at the same
time. This resulted in some questionable coding decisions and
concepts at various places: often secondary descriptors that are very
similar to fds — but were not actually fds — were introduced
(e.g. inotify watch descriptors), simply to avoid for them the low
limits enforced on true fds. Or code tried to aggressively close fds
when not absolutely needing them (e.g. ftw()/nftw()), losing the
nice + stable "pinning" effect of open fds.
Worse though is that certain OS level APIs were designed having only
the low limits in mind. The worst offender being the BSD/POSIX
select(2)
system call: it only works with fds in the numeric range of 0…1023
(aka FD_SETSIZE-1). If you have an fd outside of this range, tough
luck: select() won't work, and only if you are lucky you'll detect
that and can handle it somehow.
Linux fds are exposed as simple integers, and for most calls it is
guaranteed that the lowest unused integer is allocated for new
fds. Thus, as long as the RLIMIT_NOFILE soft limit is set to 1024
everything remains compatible with select(): the resulting fds will
also be below 1024. Yay. If we'd bump the soft limit above this
threshold though and at some point in time an fd higher than the
threshold is allocated, this fd would not be compatible with
select() anymore.
Because of that, indiscriminately increasing the soft RLIMIT_NOFILE
resource limit today for every userspace process is problematic: as
long as there's userspace code still using select() doing so will
risk triggering hard-to-handle, hard-to-debug errors all over the
place.
However, given the nowadays ubiquitous use of fds for all kinds of resources (did you know, an eBPF program is an fd? and a cgroup too? and attaching an eBPF program to cgroup is another fd? …), we'd really like to raise the limit anyway. 🤔
So before we continue thinking about this problem, let's make the
problem more complex (…uh, I mean… "more exciting") first. Having just
one hard and one soft per-process limit on fds is boring. Let's add
more limits on fds to the mix. Specifically on Linux there are two
system-wide sysctls: fs.nr_open and fs.file-max. (Don't ask me why
one uses a dash and the other an underscore, or why there are two of
them...) On today's kernels they kinda lost their relevance. They had
some originally, because fds weren't accounted by any other
counter. But today, the kernel tracks fds mostly as small pieces of
memory allocated on userspace requests — because that's ultimately
what they are —, and thus charges them to the memory accounting done
anyway.
So now, we have four limits (actually: five if you count the memory accounting) on the same kind of resource, and all of them make a resource artificially scarce that we don't want to be scarce. So what to do?
Back in systemd v240 already (i.e. 2019) we decided to do something about it. Specifically:
Automatically at boot we'll now bump the two sysctls to their maximum, making them effectively ineffective. This one was easy. We got rid of two pretty much redundant knobs. Nice!
The RLIMIT_NOFILE hard limit is bumped substantially to 512K. Yay,
cheap fds! You may have an fd, and you, and you as well,
everyone may have an fd!
But … we left the soft RLIMIT_NOFILE limit at 1024. We weren't
quite ready to break all programs still using select() in 2019
yet. But it's not as bad as it might sound I think: given the hard
limit is bumped every program can easily opt-in to a larger number
of fds, by setting the soft limit to the hard limit early on —
without requiring privileges.
So effectively, with this approach fds should be much less scarce (at least for programs that opt into that), and the limits should be much easier to configure, since there are only two knobs now one really needs to care about:
Configure the RLIMIT_NOFILE hard limit to the maximum number of
fds you actually want to allow a process.
In the program code then either bump the soft to the hard limit, or
not. If you do, you basically declare "I understood the problem, I
promise to not use select(), drown me fds please!". If you don't
then effectively everything remains as it always was.
Apparently this approach worked, since the negative feedback on change was even scarcer than fds traditionally were (ha, fun!). We got reports from pretty much only two projects that were bitten by the change (one being a JVM implementation): they already bumped their soft limit automatically to their hard limit during program initialization, and then allocated an array with one entry per possible fd. With the new high limit this resulted in one massive allocation that traditionally was just a few K, and this caused memory checks to be hit.
Anyway, here's the take away of this blog story:
Don't use select() anymore in 2021. Use poll(), epoll,
iouring, …, but for heaven's sake don't use select(). It might
have been all the rage in the 1990s but it doesn't scale and is
simply not designed for today's programs. I wished the man page of
select() would make clearer how icky it is and that there are
plenty of more preferably APIs.
If you hack on a program that potentially uses a lot of fds, add
some simple
code
somewhere to its start-up that bumps the RLIMIT_NOFILE soft limit
to the hard limit. But if you do this, you have to make sure your
code (and any code that you link to from it) refrains from using
select(). (Note: there's at least one glibc NSS plugin using
select() internally. Given that NSS modules can end up being
loaded into pretty much any process such modules should probably
be considered just buggy.)
If said program you hack on forks off foreign programs, make sure to
reset the RLIMIT_NOFILE soft limit back to
1024
for them. Just because your program might be fine with fds >= 1024
it doesn't mean that those foreign programs might. And unfortunately
RLIMIT_NOFILE is inherited down the process tree unless explicitly
set.
And that's all I have for today. I hope this was enlightening.
It’s been a while.
I meant to blog. I meant to make new zink-wip snapshots. I meant to shower.
Look, none of us are perfect, and I’m just gonna get into some graphics so nobody remembers how this post started.

Boom, beautiful triangles. Look at that ultra smooth fps in mangohud. Protip: if you’re seeing weird flickering or misrenders in your app/game, try throwing mangohud in front of the zink bus to see if it fixes them.
So what has been going on for the past however since the last post?
In a word: lots.
Here’s the rundown.
The 20210517 zink-wip snapshot is the biggest one in history. I say this with no exaggeration.
Changes since the last snapshot include:
One way or another, this is going to feel like a new driver. Ideally I’ll be doing a post every day detailing one of the items on that list, but for now I’ll close the post by saying that zink should be 100%-1000% faster (not a typo) in most scenarios where it was previously much slower than native GL drivers.
Yeah, Big Triangle knows who we are now.
0xC521 One Of: WIFI, VarStoreInfo (VarOffset/VarName): 0x110, VarStore: 0x1, QuestionId: 0x1AB, Size: 1, Min: 0x0, Max 0x2, Step: 0x0 {05 91 53 03 54 03 AB 01 01 00 10 01 10 10 00 02 00}
0xC532 One Of Option: RTL8723, Value (8 bit): 0x1 (default) {09 07 55 03 10 00 01}
0xC539 One Of Option: AP6330, Value (8 bit): 0x2 {09 07 56 03 00 00 02}
0xC540 One Of Option: Disabled, Value (8 bit): 0x0 {09 07 01 04 00 00 00}
0xC547 End One Of {29 02}0x9560 One Of: USB OTG Support, VarStoreInfo (VarOffset/VarName): 0xDA, VarStore: 0x1, QuestionId: 0xA5, Size: 1, Min: 0x0, Max 0x1, Step: 0x0 {05 91 DE 02 DF 02 A5 00 01 00 DA 00 10 10 00 01 00}
0x9571 Default: DefaultId: 0x0, Value (8 bit): 0x1 {5B 06 00 00 00 01}
0x9577 One Of Option: PCI mode, Value (8 bit): 0x1 {09 07 E0 02 00 00 01}
0x957E One Of Option: Disabled, Value (8 bit): 0x0 {09 07 3B 03 00 00 00}
0x9585 End One Of {29 02}1. For some reason I decided that I did not have enough projects going on at the same time already and I started looking into improving support for the G15 family of keyboards. 2. I started studying the g15daemon code and did a build of it to check that it actually works. I believe making sure that you have a known-to-work codebase as a starting point, even if it is somewhat crufty and ugly, is important. This way you know you have code which speaks the right protocol and you can try to slowly morph it into what you want it to become (making small changes testing every step). Even if you decide to mostly re-implement from scratch, then you will likely use the old code as a protocol documentation and it is important to know it actually works. 3. There were number of things which I did not like about g15daemon: 3.1 It uses libusb, taking control of the entire USB-interface used for the gaming functionality away from the kernel. 3.2 As part of this it was not just dealing with the LCD, it also was acting as a dispatches for G-key key-presses. IMHO the key-press handling clearly belonged in the kernel. These keys are just extra keys, all macro functionality is handled inside software on the host/PC side. So as a kernel dev I found that these really should be handled as normal keys and emit normal evdev event with KEY_FOO codes from a /dev/input/event# kernel node. 3.3 It is a daemon, rather then a library; and most other code which would deal with the LCD such as lcdproc was a daemon itself too, so now we would have lcdproc's LCDd talking to g15daemon to get to the LCD which felt rather roundabout. So I set about tackling all of these 4. Kernel changes: I wrote a new drivers/hid/hid-lg-g15.c kernel driver: https://git.kernel.org/pub/scm/linux/kernel/git/torvalds/linux.git/tree/drivers/hid/hid-lg-g15.c Which sends KEY_MACRO1 .. KEY_MACRO18, KEY_MACRO_PRESET1 .. KEY_MACRO_PRESET3, KEY_MACRO_RECORD_START, KEY_KBD_LCD_MENU1 .. KEY_KBD_LCD_MENU4 keypresses for all the special keys. Note this requires that the kernel HID driver is left attached to the USB interface, which required changes on the g15dameon/lcdproc side. This kernel driver also offers a /sys/class/leds/g15::kbd_backlight/ interface which allows controller the backlight intensity through e.g. GNOME kbd-backlight slider in the power pane of the control-center. It also offers a bunch of other LED interfaces under /sys/class/leds/ for controlling things like the LEDs under the M1 - M3 preset selection buttons. The idea here being that the kernel abstract the USB protocol for these gaming-kbd away and that a single userspace daemon for doing gaming kbd macro functionality can be written which will rely only on the kernel interfaces and will thus work with any kbd which has kernel support. 5. lcdproc changes 5.1 lcdproc already did have a g15 driver, which talked to g15daemon. So at first I started testing with this (at this point all my kernel work would not work, since g15daemon would take full control of the USB interface unbinding my kernel driver). I did a couple of bug-fixes / cleanups in this setup to get the code to a starting point where I could run it and it would not show any visible rendering bugs in any of the standard lcdproc screens 5.2 I wrote a little lcdproc helper library, lib_hidraw, which can be used by lcdproc drivers to open a /dev/hidraw device for them. The main feature is, you give the lib_hidraw_open() helper a list of USB-ids you are interested in; and it will then find the right /dev/hidraw# device node (which may be different every boot) and open it for you. 5.3 The actual sending of the bitmap to the LCD screen is quite simple, but it does need to be a very specific format. The format rendering is done by libg15render. So now it was time to replace the code talking to g15daemon with code to directly talk to the LCD through a /dev/hidraw# interface. I kept the libg15render dependency since that was fine. After a bit of refactoring, the actual change over to directly sending the data to the LCD was not that big. 5.4 The change to stop using the g15daemon meant that the g15 driver also lost support for detecting presses on the 4 buttons directly under the LCD which are meant for controlling the menu on the LCD. But now that the code is using /dev/hidraw# the kernel driver I wrote would actually work and report KEY_KBD_LCD_MENU1 .. KEY_KBD_LCD_MENU4 keypresses. So I did a bunch of cleanup / refactoring of lcdproc's linux_input driver and made it take over the reporting of those button presses. 5.5 I wanted everything to just work out of the box, so I wrote some udev rules which automatically generate a lcdproc.conf file configuring the g15 + linux_input drivers (including the key-mapping for the linux_input driver) when a G15 keyboard gets plugged in and the lcdproc.conf file does not exist yet. All this together means that users under Fedora, where I also packaged all this can now do "dnf install lcdproc", pluging their G15 keyboard and everything will just work.
In Turnips in the wild (Part 1) we walked through two issues, one in TauCeti Benchmark and the other in Genshin Impact. Today, I have an update about the one I didn’t have plan to fix, and a showcase of two remaining issues I met in Genshin Impact.
In the previous post I said that I’m not planning to fix the broken water effect since it relied on undefined behavior.

However, I was notified that same issue was fixed in OpenGL driver for Adreno (Freedreno) and the fix is rather easy. Even though for Vulkan it is clearly an undefined behavior, with other APIs it might not be so clear. Thus, given that we want to support translation from other APIs, there are already apps which rely on this behavior, and it would be just a bit more performant - I made a fix for it.

The issue was fixed by “tu: do not corrupt unwritten render targets (!10489)”
The login screen welcomes us with not-so-healthy colors:

And with a few failures to allocate registers in the logs. The failure to allocate registers isn’t good and may cause some important shader not to run, but let’s hope it’s not that. Thus, again, we should take a closer look at the frame.
Once the frame is loaded I’m staring at an empty image at the end of the frame… Not a great start.
Such things mostly happen due to a GPU hang. Since I’m inspecting frames on Linux I took a look at dmesg and confirmed the hang:
[drm:a6xx_irq [msm]] *ERROR* gpu fault ring 0 fence ...
Fortunately, after walking through draw calls, I found that the mis-rendering happens before the call which hangs. Let’s look at it:
 Draw call right before
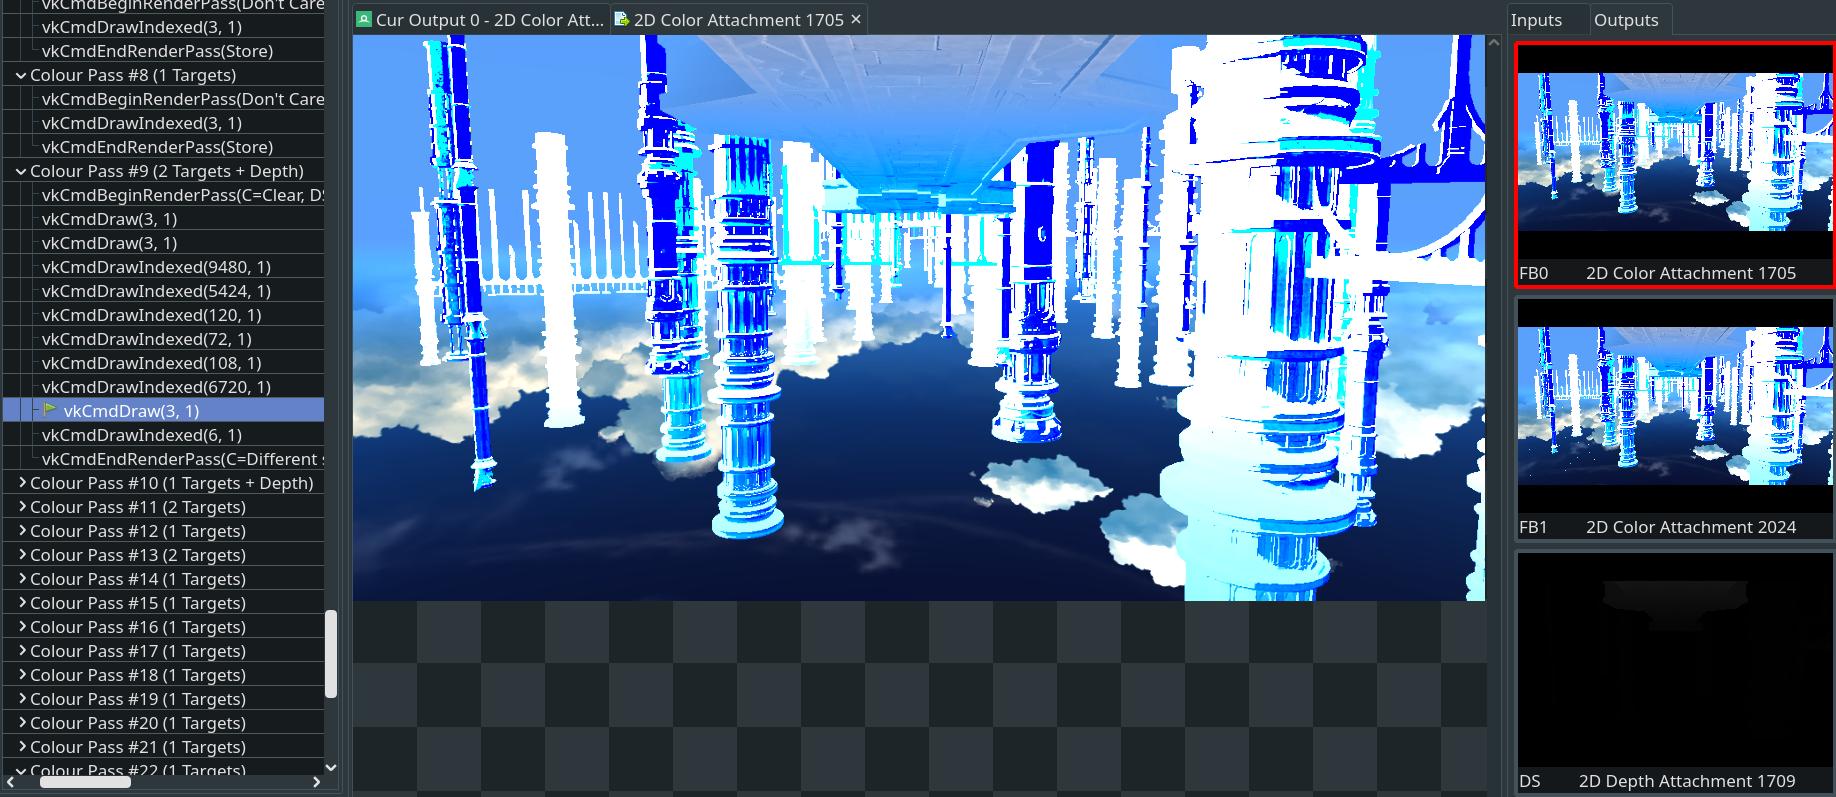 Draw call with the issue
It looks like some fullscreen effect. As in the previous case - the inputs are fine, the only image input is a depth buffer. Also, there are always uniforms passed to the shaders, but when there is only a single problematic draw call - they are rarely an issue (also they are easily comparable with the proprietary driver if I spot some nonsensical values among them).
Now it’s time to look at the shader, ~150 assembly instructions, nothing fancy, nothing obvious, and a lonely kill near the top. Before going into the most “fun” part, it’s a good idea to make sure that the issue is 99% in the shader. RenderDoc has a cool feature which allows to debug shader (its SPIRV code) at a certain fragment (or vertex, or CS invocation), it does the evaluation on CPU, so I can use it as some kind of a reference implementation. In our case the output between RenderDoc and actual shader evaluation on GPU is different:
 Evaluation on CPU: color = vec4(0.17134, 0.40289, 0.69859, 0.00124)
 On GPU: color = vec4(3.1875, 4.25, 5.625, 0.00061)
Knowing the above there is only one thing left to do - reduce the shader until we find the problematic instruction(s). Fortunately there is a proprietary driver which renders the scene correctly, therefor instead of relying on intuition, luck, and persistance - we could quickly bisect to the issue by editing and comparing the edited shader with a reference driver. Actually, it’s possible to do this with shader debugging in RenderDoc, but I had problems with it at that moment and it’s not that easy to do.
The process goes like this:
This way I bisected to this fragment:
_243 = clamp(_243, 0.0, 1.0);
_279 = clamp(_279, 0.0, 1.0);
float _290;
if (_72.x) {
  _290 = _279;
} else {
  _290 = _243;
}

color0 = vec4(_290);
return;
Writing _279 or _243 to color0 produced reasonable results, but writing _290 produced nonsense. The difference was only the presence of condition. Now, having a minimal change which reproduces the issue, it’s possible to compare native assembly.
Bad:
mad.f32 r0.z, c0.y, r0.x, c6.w
sqrt r0.y, r0.y
mul.f r0.x, r1.y, c1.z
(ss)(nop2) mad.f32 r1.z, c6.x, r0.y, c6.y
(nop3) cmps.f.ge r0.y, r0.x, r1.w
(sat)(nop3) sel.b32 r0.w, r0.z, r0.y, r1.z
Good:
(sat)mad.f32 r0.z, c0.y, r0.x, c6.w
sqrt r0.y, r0.y
(ss)(sat)mad.f32 r1.z, c6.x, r0.y, c6.y
(nop2) mul.f r0.y, r1.y, c1.z
add.f r0.x, r0.z, r1.z
(nop3) cmps.f.ge r0.w, r0.y, r1.w
cov.u r1.w, r0.w
(rpt2)nop
(nop3) add.f r0.w, r0.x, r1.w
By running them in my head I reasoned that they should produce the same results. Something works not as expected. After a bit more changes in GLSL, it became apparent that something wrong with clamp(x, 0, 1) which is translated into (sat) modifier for instructions. A bit more digging and I found out that hardware doesn’t understand saturation modifier being placed on sel. instruction (sel is a selection between two values based on third).
Disallowing compiler to place saturation on sel instruction resolved the bug:
 Login screen after the fix
The issue was fixed by “ir3: disallow .sat on SEL instructions (!9666)”

The trees and grass are seem to be rendered incorrectly. After looking through the trace and not finding where they were actually rendered, I studied the trace on proprietary driver and found them. However, there weren’t any such draw calls on Turnip!
The answer was simple, shaders failed to compile due to the failure in a register allocation I mentioned earlier… The general solution would be an implementation of register spilling. However in this case there is a pending merge request that implements a new register allocator, which later would help us implement register spilling. With it shaders can now be compiled!

More Turnip adventures to come!
After a traumatic, tearful goodbye to weird glxgears which took more out of me than expected, I’m back and blogging again.
It’s been…
Well, I guess it’s been a while since my last post, huh.
So what’s happened since then?
Lots? Yeah, definitely lots. It’s May now. And there’s even been a new Mesa release since then.
Quick zink roundup in case you missed any of these:
Cool.
The truth is that I’ve been taking some time off from zink in a completely futile attempt to make progress on something else while zink-wip continues to land. Inspired by this ticket describing issues getting CS:GO working, I decided to tackle part of Mesa that I haven’t worked on much and that hasn’t seen much work in a long time:
PBOs.
Pixel Buffer Objects are used when an application needs to perform a transfer of an image from host memory to the GPU or vice versa. A PBO is said to be downloaded when it is copied from the GPU into a host memory buffer, and it is uploaded when it is copied from a memory buffer into GPU memory. PBO uploads are a common way to load assets from disk (e.g., textures), and PBO downloads are common for…ideally nothing performance related, but RPCS3 uses them in such a way.
Uploading of textures in Mesa can take a number of different codepaths depending on various factors using this priority chain:
The reason CS:GO takes forever to start with zink is because it performs texture uploads of formats which zink does not support, namely alpha and luminance formats that cannot be emulated in Vulkan, during startup in order to load assets onto the GPU. This hits the CPU copy path 100% of the time, which is actually going to be slower than using something like llvmpipe because GPU-based graphics drivers are not intended to be doing everything on the CPU.
I spent a while considering the problem at hand, then decided to start in the place where I could understand what was going on: namely texture downloads. In contrast to uploads, downloads have fewer and simpler codepaths to choose from:
So to effectively improve this with a new mechanism, all I had to do was meet two criteria:
There was also, of course, the additional checklist item of Don’t Be Slower Than The Existing Semi-Fastpath Implementation, but I figured I could get to that later.
The implementation I settled on, after much trial and error, was to set up a SSBO descriptor and then use the source texture as a sampler to texelFetch from in a compute shader. A small, vec4-sized constant buffer is passed to the shader, and then everything is done on the GPU to convert the image to the requested pixel format. The SSBO can then be copied to the output memory buffer, and boom, done.
It took some time to get right, but the results are already quite promising. Here’s some results from pbobench, a tool I’m working on to help measure PBO performance. At present, it populates a 1024x1024 pixel texture using GL_R32F data, then downloads (glGetTextureSubImage) it as fast as possible and measures the number of calls per second, iterating over a number of different formats and types for the download.
Here’s the latest results that I’ve run on IRIS using GL_PACK_ALIGNMENT==4 and GL_PACK_SWAP_BYTES==1 for variety.
32x32
| # | Format | Type | calls/s current | calls/s compute |
|---|---|---|---|---|
| 1 | GL_R32F | GL_FLOAT | 458692 | 20171 |
| 2 | GL_RGBA8 | GL_UNSIGNED_BYTE | 22263 | 20857 |
| 3 | GL_RGB5_A1 | GL_UNSIGNED_BYTE | 22234 | 20211 |
| 4 | GL_RGBA4 | GL_UNSIGNED_BYTE | 22301 | 20247 |
| 5 | GL_SRGB8_ALPHA8 | GL_UNSIGNED_BYTE | 22088 | 20324 |
| 6 | GL_RGBA8_SNORM | GL_BYTE | 22320 | 20315 |
| 7 | GL_RGBA4 | GL_UNSIGNED_SHORT_4_4_4_4 | 22644 | 20094 |
| 8 | GL_RGB5_A1 | GL_UNSIGNED_SHORT_5_5_5_1 | 23189 | 20229 |
| 9 | GL_RGB10_A2 | GL_UNSIGNED_INT_2_10_10_10_REV | 23678 | 19763 |
| 10 | GL_RGB5_A1 | GL_UNSIGNED_INT_2_10_10_10_REV | 23618 | 19914 |
| 11 | GL_RGBA16F | GL_HALF_FLOAT | 208212 | 19306 |
| 12 | GL_RGBA32F | GL_FLOAT | 231616 | 19411 |
| 13 | GL_RGBA16F | GL_FLOAT | 227953 | 18887 |
| 14 | GL_RGB8 | GL_UNSIGNED_BYTE | 22917 | 19691 |
| 15 | GL_RGB565 | GL_UNSIGNED_BYTE | 23000 | 20002 |
| 16 | GL_SRGB8 | GL_UNSIGNED_BYTE | 22852 | 20011 |
| 17 | GL_RGB8_SNORM | GL_BYTE | 26064 | 20006 |
| 18 | GL_RGB565 | GL_UNSIGNED_SHORT_5_6_5 | 24226 | 19813 |
| 19 | GL_R11F_G11F_B10F | GL_UNSIGNED_INT_10F_11F_11F_REV | 140785 | 19755 |
| 20 | GL_R11F_G11F_B10F | GL_HALF_FLOAT | 221776 | 17852 |
| 21 | GL_R11F_G11F_B10F | GL_FLOAT | 193169 | 19660 |
| 22 | GL_RGB9_E5 | GL_UNSIGNED_INT_5_9_9_9_REV | 18616 | 18715 |
| 23 | GL_RGB9_E5 | GL_HALF_FLOAT | 207255 | 18441 |
| 24 | GL_RGB9_E5 | GL_FLOAT | 221998 | 19171 |
| 25 | GL_RGB16F | GL_HALF_FLOAT | 228688 | 18704 |
| 26 | GL_RGB32F | GL_FLOAT | 215211 | 19294 |
| 27 | GL_RGB16F | GL_FLOAT | 233145 | 18858 |
| 28 | GL_RG8 | GL_UNSIGNED_BYTE | 21850 | 18832 |
| 29 | GL_RG8_SNORM | GL_BYTE | 19445 | 18902 |
| 30 | GL_RG16F | GL_HALF_FLOAT | 248270 | 18413 |
| 31 | GL_RG32F | GL_FLOAT | 270652 | 19426 |
| 32 | GL_RG16F | GL_FLOAT | 286874 | 18964 |
| 33 | GL_R8 | GL_UNSIGNED_BYTE | 22093 | 20270 |
| 34 | GL_R8_SNORM | GL_BYTE | 21951 | 20154 |
| 35 | GL_R16F | GL_HALF_FLOAT | 300217 | 19514 |
| 36 | GL_R16F | GL_FLOAT | 454349 | 19784 |
| 37 | GL_RGBA | GL_UNSIGNED_BYTE | 21023 | 19926 |
| 38 | GL_RGBA | GL_UNSIGNED_SHORT_4_4_4_4 | 21408 | 19664 |
| 39 | GL_RGBA | GL_UNSIGNED_SHORT_5_5_5_1 | 22183 | 19090 |
| 40 | GL_RGB | GL_UNSIGNED_BYTE | 21791 | 20054 |
| 41 | GL_RGB | GL_UNSIGNED_SHORT_5_6_5 | 23290 | 19164 |
| 42 | GL_LUMINANCE_ALPHA | GL_UNSIGNED_BYTE | 21032 | 20300 |
| 43 | GL_LUMINANCE | GL_UNSIGNED_BYTE | 21897 | 20565 |
| 44 | GL_ALPHA | GL_UNSIGNED_BYTE | 21941 | 20049 |
The 32x32 size is not very favorable for the new implementation. Drivers are already extremely optimized for small PBO operations, so at best, my work here manages to keep up with the existing codebase for some cases.
Let’s go up a power of two to 64x64.
| # | Format | Type | calls/s current | calls/s compute |
|---|---|---|---|---|
| 45 | GL_R32F | GL_FLOAT | 187911 | 18895 |
| 46 | GL_RGBA8 | GL_UNSIGNED_BYTE | 21094 | 18852 |
| 47 | GL_RGB5_A1 | GL_UNSIGNED_BYTE | 20121 | 18515 |
| 48 | GL_RGBA4 | GL_UNSIGNED_BYTE | 19995 | 18532 |
| 49 | GL_SRGB8_ALPHA8 | GL_UNSIGNED_BYTE | 20829 | 19453 |
| 50 | GL_RGBA8_SNORM | GL_BYTE | 21167 | 18914 |
| 51 | GL_RGBA4 | GL_UNSIGNED_SHORT_4_4_4_4 | 5547 | 19544 |
| 52 | GL_RGB5_A1 | GL_UNSIGNED_SHORT_5_5_5_1 | 5686 | 19762 |
| 53 | GL_RGB10_A2 | GL_UNSIGNED_INT_2_10_10_10_REV | 5934 | 18229 |
| 54 | GL_RGB5_A1 | GL_UNSIGNED_INT_2_10_10_10_REV | 5917 | 18035 |
| 55 | GL_RGBA16F | GL_HALF_FLOAT | 69373 | 17646 |
| 56 | GL_RGBA32F | GL_FLOAT | 66885 | 18507 |
| 57 | GL_RGBA16F | GL_FLOAT | 69091 | 17522 |
| 58 | GL_RGB8 | GL_UNSIGNED_BYTE | 5529 | 18198 |
| 59 | GL_RGB565 | GL_UNSIGNED_BYTE | 5489 | 19197 |
| 60 | GL_SRGB8 | GL_UNSIGNED_BYTE | 5735 | 19455 |
| 61 | GL_RGB8_SNORM | GL_BYTE | 6496 | 19538 |
| 62 | GL_RGB565 | GL_UNSIGNED_SHORT_5_6_5 | 5971 | 19152 |
| 63 | GL_R11F_G11F_B10F | GL_UNSIGNED_INT_10F_11F_11F_REV | 40364 | 19262 |
| 64 | GL_R11F_G11F_B10F | GL_HALF_FLOAT | 76933 | 18650 |
| 65 | GL_R11F_G11F_B10F | GL_FLOAT | 67688 | 18642 |
| 66 | GL_RGB9_E5 | GL_UNSIGNED_INT_5_9_9_9_REV | 4957 | 18894 |
| 67 | GL_RGB9_E5 | GL_HALF_FLOAT | 73775 | 17660 |
| 68 | GL_RGB9_E5 | GL_FLOAT | 69293 | 18703 |
| 69 | GL_RGB16F | GL_HALF_FLOAT | 74131 | 17808 |
| 70 | GL_RGB32F | GL_FLOAT | 67877 | 18735 |
| 71 | GL_RGB16F | GL_FLOAT | 68759 | 17787 |
| 72 | GL_RG8 | GL_UNSIGNED_BYTE | 21194 | 19150 |
| 73 | GL_RG8_SNORM | GL_BYTE | 20644 | 19174 |
| 74 | GL_RG16F | GL_HALF_FLOAT | 90086 | 19010 |
| 75 | GL_RG32F | GL_FLOAT | 88349 | 19285 |
| 76 | GL_RG16F | GL_FLOAT | 89450 | 19041 |
| 77 | GL_R8 | GL_UNSIGNED_BYTE | 21215 | 19813 |
| 78 | GL_R8_SNORM | GL_BYTE | 21280 | 19457 |
| 79 | GL_R16F | GL_HALF_FLOAT | 107419 | 19180 |
| 80 | GL_R16F | GL_FLOAT | 189485 | 19045 |
| 81 | GL_RGBA | GL_UNSIGNED_BYTE | 20784 | 19454 |
| 82 | GL_RGBA | GL_UNSIGNED_SHORT_4_4_4_4 | 5645 | 19375 |
| 83 | GL_RGBA | GL_UNSIGNED_SHORT_5_5_5_1 | 5625 | 19078 |
| 84 | GL_RGB | GL_UNSIGNED_BYTE | 5753 | 19196 |
| 85 | GL_RGB | GL_UNSIGNED_SHORT_5_6_5 | 5917 | 17889 |
| 86 | GL_LUMINANCE_ALPHA | GL_UNSIGNED_BYTE | 5553 | 19014 |
| 87 | GL_LUMINANCE | GL_UNSIGNED_BYTE | 21420 | 18528 |
| 88 | GL_ALPHA | GL_UNSIGNED_BYTE | 21506 | 19944 |
64x64 starts to show some interesting results, cases like GL_SRGB8 where the compute implementation has dominant performance.
| # | Format | Type | calls/s current | calls/s compute |
|---|---|---|---|---|
| 89 | GL_R32F | GL_FLOAT | 55577 | 16096 |
| 90 | GL_RGBA8 | GL_UNSIGNED_BYTE | 17315 | 15264 |
| 91 | GL_RGB5_A1 | GL_UNSIGNED_BYTE | 17735 | 15541 |
| 92 | GL_RGBA4 | GL_UNSIGNED_BYTE | 17191 | 15486 |
| 93 | GL_SRGB8_ALPHA8 | GL_UNSIGNED_BYTE | 17343 | 14831 |
| 94 | GL_RGBA8_SNORM | GL_BYTE | 17362 | 15710 |
| 95 | GL_RGBA4 | GL_UNSIGNED_SHORT_4_4_4_4 | 1367 | 15981 |
| 96 | GL_RGB5_A1 | GL_UNSIGNED_SHORT_5_5_5_1 | 1367 | 16372 |
| 97 | GL_RGB10_A2 | GL_UNSIGNED_INT_2_10_10_10_REV | 1475 | 15181 |
| 98 | GL_RGB5_A1 | GL_UNSIGNED_INT_2_10_10_10_REV | 1482 | 14789 |
| 99 | GL_RGBA16F | GL_HALF_FLOAT | 19254 | 14916 |
| 100 | GL_RGBA32F | GL_FLOAT | 18465 | 13109 |
| 101 | GL_RGBA16F | GL_FLOAT | 18141 | 13075 |
| 102 | GL_RGB8 | GL_UNSIGNED_BYTE | 1439 | 16143 |
| 103 | GL_RGB565 | GL_UNSIGNED_BYTE | 1441 | 16252 |
| 104 | GL_SRGB8 | GL_UNSIGNED_BYTE | 1407 | 16106 |
| 105 | GL_RGB8_SNORM | GL_BYTE | 1583 | 16071 |
| 106 | GL_RGB565 | GL_UNSIGNED_SHORT_5_6_5 | 1520 | 16246 |
| 107 | GL_R11F_G11F_B10F | GL_UNSIGNED_INT_10F_11F_11F_REV | 10888 | 16137 |
| 108 | GL_R11F_G11F_B10F | GL_HALF_FLOAT | 22128 | 14779 |
| 109 | GL_R11F_G11F_B10F | GL_FLOAT | 18807 | 13986 |
| 110 | GL_RGB9_E5 | GL_UNSIGNED_INT_5_9_9_9_REV | 1251 | 15138 |
| 111 | GL_RGB9_E5 | GL_HALF_FLOAT | 22464 | 14482 |
| 112 | GL_RGB9_E5 | GL_FLOAT | 18562 | 14075 |
| 113 | GL_RGB16F | GL_HALF_FLOAT | 22072 | 15038 |
| 114 | GL_RGB32F | GL_FLOAT | 18801 | 14100 |
| 115 | GL_RGB16F | GL_FLOAT | 18774 | 13864 |
| 116 | GL_RG8 | GL_UNSIGNED_BYTE | 18446 | 16890 |
| 117 | GL_RG8_SNORM | GL_BYTE | 18493 | 17353 |
| 118 | GL_RG16F | GL_HALF_FLOAT | 26391 | 15989 |
| 119 | GL_RG32F | GL_FLOAT | 25502 | 15230 |
| 120 | GL_RG16F | GL_FLOAT | 25498 | 15027 |
| 121 | GL_R8 | GL_UNSIGNED_BYTE | 18754 | 17213 |
| 122 | GL_R8_SNORM | GL_BYTE | 16275 | 17254 |
| 123 | GL_R16F | GL_HALF_FLOAT | 31097 | 16525 |
| 124 | GL_R16F | GL_FLOAT | 54923 | 16005 |
| 125 | GL_RGBA | GL_UNSIGNED_BYTE | 17905 | 15956 |
| 126 | GL_RGBA | GL_UNSIGNED_SHORT_4_4_4_4 | 1434 | 16266 |
| 127 | GL_RGBA | GL_UNSIGNED_SHORT_5_5_5_1 | 1462 | 16251 |
| 128 | GL_RGB | GL_UNSIGNED_BYTE | 1465 | 16370 |
| 129 | GL_RGB | GL_UNSIGNED_SHORT_5_6_5 | 1525 | 16550 |
| 130 | GL_LUMINANCE_ALPHA | GL_UNSIGNED_BYTE | 1416 | 15919 |
| 131 | GL_LUMINANCE | GL_UNSIGNED_BYTE | 18876 | 16872 |
| 132 | GL_ALPHA | GL_UNSIGNED_BYTE | 17523 | 16271 |
By the 128x128 texture size, the massive performance lead that the existing glGetTextureSubImage handling had has dwindled to 20-50% for some cases, while the compute shader is now outperforming by a factor of ten or more for other cases.
| # | Format | Type | calls/s current | calls/s compute |
|---|---|---|---|---|
| 133 | GL_R32F | GL_FLOAT | 14768 | 8850 |
| 134 | GL_RGBA8 | GL_UNSIGNED_BYTE | 10980 | 9142 |
| 135 | GL_RGB5_A1 | GL_UNSIGNED_BYTE | 11034 | 9063 |
| 136 | GL_RGBA4 | GL_UNSIGNED_BYTE | 11104 | 9160 |
| 137 | GL_SRGB8_ALPHA8 | GL_UNSIGNED_BYTE | 11196 | 9085 |
| 138 | GL_RGBA8_SNORM | GL_BYTE | 10843 | 9139 |
| 139 | GL_RGBA4 | GL_UNSIGNED_SHORT_4_4_4_4 | 500 | 10001 |
| 140 | GL_RGB5_A1 | GL_UNSIGNED_SHORT_5_5_5_1 | 496 | 9775 |
| 141 | GL_RGB10_A2 | GL_UNSIGNED_INT_2_10_10_10_REV | 484 | 8868 |
| 142 | GL_RGB5_A1 | GL_UNSIGNED_INT_2_10_10_10_REV | 508 | 8994 |
| 143 | GL_RGBA16F | GL_HALF_FLOAT | 5025 | 7952 |
| 144 | GL_RGBA32F | GL_FLOAT | 4731 | 6635 |
| 145 | GL_RGBA16F | GL_FLOAT | 4722 | 6519 |
| 146 | GL_RGB8 | GL_UNSIGNED_BYTE | 497 | 9356 |
| 147 | GL_RGB565 | GL_UNSIGNED_BYTE | 499 | 9181 |
| 148 | GL_SRGB8 | GL_UNSIGNED_BYTE | 479 | 9067 |
| 149 | GL_RGB8_SNORM | GL_BYTE | 784 | 9704 |
| 150 | GL_RGB565 | GL_UNSIGNED_SHORT_5_6_5 | 527 | 9569 |
| 151 | GL_R11F_G11F_B10F | GL_UNSIGNED_INT_10F_11F_11F_REV | 1396 | 8938 |
| 152 | GL_R11F_G11F_B10F | GL_HALF_FLOAT | 5697 | 8283 |
| 153 | GL_R11F_G11F_B10F | GL_FLOAT | 4760 | 6599 |
| 154 | GL_RGB9_E5 | GL_UNSIGNED_INT_5_9_9_9_REV | 444 | 8123 |
| 155 | GL_RGB9_E5 | GL_HALF_FLOAT | 5836 | 8305 |
| 156 | GL_RGB9_E5 | GL_FLOAT | 4782 | 6944 |
| 157 | GL_RGB16F | GL_HALF_FLOAT | 5669 | 8313 |
| 158 | GL_RGB32F | GL_FLOAT | 4759 | 6819 |
| 159 | GL_RGB16F | GL_FLOAT | 4779 | 6912 |
| 160 | GL_RG8 | GL_UNSIGNED_BYTE | 11772 | 10298 |
| 161 | GL_RG8_SNORM | GL_BYTE | 11771 | 10555 |
| 162 | GL_RG16F | GL_HALF_FLOAT | 6900 | 9324 |
| 163 | GL_RG32F | GL_FLOAT | 6601 | 7928 |
| 164 | GL_RG16F | GL_FLOAT | 6461 | 7965 |
| 165 | GL_R8 | GL_UNSIGNED_BYTE | 12249 | 10936 |
| 166 | GL_R8_SNORM | GL_BYTE | 12423 | 11080 |
| 167 | GL_R16F | GL_HALF_FLOAT | 8790 | 10254 |
| 168 | GL_R16F | GL_FLOAT | 15005 | 7751 |
| 169 | GL_RGBA | GL_UNSIGNED_BYTE | 11094 | 8086 |
| 170 | GL_RGBA | GL_UNSIGNED_SHORT_4_4_4_4 | 506 | 9767 |
| 171 | GL_RGBA | GL_UNSIGNED_SHORT_5_5_5_1 | 494 | 9790 |
| 172 | GL_RGB | GL_UNSIGNED_BYTE | 497 | 9689 |
| 173 | GL_RGB | GL_UNSIGNED_SHORT_5_6_5 | 532 | 9917 |
| 174 | GL_LUMINANCE_ALPHA | GL_UNSIGNED_BYTE | 487 | 10353 |
| 175 | GL_LUMINANCE | GL_UNSIGNED_BYTE | 12297 | 10944 |
| 176 | GL_ALPHA | GL_UNSIGNED_BYTE | 12310 | 10940 |
256x256 is the point at which the difference starts to become even more pronounced. The cases where the compute implementation is definitively worse are few and far between, and many of the cases in which it was previously worse are now neck and neck.
| # | Format | Type | calls/s current | calls/s compute |
|---|---|---|---|---|
| 177 | GL_R32F | GL_FLOAT | 3739 | 3348 |
| 178 | GL_RGBA8 | GL_UNSIGNED_BYTE | 4533 | 3409 |
| 179 | GL_RGB5_A1 | GL_UNSIGNED_BYTE | 4327 | 3354 |
| 180 | GL_RGBA4 | GL_UNSIGNED_BYTE | 4609 | 3274 |
| 181 | GL_SRGB8_ALPHA8 | GL_UNSIGNED_BYTE | 4520 | 3333 |
| 182 | GL_RGBA8_SNORM | GL_BYTE | 4296 | 3437 |
| 183 | GL_RGBA4 | GL_UNSIGNED_SHORT_4_4_4_4 | 236 | 3614 |
| 184 | GL_RGB5_A1 | GL_UNSIGNED_SHORT_5_5_5_1 | 237 | 3512 |
| 185 | GL_RGB10_A2 | GL_UNSIGNED_INT_2_10_10_10_REV | 235 | 2715 |
| 186 | GL_RGB5_A1 | GL_UNSIGNED_INT_2_10_10_10_REV | 230 | 3331 |
| 187 | GL_RGBA16F | GL_HALF_FLOAT | 1291 | 2694 |
| 188 | GL_RGBA32F | GL_FLOAT | 1127 | 1020 |
| 189 | GL_RGBA16F | GL_FLOAT | 1127 | 1000 |
| 190 | GL_RGB8 | GL_UNSIGNED_BYTE | 223 | 3648 |
| 191 | GL_RGB565 | GL_UNSIGNED_BYTE | 225 | 3550 |
| 192 | GL_SRGB8 | GL_UNSIGNED_BYTE | 227 | 3487 |
| 193 | GL_RGB8_SNORM | GL_BYTE | 358 | 3586 |
| 194 | GL_RGB565 | GL_UNSIGNED_SHORT_5_6_5 | 252 | 3567 |
| 195 | GL_R11F_G11F_B10F | GL_UNSIGNED_INT_10F_11F_11F_REV | 661 | 3084 |
| 196 | GL_R11F_G11F_B10F | GL_HALF_FLOAT | 1509 | 3055 |
| 197 | GL_R11F_G11F_B10F | GL_FLOAT | 1164 | 1222 |
| 198 | GL_RGB9_E5 | GL_UNSIGNED_INT_5_9_9_9_REV | 209 | 2636 |
| 199 | GL_RGB9_E5 | GL_HALF_FLOAT | 1499 | 2571 |
| 200 | GL_RGB9_E5 | GL_FLOAT | 1182 | 1234 |
| 201 | GL_RGB16F | GL_HALF_FLOAT | 1510 | 2955 |
| 202 | GL_RGB32F | GL_FLOAT | 1179 | 1112 |
| 203 | GL_RGB16F | GL_FLOAT | 1172 | 1247 |
| 204 | GL_RG8 | GL_UNSIGNED_BYTE | 5019 | 3572 |
| 205 | GL_RG8_SNORM | GL_BYTE | 5043 | 4201 |
| 206 | GL_RG16F | GL_HALF_FLOAT | 1796 | 3471 |
| 207 | GL_RG32F | GL_FLOAT | 1677 | 2701 |
| 208 | GL_RG16F | GL_FLOAT | 1668 | 2638 |
| 209 | GL_R8 | GL_UNSIGNED_BYTE | 5374 | 4084 |
| 210 | GL_R8_SNORM | GL_BYTE | 5409 | 2985 |
| 211 | GL_R16F | GL_HALF_FLOAT | 2222 | 880 |
| 212 | GL_R16F | GL_FLOAT | 3689 | 2904 |
| 213 | GL_RGBA | GL_UNSIGNED_BYTE | 4490 | 3179 |
| 214 | GL_RGBA | GL_UNSIGNED_SHORT_4_4_4_4 | 220 | 3366 |
| 215 | GL_RGBA | GL_UNSIGNED_SHORT_5_5_5_1 | 237 | 3405 |
| 216 | GL_RGB | GL_UNSIGNED_BYTE | 228 | 3392 |
| 217 | GL_RGB | GL_UNSIGNED_SHORT_5_6_5 | 253 | 3180 |
| 218 | GL_LUMINANCE_ALPHA | GL_UNSIGNED_BYTE | 229 | 3763 |
| 219 | GL_LUMINANCE | GL_UNSIGNED_BYTE | 5400 | 4099 |
| 220 | GL_ALPHA | GL_UNSIGNED_BYTE | 5473 | 3543 |
512x512 is even better for the compute-based implementation, which remains extremely consistent across nearly all cases. It now exhibits a commanding lead of almost 1500% for some cases, while at worst, it maintains a consistent rate and achieves only 60% of baseline performance for a few cases.
| # | Format | Type | calls/s current | calls/s compute |
|---|---|---|---|---|
| 221 | GL_R32F | GL_FLOAT | 831 | 711 |
| 222 | GL_RGBA8 | GL_UNSIGNED_BYTE | 839 | 724 |
| 223 | GL_RGB5_A1 | GL_UNSIGNED_BYTE | 856 | 707 |
| 224 | GL_RGBA4 | GL_UNSIGNED_BYTE | 831 | 644 |
| 225 | GL_SRGB8_ALPHA8 | GL_UNSIGNED_BYTE | 869 | 679 |
| 226 | GL_RGBA8_SNORM | GL_BYTE | 827 | 730 |
| 227 | GL_RGBA4 | GL_UNSIGNED_SHORT_4_4_4_4 | 77 | 709 |
| 228 | GL_RGB5_A1 | GL_UNSIGNED_SHORT_5_5_5_1 | 77 | 718 |
| 229 | GL_RGB10_A2 | GL_UNSIGNED_INT_2_10_10_10_REV | 75 | 664 |
| 230 | GL_RGB5_A1 | GL_UNSIGNED_INT_2_10_10_10_REV | 75 | 662 |
| 231 | GL_RGBA16F | GL_HALF_FLOAT | 304 | 550 |
| 232 | GL_RGBA32F | GL_FLOAT | 253 | 403 |
| 233 | GL_RGBA16F | GL_FLOAT | 253 | 358 |
| 234 | GL_RGB8 | GL_UNSIGNED_BYTE | 74 | 522 |
| 235 | GL_RGB565 | GL_UNSIGNED_BYTE | 74 | 594 |
| 236 | GL_SRGB8 | GL_UNSIGNED_BYTE | 74 | 618 |
| 237 | GL_RGB8_SNORM | GL_BYTE | 156 | 575 |
| 238 | GL_RGB565 | GL_UNSIGNED_SHORT_5_6_5 | 80 | 593 |
| 239 | GL_R11F_G11F_B10F | GL_UNSIGNED_INT_10F_11F_11F_REV | 160 | 585 |
| 240 | GL_R11F_G11F_B10F | GL_HALF_FLOAT | 353 | 489 |
| 241 | GL_R11F_G11F_B10F | GL_FLOAT | 282 | 366 |
| 242 | GL_RGB9_E5 | GL_UNSIGNED_INT_5_9_9_9_REV | 67 | 518 |
| 243 | GL_RGB9_E5 | GL_HALF_FLOAT | 352 | 488 |
| 244 | GL_RGB9_E5 | GL_FLOAT | 279 | 365 |
| 245 | GL_RGB16F | GL_HALF_FLOAT | 356 | 472 |
| 246 | GL_RGB32F | GL_FLOAT | 282 | 352 |
| 247 | GL_RGB16F | GL_FLOAT | 269 | 322 |
| 248 | GL_RG8 | GL_UNSIGNED_BYTE | 936 | 273 |
| 249 | GL_RG8_SNORM | GL_BYTE | 954 | 354 |
| 250 | GL_RG16F | GL_HALF_FLOAT | 434 | 494 |
| 251 | GL_RG32F | GL_FLOAT | 393 | 384 |
| 252 | GL_RG16F | GL_FLOAT | 392 | 284 |
| 253 | GL_R8 | GL_UNSIGNED_BYTE | 1398 | 624 |
| 254 | GL_R8_SNORM | GL_BYTE | 1415 | 630 |
| 255 | GL_R16F | GL_HALF_FLOAT | 535 | 530 |
| 256 | GL_R16F | GL_FLOAT | 819 | 490 |
| 257 | GL_RGBA | GL_UNSIGNED_BYTE | 861 | 504 |
| 258 | GL_RGBA | GL_UNSIGNED_SHORT_4_4_4_4 | 76 | 540 |
| 259 | GL_RGBA | GL_UNSIGNED_SHORT_5_5_5_1 | 78 | 685 |
| 260 | GL_RGB | GL_UNSIGNED_BYTE | 74 | 676 |
| 261 | GL_RGB | GL_UNSIGNED_SHORT_5_6_5 | 82 | 706 |
| 262 | GL_LUMINANCE_ALPHA | GL_UNSIGNED_BYTE | 75 | 825 |
| 263 | GL_LUMINANCE | GL_UNSIGNED_BYTE | 1431 | 997 |
| 264 | GL_ALPHA | GL_UNSIGNED_BYTE | 1399 | 962 |
1024x1024 is the true gauntlet for PBO downloads, and it’s really not something that is likely to be seen in many places. But pbobench covers it because why not, so here we are. The results here are much less pronounced just because the amount of time spent in memcpy on the CPU ends up being so large for both implmentations that the GPU doesn’t get much time to do work.
Improvements are ongoing for compute-accelerated PBOs, and performance continues to rise. I’m looking forward to tackling uploads next, as that should directly improve load times for GL-based games across the board.
As part of the ongoing saga of working for a company that has an interest in gaming, games have been played recently.
One of those games is Tomb Raider (2013), and until very recently it had some issues when run on zink:

Here we see the wild triangle in its native habitat, foraging for sustenance among its siblings.
All of that changed today, however, when I rebased zink-wip from a couple weeks ago and then hucked it back into the repo with a new snapshot name and zero testing.
I was subsequently informed that I had broken our beautiful triangle princess, and Senior Misrendering Connoisseur Witold Baryluk has provided us with actual gameplay footage with all settings set to EXTREME:

 glxgears rendered on an Apple M1
After beginning a compiler for the Apple M1 GPU, the next step is to develop a graphics driver exercising the compiler. Since the last post two weeks ago, I’ve begun a Gallium driver for the M1, implementing much of the OpenGL 2.1 and ES 2.0 specifications. With the compiler and driver together, we’re now able to run OpenGL workloads like glxgears and scenes from glmark2 on the M1 with an open source stack. We are passing about 75% of the OpenGL ES 2.0 tests in the drawElements Quality Program used to establish Khronos conformance. To top it off, the compiler and driver are now upstreamed in Mesa!
Gallium is a driver framework inside Mesa. It splits drivers into frontends, like OpenGL and OpenCL, and backends, like Intel and AMD. In between, Gallium has a common caching system for graphics and compute state, reducing the CPU overhead of every Gallium driver. The code sharing, central to Gallium’s design, allows high-performance drivers to be written at a low cost. For us, that means we can focus on writing a Gallium backend for Apple’s GPU and pick up OpenGL and OpenCL support “for free”.
More sharing is possible. A key responsibility of the Gallium backend is to translate Gallium’s state objects into hardware packets, so we need a good representation of hardware packets. While packed bitfields can work, C’s bitfields have performance and safety (overflow) concerns. Hand-coded C structures lack pretty-printing needed for efficient debugging. Finally, while reverse-engineering, hand-coded C structures tend to accumulate random magic numbers in driver code, which is undesirable. These issues are not new; systems like Intel’s GenXML and Nouveau’s envytools solve them by allowing the hardware packets to be described as XML while all necessary C code is auto-generated. For Asahi, I’ve opted to use GenXML, providing a concise description of my reverse-engineering results and an ergonomic API for the driver.
The XML contains recently reverse-engineered packets, like those describing textures and samplers. Fortunately, these packets map closely to both Metal and Gallium, allowing a natural translation. Coupled with Dougall Johnson’s latest notes on texture instructions, adding texture support to the Gallium driver and NIR compiler was a cinch.
The resulting XML is somewhat smaller than that of other reverse-engineered drivers of similar maturity. As discussed in the previous post, Apple relies on shader code in lieu of fixed-function graphics hardware for tasks like vertex attribute fetch and blending. Apple’s design reduces the hardware surface area, in turn reducing the number of packets in the XML at the expense of extra driver code to produce the needed shader variants. Here is yet another win for code sharing: the most complex code needed is for blending and logic operations, for which Mesa already has lowering code. Mali (Panfrost) needs some blending lowered to shader code, and all Mesa drivers need advanced blending equations lowered (modes like overlay, colour dodge, and screen). As a result, it will be a simple task to wire in the “load tilebuffer to register” instruction and Mesa’s blending code and see a thousand more tests pass.
Although Apple culled a great deal of legacy functionality from their GPU, some features are retained to support older APIs like compatibility contexts of desktop OpenGL, even when the features are inaccessible from Metal. Index buffers and primitive types exhibit this phenomenon. In Metal, an application can draw using a 16-bit or 32-bit index buffer, selecting primitives like triangles and triangle strips, with primitive restart always enabled. Most graphics developers want to use this fast path; by only supporting the fast path, Metal prevents a game developer from accidentally introducing slow code. However, this limits our ability to implement Khronos APIs like OpenGL and Vulkan on top of the Apple hardware… or does it?
In addition to the subset supported by Metal, the Khronos APIs also support 8-bit index buffers, additional primitive types like triangle fans, and an option to disable primitive restart. True, some of this functionality is unnecessary. Real geometry usually requires more than 256 vertices, so 8-bit index buffers are a theoretical curiosity. Primitives like triangle fans can bring a hardware penalty relative to triangle strips due to poor cache locality while offering no generality over indexed triangles. Well-written apps generally require primitive restart, and it’s almost free for apps that don’t need it. Even so, real applications (and the Khronos conformance tests) do use these features, so we need to support them in our OpenGL and Vulkan drivers. The issue does not only affect us – drivers layered on top of Metal like MoltenVK struggle with these exact gaps.
If Apple left these features in the hardware but never wired them into Metal, we’d like to know. But clean room reverse-engineering the hardware requires observing the output of the proprietary driver and looking for patterns, so if the proprietary (Metal) driver doesn’t use the functionality, how can we ever know it exists?
This is a case for an underappreciated reverse-engineering technique: guesswork. Hardware designers are logical engineers. If we can understand how Apple approached the hardware design, we can figure out where these hidden features should be in the command stream. We’re looking for conspicuous gaps in our understanding of the hardware, like looking for black holes by observing the absence of light. Consider index buffers, which are configured by an indexed draw packet with a field describing the size. After trying many indexed draws in Metal, I was left with the following reverse-engineered fragment:
<enum name="Index size">
  <value name="U16" value="1"/>
  <value name="U32" value="2"/>
</enum>

<struct name="Indexed draw" size="32">
...
  <field name="Index size" size="2" start="2:17" type="Index size"/>
...
</struct>
If the hardware only supported what Metal supports, this fragment would be unusual. Note 16-bit and 32-bit index buffers are encoded as 1 and 2. In binary, that’s 01 and 10, occupying two different bits, so we know the index size is at least 2 bits wide. That leaves 00 (0) and 11 (3) as possible unidentified index sizes. Now observe index sizes are multiples of 8 bits and powers of two, so there is a natural encoding as the base-2 logarithm of the index size in bytes. This matches our XML fragment, since log2(16 / 8) = 1 and log2(32 / 8) = 2. From here, we make our leap of faith: if the hardware supports 8-bit index buffers, it should be encoded with value log2(8 / 8) = 0. Sure enough, if we try out this guess, we’ll find it passes the relevant OpenGL tests. Success.
Finding the missing primitive types works the same way. The primitive type field is 4-bits in the hardware, allowing for 16 primitive types to be encoded, while Metal only uses 5, leaving only 11 to brute force with the tests in hand. Likewise, few bits vary between an indexed draw of triangles (no primitive restart) and an indexed draw of triangle strips (with primitive restart), giving us a natural candidate for a primitive restart enable bit. Our understanding of the hardware is coming together.
One outstanding difficulty is ironically specific to macOS: the IOGPU interface with the kernel. Traditionally, open source drivers on Linux use simple kernel space drivers together with complex userspace drivers. The userspace (Mesa) handles all 3D state, and the kernel simply handles memory management and scheduling. However, macOS does not follow this model; the IOGPU kernel extension, common to all GPUs on macOS, is made aware of graphics state like surface dimensions and even details about mipmapping. Many of these mechanisms can be ignored in Mesa, but there is still an uncomfortably large volume of “magic” to interface with the kernel, like the memory mapping descriptors. The good news is many of these elements can be simplified when we write a Linux kernel driver. The bad news is that they do need to be reverse-engineered and implemented in Mesa if we would like native Vulkan support on Macs. Still, we know enough to drive the GPU from macOS… and hey, soon enough, we’ll all be running Linux on our M1 machines anyway :-)
As you may know, I’ve been working on VK-GL-CTS for some time now. VK-GL-CTS the Conformance Test Suite for Vulkan and OpenGL, a large collection of tests used to verify implementations of the Vulkan and OpenGL APIs work as intended by the specification. My work has been mainly focused on the Vulkan side of things as part of Igalia's ongoing collaboration with Valve.
Last year, Khronos released the official specification of the Vulkan ray tracing extensions and I had the chance to participate in the final stages of the process by improving test coverage and fixing bugs in existing CTS tests, which is work that continues to this day mixed with other types of tasks in my backlog.
As part of this effort I learned many bits of the new Vulkan Ray Tracing API and even provided some very minor feedback about the spec, which resulted in me being listed as contributor to the VK_KHR_acceleration_structure extension.
Now that the waters are a bit more calm, I wanted to give you a list of resources and a small overview of the main concepts behind the Vulkan version of ray tracing.
There are a few basic resources that can help you get acquainted with the new APIs.
The official Khronos blog published an overview of the ray tracing extensions that explains some of the basic concepts like acceleration structures, ray tracing pipelines (and what their different shader stages do) and ray queries.
Intel’s Jason Ekstrand gave an excellent talk about ray tracing in Vulkan in XDC 2020. I highly recommend you to watch it if you’re interested.
For those wanting to get their hands on some code, the Khronos official Vulkan Samples repository includes a basic ray tracing sample.
The official Vulkan specification text (warning: very large HTML document), while intimidating, is actually a good source to learn many new parts of the API. If you’re already familiar with Vulkan, the different sections about ray tracing and ray tracing pipelines are worth reading.
The basic idea of ray tracing, as a tool, is that you must be able to choose an arbitrary point in space as the ray origin and a direction vector, and ask your implementation if that ray intersects anything along the way given a minimum and maximum distance.
In a modern computer or console game the number of triangles present in a scene is huge, so you can imagine detecting intersections between them and your ray can be very expensive. The implementation typically needs to organize the scene geometry in a hierarchical tree-like structure that can be traversed more efficiently by discarding large amounts of geometry with some simple tests. That’s what an Acceleration Structure is.
Fortunately, you don’t have to organize the scene geometry yourself. Implementations are free to choose the best and most suitable acceleration structure format according to the underlying hardware. They will build this acceleration structure for you and give you an opaque handle to it that you can use in your app with the rest of the API. You’re only required to provide the long list of geometries making up your scene.
You may be thinking, and you’d be right, that building the acceleration structure must be a complex and costly process itself, and it is. For this reason, you must try to avoid rebuilding them completely all the time, in every frame of the app. This is why acceleration structures are divided in two types: bottom level and top level.
Bottom level acceleration structures (BLAS) contain lists of geometries and typically represent whole models in your scene: a building, a tree, an object, etc.
Top level acceleration structures (TLAS) contain lists of “pointers” to bottom level acceleration structures, together with a transformation matrix for each pointer.
In the diagram below, taken from Jason Ekstrand’s XDC 2020 talk[1], you can see the blue square representing the TLAS, the red squares representing BLAS and the purple squares representing geometries.

The whole idea behind this is that you may be able to build the bottom level acceleration structure for each model only once as long as the model itself does not change, and you will include this model in your scene one or more times. Each time, it will have an associated transformation matrix that will allow you to translate, rotate or scale the model without rebuilding it. So, in each frame, you may only have to rebuild the top level acceleration structure while keeping the bottom level ones intact. Other tricks you can use include rebuilding the top level acceleration structure in a reduced frame rate compared to the app, or using a simplified version of the world geometry when tracing rays instead of the more detailed model used when rendering the scene normally.
Acceleration structures, ray origins and direction vectors typically use world-space coordinates.
In its most basic form, you can access the ray tracing facilities of the implementation by using ray queries. Before ray tracing, Vulkan already had graphics and compute pipelines. One of the main components of those pipelines are shader programs: application-provided instructions that run on the GPU telling it what to do and, in a graphics pipeline, how to process geometry data (vertex shaders) and calculate the color of each pixel that ends up on the screen (fragment shaders).
When ray queries are supported, you can trace rays from those “classic” shader programs for any purpose. For example, to implement lighting effects in a fragment shader.
The full power of ray tracing in Vulkan comes in the form of a completely new type of pipeline, the ray tracing pipeline, that complements the existing compute and graphics pipelines.
Most Vulkan ray tracing tutorials, including the Khronos blog post I mentioned before, explain the basics of these pipelines, including the new shader stages (ray generation, intersection, any hit, closest hit, etc) and how they work together. They cover acceleration structure traversal for each ray and how that triggers execution of a particular shader program provided by your app. The image below, taken from the official Vulkan specification[2], contains the typical representation of this traversal process.

The main difference between the traditional graphics pipelines and ray tracing pipelines is the following one. If you’re familiar with the classic graphics pipelines, you know the app decides and has full control over what is being drawn at any moment. Your command stream usually looks like this.
Begin render pass (I’ll be using this depth buffer to discard overlapping geometry on the screen and the resulting pixels need to be written to this image)
Bind descriptor sets (I’ll be using these textures and data buffers)
Bind pipeline (This is how the whole process looks like, including the crucial part of shader programs: let me tell you what to do with each vertex and how to calculate the color of each resulting pixel)
Draw this
Draw that
Bind pipeline (I’ll be using different shader programs for the next draws, thank you)
Draw some more
Draw even more
Bind descriptor sets (The textures and other data will be different from now on)
Bind pipeline (The shaders will be different too)
Additional draws
Final draws (Almost there, buddy)
End render pass (I’m done)
Each draw command in the command stream instructs the GPU to draw an object and, because the app is recording that command, the app knows what that object is and the appropriate resources that need to be used to draw that object, including textures, data buffers and shader programs. Before recording the draw command, the app can prepare everything in advance and tell the implementation which shaders and resources will be used with the draw command.
In a ray tracing pipeline, the scene geometry is organized in an acceleration structure. When tracing a ray, you don’t know, in advance, which geometry it’s going to intersect. Each geometry may need a particular set of resources and even the shader programs may need to change with each geometry or geometry type.
For this reason, ray tracing APIs need you to create a Shader Binding Table or SBT for short. SBTs represent (potentially) large arrays of shaders organized in shader groups, where each shader group has a handle that sits in a particular position in the array. The implementation will access this table, for example, when the ray hits a particular piece of geometry. The index it will use to access this table or array will depend on several parameters. Some of them come from the ray tracing command call in a ray generation shader, and others come from the index of the geometry and instance data in the acceleration structure.
There’s a formula to calculate that index and, while it’s not very complex, it will determine the way you must organize your shader binding table so it matches your acceleration structure, which can be a bit of a headache if you’re new to the process.
I highly recommend to take a look at Will Usher’s Shader Binding Table Tutorial, which includes an interactive SBT builder tool that will let you get an idea of how things work and fit together.
The Shader Binding Table is complemented in Vulkan by a Shader Record Buffer. The concept is that entries in the Shader Binding Table don’t have a fixed size that merely corresponds to the size of a shader group handle identifying what to run when the ray hits that particular piece of geometry. Instead, each table entry can be a bit larger and you can put arbitrary data after each handle. That data block is called the Shader Record Buffer, and can be accessed from shader programs when they run. They may be used, for example, to store indices to resources and other data needed to draw that particular piece of geometry, so the shaders themselves don’t have to be completely unique per geometry and can be reused more easily.
As you can see, ray tracing can be more complex than usual but it’s a very powerful tool. I hope the basic explanations and resources I linked above help you get to know it better. Happy hacking!

RIP weird glxgears 2018-2021.
The Meson Build System provides support for running on Microsoft Windows, including support for Microsoft Visual Studio C++. GitHub Actions provides public access to CI machines running Microsoft Windows. But trying to tie both together is not as straightforward as it sounds.
Sometimes you stumble over a task you never thought you have to deal with. This story is about one of those times. In particular, I was faced with running CI tests for a simple C library on Microsoft Visual Studio C++ (MSVC). Gladly, GitHub already provides simple access to machines running Microsoft Windows Server 2016 and 2019, so this sounded like a straightforward task. Unfortunately, my infinite ignorance of anything Windows made this harder than it should have been.
The root of this problem is that the Meson Build System needs to run in the MSVC Developer Shell. This shell has all the necessary environment variables prepared for a particular install of MSVC. Since you can have multiple versions installed in parallel, Meson cannot know which install to use if run outside of such a shell. Unfortunately, GitHub Actions has no simple way to enter this shell. Therefore, running Meson on GitHub Actions will end up using GCC rather than MSVC, since this is what it detects by default in the GitHub Actions Environment. This is not what we wanted, so adjustments are needed.
Luckily, Microsoft provides a tool called
vswhere
which finds MSVC installs on a Windows system. We can use this to find the
required setup scripts and then import the environment variables into our
GitHub Actions setup. This tool is pre-deployed on GitHub Actions, so we can
simply invoke it to find a suitable MSVC install. From there on, we look for
DevShell.dll, which provides the required integration. We load it into
PowerShell and invoke the provided Enter-VsDevShell function. By comparing
our own environment variables before and after that call, we can extract the
changes and export them into the GitHub Actions environment. Thus,
the following workflow-steps will have access to those variables as well.
I plugged this into a re-usable GitHub Action using the new composite type. To use it in a GitHub Actions workflow, simply use:
- name: Prepare MSVC
  uses: bus1/cabuild/action/msdevshell@v1
  with:
    architecture: x64
This queries the MSVC environment and exports it to your GitHub Actions job. Following steps will thus run as if in an MSVC Developer Shell. A full example is appended at the bottom, which shows how to get Meson to compile and test a project on MSVC for both Windows Server 2016 and 2019.
If you rather import the code into your own project, you can find it on GitHub. Note that this uses PowerShell syntax, so it might look alien to linux developers.
While this is only roughly 50 lines of PowerShell scripting, it still feels a bit too hacky. The Meson developers are aware of this, but so far no patches have found their way upstream. Lets hope that this workaround will one day be obsolete and Meson invokes vswhere itself.
Following a full example workflow:
name: Continuous Integration

on: [push, pull_request]

jobs:
  ci-msvc:
    name: CI with MSVC
    runs-on: $
    strategy:
      matrix:
        os: [windows-2016, windows-latest]

    steps:
    - name: Fetch Sources
      uses: actions/checkout@v2
    - name: Setup Python
      uses: actions/setup-python@v2
      with:
        python-version: '3.x'
    - name: Install Python Dependencies
      run: pip install meson ninja
    - name: Prepare MSVC
      uses: bus1/cabuild/action/msdevshell@v1
      with:
        architecture: x64
    - name: Prepare Build
      run: meson setup build
    - name: Run Build
      run: meson compile -v -C build
    - name: Run Test Suite
      run: meson test -v -C build
Running games and benchmarks is much more exciting than trying to fix a handful of remaining synthetic tests. Turnip, which is an open-source Vulkan driver for recent Adreno GPUs, should already be capable of running real world applications, and they always have a way to break the driver in a new, unexpected ways.
The benchmark greeted me with this wonderful field which looked a little blocky:

It’s not a crash, it’s not a hang, there is something wrong either with textures or with a shader. So, let’s take a closer look at a frame. Here is the first major draw call which looks wrong:

Now, let’s take a look at textures used by the draw:
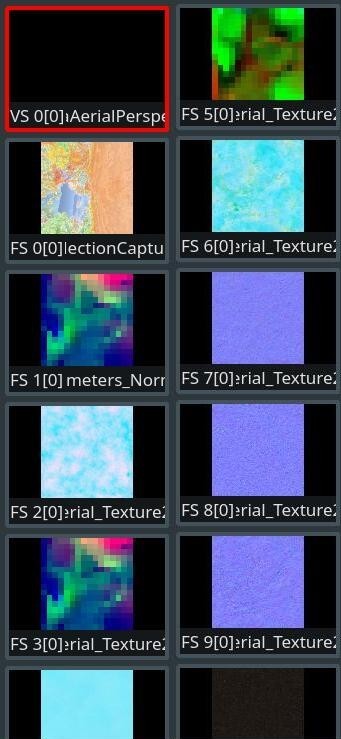
That’s a lot of textures! But all of them look fine; yes, there are some textures that look blocky, but these textures are just small, so nothing wrong here.
The next stop is the fragment shader, I recently implemented an extension which helps with that. VK_KHR_pipeline_executable_properties allows the reporting of additional information about shaders in a pipeline. In case of Turnip it is statistics about registers and assembly of the shader:
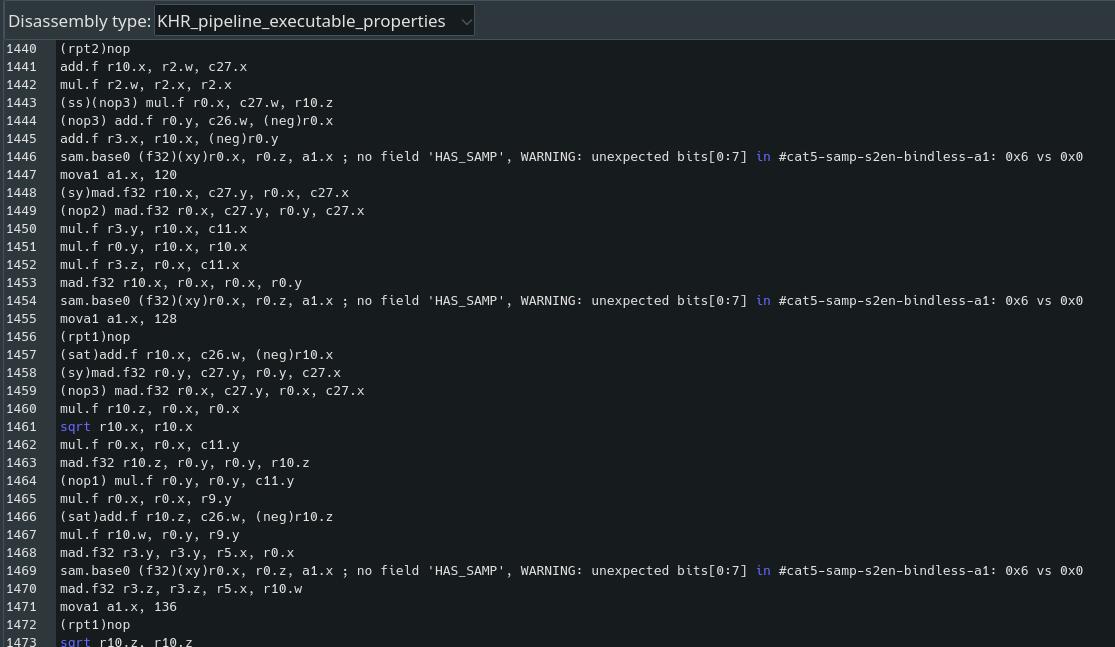 Excerpt from the problematic shader
sam.base0 (f32)(xy)r0.x, r0.z, a1.x ; no field 'HAS_SAMP', WARNING: unexpected bits[0:7] in #cat5-samp-s2en-bindless-a1: 0x6 vs 0x0
Bingo! Usually when the issue is in a shader I have to either make educated guesses and/or reduce the shader until the issue is apparent. However, here we can immediately spot instructions with a warning. It may not be the cause of earth mis-rendering, but these instructions do sampling from textures, soooo.
After fixing their encoding, which was caused by a mistake in the XML definition, the ground is now rendered correctly:
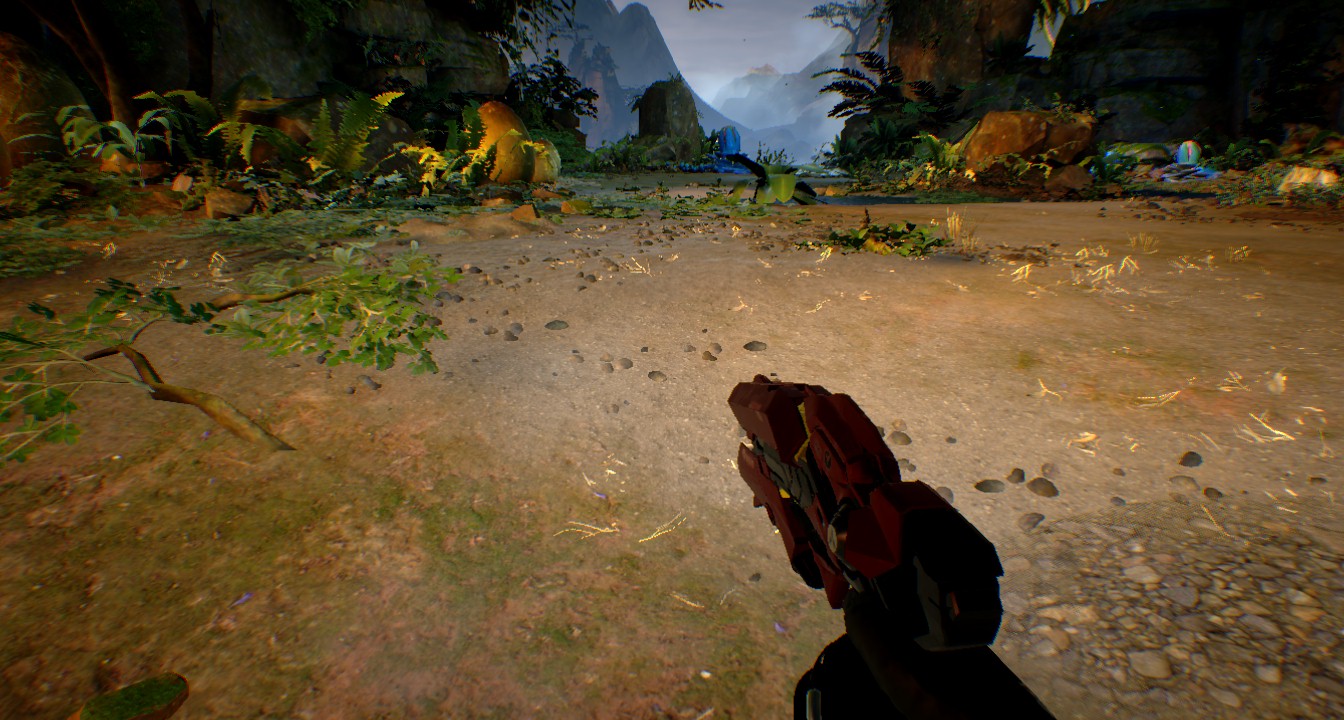
After looking a bit more at the frame I saw that the same issue plagued all rock formations, and now it is gone too. The final fix could be seen at
ir3/isa,parser: fix encoding and parsing of bindless s2en SAM (!9628)
Now it’s time for a more heavyweight opponent - Genshin Impact, one of the most popular mobile games at the moment. Genshin Impact supports both GLES and Vulkan, and defaults to GLES on all but several devices. In any case, Vulkan could be enabled by editing a config file.
There are several mis-renderings in the game, however here I would describe the one which shows why it is important to use all available validation tooling for such complex API as Vulkan. Other mis-renderings would be a matter for the second post.
Proceeding to the gameplay and running around for a bit revealed a major artifacts on the water surface:
This one was a multiframe effect so I had to capture a trace of all frames and then find the one where issue began. The draw call I found:

It adds water to the first framebuffer and a lot of artifacts to the second one. Looking at the framebuffer configuration - I could see that the fragment shader doesn’t write to the second framebuffer. Is it allowed? Yes. Is the behavior defined? No! VK_LAYER_KHRONOS_validation warns us about it, if warnings are enabled:
UNASSIGNED-CoreValidation-Shader-InputNotProduced(WARN / SPEC): Validation Warning:
Attachment 1 not written by fragment shader; undefined values will be written to attachment
“undefined values will be written to attachment” may mean that nothing is written into it, like expected by the game, or that random values are written to the second attachment, like Turnip does. Such behavior should not be relied upon, so Turnip does not contradict the specification here and there is nothing to fix. Case closed.
More mis-renderings and investigations to come in the next post(s).
Last year I worked on implementing in Turnip the support for a HW feature present in Qualcomm Adreno GPUs: the low-resolution Z buffer (aka LRZ). This is a HW feature already supported in Freedreno, which is the open-source OpenGL driver for these GPUs.
Low-resolution Z buffer is very similar to a depth prepass that helps the HW avoid executing the fragment shader on those fragments that will be subsequently discarded by the depth test afterwards (Hidden surface removal). This feature comes with some limitations though, such as the fragment shader not being allowed to have side effects (writing to SSBOs, atomic operations, etc) among others.
The interesting part of this feature is that it allows the applications to submit the vertices in any order (saving CPU time that was otherwise used on ordering them) and the HW will process them in the binning pass as explained below, detecting which ones are occluded and giving an increase in performance in some specific use cases due to this.

To understand better how LRZ works, we need to talk a bit about tiled-based rendering. This is a way of rendering based on subdividing the framebuffer in tiles and rendering each tile separately. The advantage of this design is that the amount of memory and bandwidth is reduced compared to immediate mode rendering systems that draw the entire frame at once. Tile-based rendering is very popular on embedded GPUs, including Qualcomm Adreno.
Entering into more details, the graphics pipeline is divided into three different passes executed per tile of the frame.
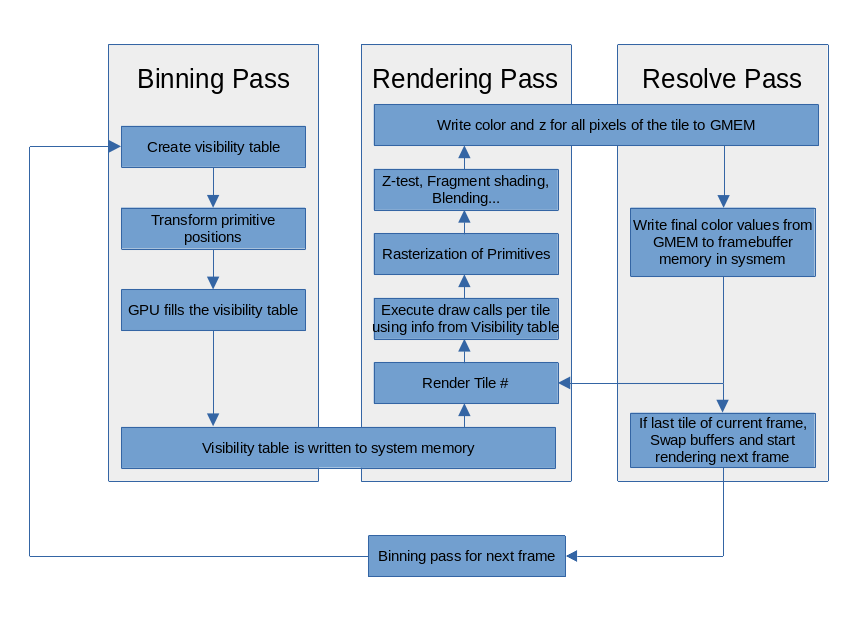 |
|---|
| Tiled-rendering architecture diagram. |
The binning pass. This pass processes the geometry of the scene and records in a table on which tiles a primitive will be rendered. By doing this, the HW only needs to render the primitives that affect a specific tile when is processed.
The rendering pass. This pass gets the rasterized primitives and executes all the fragment related processes of the pipeline (fragment shader execution, depth pass, stencil pass, blending, etc). Once it finishes, the resolve pass starts.
The resolve pass. It first resolves the tile buffer (GMEM) if it is multisample, and copy the final color and depth values for all tile pixels back to system memory. If it is the last tile of the framebuffer, it swap buffers and start the binning pass for next frame.
Where is LRZ used then? Well, in both binning and rendering passes. In the binning pass, it is possible to store the depth value of each vertex of the geometries of the scene in a buffer as the HW has that data available. That is the depth buffer used internally for LRZ. It has lower resolution as too much detail is not needed, which helps to save bandwidth while transferring its contents to system memory.
Thanks to LRZ, the rendering pass is only executed on the fragments that are going to be visible at the end. However, there are some limitations as mentioned before: if a fragment shader has collateral effects, such as writing SSBO, atomics, etc; or if blending is enabled, or if the fragment shader could modify the fragment’s depth… then LRZ cannot be used as the results may be wrong.
However, LRZ brings a couple of things on the table that makes it interesting. One is that applications don’t need to reorder their primitives before submission to be more efficient, that is done by the HW with LRZ automatically. Another one is performance improvements in some use cases. For example, imagine a fragment shader discards parts of fragments but it doesn’t have any other collateral effect otherwise. In that case, although we cannot do early depth testing, we can do early LRZ as we know that some fragments won’t pass a depth test even if they are not discarded by the fragment shader.
Talking about the LRZ implementation, I took Freedreno’s code as a starting point to implement LRZ on Turnip. After some months of work, it finally landed in Mesa master.
Last week, more patches related to LRZ landed in Mesa master: the ones fixing LRZ interactions with VK_EXT_extended_dynamic_state, as with this extension the application can change some states in command buffer time that could affect LRZ state and, therefore, we need to track them accordingly.
I also implemented some LRZ improvements that are currently under review also landed (thanks Eric Anholt!), such as the support to do early-LRZ-late-depth test that I mentioned before, which could bring a performance improvement in some applications.
 |
|---|
| Left: original vulkan tutorial demo implementation. Right: same demo modified to discard fragments with red component lower than 0.5f. |
For instance, I did some measurements in a vulkan-tutorial.com implementation of my own that I modified to discard a significant amount of fragments (see previous figure). This is one of the cases that early-LRZ-late-depth test helps to improve performance.
When running the modified demo with these patches, I found a performance improvement between 13-16%.
All this LRZ work was my first big contribution to this open-source reverse engineered driver! I don’t want to finish this post without thanking publicly Rob Clark for the original Freedreno implementation and his reviews of my work, as well as Jonathan Marek and Connor Abbott for their insightful reviews, advice and tips to make it working. Edited: Many thanks to Eric Anholt for his reviews in the last two patch series!
Happy hacking!
For the fun of it I decided to run some real apps on lavapipe.
Talos Principle is still rando crashing on startup, occasionally whatever magic value ends up being right in uninit memory and it suddenly runs fine.
I started Rise of the Tomb Raider, and it renders really slowly up to the menu.
Then I gave DOOM 2016 with the Vulkan renderer a go, and with a few lavapipe hacks to enable some feature bits, I managed to get it to load a game image. It's taking 5-6s per frame to render. However most of the slowness in the frame is the BPTC texture loading which is a path that I've done no tuning for so it definitely running very slowly. I think RoTR is also hitting that slow path so I guess I've some incentive to look at cleaning it up.

 Shaded cube rendered on an Apple M1
After a few weeks of investigating the Apple M1 GPU in January, I was able to draw a triangle with my own open source code. Although I began dissecting the instruction set, the shaders there were specified as machine code. A real graphics driver needs a compiler from high-level shading languages (GLSL or Metal) to a native binary. Our understanding of the M1 GPU’s instruction set has advanced over the past few months. Last week, I began writing a free and open source shader compiler targeting the Apple GPU. Progress has been rapid: at the end of its first week, it can compile both basic vertex and fragment shaders, sufficient to render 3D scenes. The spinning cube pictured above has its shaders written in idiomatic GLSL, compiled with the nascent free software compiler, and rendered with native code like the first triangle in January. No proprietary blobs here!
Over the past few months, Dougall Johnson has investigated the instruction set in-depth, building on my initial work. His findings on the architecture are outstanding, focusing on compute kernels to complement my focus on graphics. Armed with his notes and my command stream tooling, I could chip away at a compiler.
The compiler’s design must fit into the development context. Asahi Linux aims to run a Linux desktop on Apple Silicon, so our driver should follow Linux’s best practices like upstream development. That includes using the New Intermediate Representation (NIR) in Mesa, the home for open source graphics drivers. NIR is a lightweight library for shader compilers, with a GLSL frontend and backend targets including Intel and AMD. NIR is an alternative to LLVM, the compiler framework used by Apple. Just because Apple prefers LLVM doesn’t mean we have to. A team at Valve famously rewrote AMD’s LLVM backend as a NIR compiler, improving performance. If it’s good enough for Valve, it’s good enough for me.
Supporting NIR as input does not dictate our compiler’s own intermediate representation, which reflects the hardware’s design. The instruction set of AGX2 (Apple’s GPU) has:
Each hardware property induces a compiler property:
Putting it together, a design for an AGX compiler emerges: a code generator translating NIR to an SSA-based intermediate representation, optimized by instruction combining passes, scheduled to minimize register pressure, register allocated while going out of SSA, scheduled again to maximize instruction-level parallelism, and finally packed to binary instructions.
These decisions reflect the hardware traits visible to software, which are themselves “shadows” cast by the hardware design. Investigating these traits offers insight into the hardware itself. Consider the register file. While every thread can access up to 256 half-word registers, there is a performance penalty: the more registers used, the fewer concurrent threads possible, since threads share a register file. The number of threads allowed in a given shader is reported in Metal as the maxTotalThreadsPerThreadgroup property. So, we can study the register pressure versus occupancy trade-off by varying the register pressure of Metal shaders (confirmed via our disassembler) and correlating with the value of maxTotalThreadsPerThreadgroup:
| Registers | Threads |
|---|---|
| <= 104 | 1024 |
| 112 | 896 |
| 120, 128 | 832 |
| 136 | 768 |
| 144 | 704 |
| 152, 160 | 640 |
| 168-184 | 576 |
| 192-208 | 512 |
| 216-232 | 448 |
| 240-256 | 384 |
From the table, it’s clear that up until a threshold, it doesn’t matter how many registers the program uses; occupancy is unaffected. Most well-written shaders fall in this bracket and need not worry. After hitting the threshold, other GPUs might spill registers to memory, but Apple doesn’t need to spill until more than 256 registers are required. Between 112 and 256 registers, the number of threads decreases in an almost linear fashion, in increments of 64 threads. Carefully considering rounding, it’s easy to recover the formula Metal uses to map register usage to thread count.
What’s less obvious is that we can infer the size of the machine’s register file. On one hand, if 256 registers are used, the machine can still support 384 threads, so the register file must be at least 256 half-words * 2 bytes per half-word * 384 threads = 192 KiB large. Likewise, to support 1024 threads at 104 registers requires at least 104 * 2 * 1024 = 208 KiB. If the file were any bigger, we would expect more threads to be possible at higher pressure, so we guess each threadgroup has exactly 208 KiB in its register file.
The story does not end there. From Apple’s public specifications, the M1 GPU supports 24576 = 1024 * 24 simultaneous threads. Since the table shows a maximum of 1024 threads per threadgroup, we infer 24 threadgroups may execute in parallel across the chip, each with its own register file. Putting it together, the GPU has 208 KiB * 24 = 4.875 MiB of register file! This size puts it in league with desktop GPUs.
For all the visible hardware features, it’s equally important to consider what hardware features are absent. Intriguingly, the GPU lacks some fixed-function graphics hardware ubiquitous among competitors. For example, I have not encountered hardware for reading vertex attributes or uniform buffer objects. The OpenGL and Vulkan specifications assume dedicated hardware for each, so what’s the catch?
Simply put – Apple doesn’t need to care about Vulkan or OpenGL performance. Their only properly supported API is their own Metal, which they may shape to fit the hardware rather than contorting the hardware to match the API. Indeed, Metal de-emphasizes vertex attributes and uniform buffers, favouring general constant buffers, a compute-focused design. The compiler is responsible for translating the fixed-function attribute and uniform state to shader code. In theory, this has a slight runtime cost; conventional wisdom says dedicated hardware is faster and lower power than software emulation. In practice, the code is so simple it may make no difference, although application developers should be mindful of the vertex formats used in case conversion code is inserted. As always, there is a trade-off: omitting features allows Apple to squeeze more arithmetic logic units (or register file!) onto the chip, speeding up everything else.
The more significant concern is the increased time on the CPU spent compiling shaders. If changing fixed-function attribute state can affect the shader, the compiler could be invoked at inopportune times during random OpenGL calls. Here, Apple has another trick: Metal requires the layout of vertex attributes to be specified when the pipeline is created, allowing the compiler to specialize formats at no additional cost. The OpenGL driver pays the price of the design decision; Metal is exempt from shader recompile tax.
The silver lining is that there is nothing to reverse-engineer for “missing” features like attributes and uniform buffers. As long as we know how to access memory in compute kernels, we can write the lowering code ourselves with no hardware mysteries. So far, I’ve implemented enough to spin a cube.
At present, the in-progress compiler supports most arithmetic and input/output instructions found in OpenGL ES 2.0, with a simple optimizer and native instruction packing. Support for control flow, textures, scheduling, and register allocation will come further down the line as we work towards a real driver.
Given that the new RDNA2 GPUs provide some support for hardware accelerated raytracing and there is even a new shiny Vulkan extension for it, it may not be a surprise that we’re working on implementing raytracing support in RADV.
Already some time ago I wrote documentation for the hardware raytracing support. As these GPUs contain quite minimal hardware to implement things there is a large software and shader side to implementing this.
And that is what I’ve been up to for the last couple of weeks. And I now have achieved my first personal milestones for the implementation:

This involves writing initial versions for a lot of the software infrastructure needed, so really shows that the basis is getting there.
At the same time we’re quite a ways off from really testing using CTS or running our first real demos. In particular we are missing things like
and much more, in addition to some of these initial implementations likely not really being performant.
I’m typing this up between loads and runs of various games I’m testing, since bug reports for games are somehow already a thing, and there’s a lot of them.
The worst part about testing games is the unbelievably long load times (and startup videos) most of them have, not to mention those long, panning camera shots at the start of the game before gameplay begins and I can start crashing.
But this isn’t a post about games.
No, no, there’s plenty of time for such things.
This is a combo post: part roundup because blogging has been sporadic the past couple weeks, and part feature.
The big Mesa 21.1 branchpoint happened yesterday, and I’m pretty pleased with the state of zink in this upcoming release.
Things you should expect to see:
Things you should not expect to see:
And here’s the zink-wip roundup from the past however long since I did the last one:
Yeah, I’m talking to you.
I fixed a ton of bugs. Like, actually a ton. Tomb Raider went from an all-you-can-crash buffet to…well, I’ll leave it as a fun surprise for anyone feeling especially intrepid, but it’s definitely playable. So are things that use queries. Don’t ask.
There’s totally some other stuff, but I’m too fried to remember it.
Everything up there was just fluff, but this is where the post gets real.
Zink supports formats with alpha-to-one, e.g., RGBX, BGRX, and even (on zink-wip, very illegal) XRGB and XBGR. This is handy for 24bit visuals, such as (probably) all your windows in Xorg. But the method by which these formats are supported comes with its own issues, part of which I’d fixed some time ago in my quest to reduce GPU overhead, and the other part I discovered more recently.
In zink, an alpha-to-one format is just the equivalent format with alpha. So RGBX is just RGBA. This is due to Vulkan not having format equivalents for these types; when sampling from them, a swizzle is applied to force the alpha channel to the maximum value, which yields the correct result.
But what happens when an RGBX framebuffer attachment is used in a blending operation?
Let’s look at VK_BLEND_OP_ADD as a very simple example. The spec defines this operation as:
As0 × Sa + Ad × Da
That’s alpha-of-src times src-alpha-blend-factor plus alpha-of-dest times dest-alpha-blend-factor yielding the resulting pixel color that gets written to the attachment.
But what if the dest value is expected to always one, and the actual buffer is always zero because its alpha channel is never written?
Such is the case with RGBX and the like, and so more steps are required here for full emulation.
Here’s how I went about solving the issue.
First, framebuffer attachments have to be monitored when they’re updated, and any time an alpha-to-one attachment is bound, I set a bitflag for it in the pipeline state. This then triggers a pipeline update for the blend state at the time of draw, where I apply clamping to the appropriate blend factors like so:
if (state->zero_alpha_attachments) {
   for (unsigned i = 0; i < state->num_attachments; i++) {
      blend_att[i] = state->blend_state->attachments[i];
      if (state->zero_alpha_attachments & BITFIELD_BIT(i)) {
         blend_att[i].dstAlphaBlendFactor = VK_BLEND_FACTOR_ZERO;
         blend_att[i].srcColorBlendFactor = clamp_zero_blend_factor(blend_att[i].srcColorBlendFactor);
         blend_att[i].dstColorBlendFactor = clamp_zero_blend_factor(blend_att[i].dstColorBlendFactor);
      }
   }
   blend_state.pAttachments = blend_att;
} else
   blend_state.pAttachments = state->blend_state->attachments;
For any of the attachments in the bitfield, three clamps are performed:
dstAlphaBlendFactor is clamped to zero, because there will never be any contribution from the dest component of alpha blendingsrcColorBlendFactor and dstColorBlendFactor are both clamped using the following check:if (f == VK_BLEND_FACTOR_ONE_MINUS_DST_ALPHA)
return VK_BLEND_FACTOR_ZERO;
if (f == VK_BLEND_FACTOR_DST_ALPHA)
return VK_BLEND_FACTOR_ONE;
return f;
Thus, alpha blending is a passthrough operation from the src component, and for color blending, the dest component is always one or zero. This yields correct results in piglit’s spec@arb_texture_float@fbo-blending-formats test, and also potentially enables the hardware to employ some optimizations to reduce the burden of blending.
Exciting.
With dbus-broker we have introduced the resource-accounting of bus1 into the D-Bus world. We believe it greatly improves and strengthens the resource distribution of the D-Bus messages bus, and we have already found a handful of resource leaks that way. However, it can be a daunting task to solve resource exhaustion bugs, so I decided to describe the steps we took to resolve a recent resource-leak in the openQA package.
A few days ago, Adam Williamson approached me 1 with a bug in the openQA package, where he saw the log stream filled with messages like:
dbus-broker[<pid>]: Peer :1.<id> is being disconnected as it does not have the resources to receive a reply or unicast signal it expects.
dbus-broker[<pid>]: UID <uid> exceeded its 'bytes' quota on UID <uid>.
This is the typical sign of a resource exhaustion in dbus-broker. When the message broker generates or forwards messages to an individual client, it will queue them as outgoing-messages and push them into the unix-socket of the client. If this client does not dequeue messages, this queue might fill up. If a limit is reached, something needs to be done. Since D-Bus is not a lossy protocol, dropping messages is not an option. Instead, the message broker will either refuse new incoming operations or disconnect a client. All resources are accounted on UIDs, this means multiple clients of the same user will share the same resource limits.
Depending on what message is sent, it is accounted either on the receiver or sender. Furthermore, some messages can be refused by the broker, others cannot. The exact rules are described in the wiki 2.
In the case of openQA, the first step was to query the accounting information of the running message broker:
sudo dbus-send --system --dest=org.freedesktop.DBus --type=method_call --print-reply /org/freedesktop/DBus org.freedesktop.DBus.Debug.Stats.GetStats
(Replace --system with --session to query the session or user bus.)
While preferably this query is performed when the resource exhaustion happens, it will often yield useful information under normal operation as well. Resources are often consumed slowly, so the accumulation will still show up.
The output 3 of this query shows a list of all D-Bus clients with their
accounting information. Furthermore, it lists all UIDs that have clients
connected to this message bus, again with all accounting information. The
challenge is to find suspicious entries in this huge data dump. The most
promising solution so far was to search for "OutgoingBytes" and check for
big numbers. This shows the number of bytes queued in the message broker for
a particular client. It is usually 0, since the kernel queues are big enough
to hold most normal messages. Even if it is not 0, it is usually just a couple
of KiB.
In this case, we checked for "OutgoingBytes", and found:
dict entry(
    string "OutgoingBytes"
    uint32 62173024
)
62 MiB of messages are waiting to be delivered to that client. Expanding the logs to show the surrounding block, we see:
struct {
    string ":1.211366"
    array [
        dict entry(
            string "UnixUserID"
            variant                            uint32 991
        )
        dict entry(
            string "ProcessID"
            variant                            uint32 674968
        )
        [...]
    ]

    array [
        [...]
        dict entry(
            string "Matches"
            uint32 1
        )
        [...]
        dict entry(
            string "OutgoingBytes"
            uint32 62173024
        )
        [...]
    ]
}
This tells us the PID 674968 of user 991 has roughly 62 MiB of data queued,
and it is likely not dequeuing the data. Furthermore, we see it has 1 message
filter (D-Bus match rule) installed. D-Bus message filters will cause matching
D-Bus signals to be delivered to a client. So a likely problem is that this
client keeps receiving signals, but does not dispatch its client socket.
We digged further, and the data dump includes more such clients. Matching back
the PIDs to processes via ps auxf, we found that each and every of those
suspicious entries was /usr/bin/isotovideo: backend. The code of this process
is part of the os-autoinst repository, in this case qemu.pm. A quick look
showed only a single use of D-Bus 4. At a first glance, this looks alright.
It creates a system-bus connection via the Net::DBus perl module, dispatches
a method-call, and returns the result. However, we know this process has a
match-rule installed (assuming the dbus-broker logs are correct), so we checked
further and found that the Net::DBus module always installs a match-rule on
NameOwnerChanged. Furthermore, it caches the system-bus connection in a
global variable, sharing it across users in the same code-base.
Long story short, the os-autoinst qemu module created a D-Bus connection
which was idle in the background and never dispatched by any code. However, the
connection has a match-rule installed, and the message broker kept sending
matching signals to that connection. This data accumulated and eventually
exceeded the resource quota of that client. A workaround was quickly provided,
and it will hopefully resolve this problem 5.
Hopefully, this short recap will be helpful to debug other similar situations. You are always welcome to message us on bus1-devel@googlegroups or on the dbus-broker GitHub issue tracker if you need help.
In RADV we just added an option to speed up rendering by rendering less pixels.
These kinds of techniques have become more common over the past decade with techniques such as checkerboarding, TAA based upscaling and recently DLSS. Fundamentally all they do is trading off rendering quality for rendering cost and many of them include some amount of postprocessing to try to change the curve of that tradeoff. Most notably DLSS has been wildly successful at that to the point many people claim it is barely a quality regression.
Of course increasing GPU performance by up to 50% or so with barely any quality regression seems like must have and I think it would be pretty cool if we could have the same improvements on Linux. I think it has the potential to be a game changer, making games playable on APUs or playing with really high resolution or framerates on desktops.
And today we took our first baby steps in RADV by allowing users to force Variable Rate Shading (VRS) with an experimental environment variable:
RADV_FORCE_VRS=2x2
VRS is a hardware capability that allows us to reduce the number of fragment shader invocations per pixel rendered. So you could say configure the hardware to use one fragment shader invocation per 2x2 pixels. The hardware still renders the edges of geometry exactly, but the inner area of each triangle is rendered with a reduced number of fragment shader invocations.
There are a couple of ways this capability can be configured:
This is a new feature for AMD on RDNA2 hardware.
With RADV_FORCE_VRS we use this to improve performance at the cost of visual quality. Since we did not implement any postprocessing the quality loss can be pretty bad, so we restricted the reduce shading rate when we detect one of the following
As a result there are some games where this has barely any effect but you also don’t notice the quality regression and there are games where it really improves performance by 30%+ but you really notice the quality regression.
VRS is by far the easiest thing to make work in almost all games. Most alternatives like checkerboarding, TAA and DLSS need modified render target size, significant shader fixups, or even a proprietary integration with games. Making changes that deeply is getting more complicated the more advanced the game is.
If we want to reduce render resolution (which would be a key thing in e.g. checkerboarding or DLSS) it is very hard to confidently tie all resolution dependent things together. For example a big cost for some modern games is raytracing, but the information flow to the main render targets can be very hard to track automatically and hence such a thing would require a lot of investigation or a bunch of per game customizations.
And hence we decided to introduce this first baby step. Enjoy!
The lavapipe vulkan software rasterizer in Mesa is now reporting Vulkan 1.1 support.
It passes all CTS tests for those new features in 1.1 but it stills fails all the same 1.0 tests so isn't that close to conformant. (lines/point rendering are the main areas of issue).
There are also a bunch of the 1.2 features implemented so that might not be too far away though 16-bit shader ops and depth resolve are looking a bit tricky.
If there are any specific features anyone wants to see or any crazy places/ideas for using lavapipe out there, please either file a gitlab issue or hit me up on twitter @DaveAirlie
The great thing about tomorrow is that it never comes.
Let’s talk about sparse buffers.
What is a sparse buffer? A sparse buffer is a buffer that is not required to be contiguously or fully backed. This means that a buffer larger than the GPU’s available memory can be created, and only some parts of it are utilized at any given time. Because of the non-resident nature of the backing memory, they can never be mapped, instead needing to go through a staging buffer for any host read/write.
In a gallium-based driver, provided that an effective implementation for staging buffers exists, sparse buffer implementation goes almost exclusively through the pipe_context::resource_commit hook, which manages residency of a sparse resource’s backing memory, passing a range to change residency for and an on/off switch.
In zink(-wip), the hook looks like this:
static bool
zink_resource_commit(struct pipe_context *pctx, struct pipe_resource *pres, unsigned level, struct pipe_box *box, bool commit)
{
   struct zink_context *ctx = zink_context(pctx);
   struct zink_resource *res = zink_resource(pres);
   struct zink_screen *screen = zink_screen(pctx->screen);

   /* if any current usage exists, flush the queue */
   if (zink_batch_usage_matches(&res->obj->reads, ctx->curr_batch) ||
       zink_batch_usage_matches(&res->obj->writes, ctx->curr_batch))
      zink_flush_queue(ctx);

   VkBindSparseInfo sparse;
   sparse.sType = VK_STRUCTURE_TYPE_BIND_SPARSE_INFO;
   sparse.pNext = NULL;
   sparse.waitSemaphoreCount = 0;
   sparse.bufferBindCount = 1;
   sparse.imageOpaqueBindCount = 0;
   sparse.imageBindCount = 0;
   sparse.signalSemaphoreCount = 0;

   VkSparseBufferMemoryBindInfo sparse_bind;
   sparse_bind.buffer = res->obj->buffer;
   sparse_bind.bindCount = 1;
   sparse.pBufferBinds = &sparse_bind;

   VkSparseMemoryBind mem_bind;
   mem_bind.resourceOffset = box->x;
   mem_bind.size = box->width;
   mem_bind.memory = commit ? res->obj->mem : VK_NULL_HANDLE;
   mem_bind.memoryOffset = box->x;
   mem_bind.flags = 0;
   sparse_bind.pBinds = &mem_bind;
   VkQueue queue = util_queue_is_initialized(&ctx->batch.flush_queue) ? ctx->batch.thread_queue : ctx->batch.queue;

   VkResult ret = vkQueueBindSparse(queue, 1, &sparse, VK_NULL_HANDLE);
   if (!zink_screen_handle_vkresult(screen, ret)) {
      check_device_lost(ctx);
      return false;
   }
   return true;
}
Naturally there’s a need to enjoy the verbosity of Vulkan structs here, but there’s two key takeaways.
The first is that this implementation is likely suboptimal; it should be making better use of semaphores to avoid having to flush the queue if the resource has current-batch usage. That’s complex to implement, however, so I took the same shortcut that RadeonSI does here.
The second is that this is just copying the pipe_box struct to the VkSparseMemoryBind struct. The reason this works with a 1:1 mapping is because the backing resource is allocated with a 1:1 range mapping, so the values can be directly used.
Other than that, the only changes required for this implementation were to add a bunch of checks for the sparse flag on resources during map/unmap to force staging buffers and to use device-local memory instead of host-visible.
Sometimes zink can be simple!
The crocus project was recently mentioned in a phoronix article. The article covered most of the background for the project.
Crocus is a gallium driver to cover the gen4-gen7 families of Intel GPUs. The basic GPU list is 965, GM45, Ironlake, Sandybridge, Ivybridge and Haswell, with some variants thrown in. This hardware currently uses the Intel classic 965 driver. This is hardware is all gallium capable and since we'd like to put the classic drivers out to pasture, and remove support for the old infrastructure, it would be nice to have these generations supported by a modern gallium driver.
The project was initiated by Ilia Mirkin last year, and I've expended some time in small bursts to moving it forward. There have been some other small contributions from the community. The basis of the project is a fork of the iris driver with the old relocation based batchbuffer and state management added back in. I started my focus mostly on the older gen4/5 hardware since it was simpler and only supported GL 2.1 in the current drivers. I've tried to cleanup support for Ivybridge along the way.
The current status of the driver is in my crocus branch.
Ironlake is the best supported, it runs openarena and supertuxkart, and piglit has only around 100 tests delta vs i965 (mostly edgeflag related) and there is only one missing feature (vertex shader push constants).
Ivybridge just stop hanging on second batch submission now, and glxgears runs on it. Openarena starts to the menu but is misrendering and a piglit run completes with some gpu hangs and a quite large delta. I expect IVB to move faster now that I've solved the worst hang.
Haswell runs glxgears as well.
I think once I take a closer look at Ivybridge/Haswell and can get Ilia (or anyone else) to do some rudimentary testing on Sandybridge, I will start taking a closer look at upstreaming it into Mesa proper.
After last week’s post touting the “final” features being added to the upcoming Mesa release, naturally now that this is a new week, I have to outdo myself.
I’ve heard some speculation about zink’s future regarding features. Specifically regarding all the mesamatrix features that aren’t green-ified for zink yet.
So you want features is what you’re saying.
Let’s see where things stand in today’s zink-wip snapshot:
By my calculations, that’s 11 TODO, 10 not supported, 2 advanced blend, and 1 final boss, a total of 24 out-of-version-extensions not yet implemented out of 54, meaning that 30 are done, tying with i965 and second only to RadeonSI at 33.
New in today’s snapshot: GL_ARB_fragment_shader_interlock, GL_ARB_sparse_buffer, GL_ARB_sample_locations, GL_ARB_shader_ballot, GL_ARB_shader_clock, GL_ARB_texture_filter_minmax
Writing blog posts like this is easy, but you know what’s not easy?
Writing good blog posts.
And new to the blogging game is the one, the only, Bas Nieuwenhuizen of RADV founding fame! If you’re at all curious about how drivers actually work, his is definitely a site to follow, as he’s already gone much deeper into explaining my RPCS3 memcpy fail than I ever did.
Is sparse buffer implementation 101. I’ve said it, so now the blog post has to happen.
In this article I show how reading from VRAM can be a catastrophe for game performance and why.
To illustrate I will go back to fall 2015. AMDGPU was just released, it didn’t even have re-clocking yet and I was just a young student trying to play Skyrim on my new AMD R9 285.
Except it ran slowly. 10-15 FPS slowly. Now one might think that is no surprise as due to lack of re-clocking the GPU ran with a shader clock of 300 MHz. However the real surprise was that the game was not at all GPU bound.
As usual with games of that era there was a single thread doing a lot of the work and that thread was very busy doing something inside the game binary. After a bunch of digging with profilers and gdb, it turned out that the majority of time was spent in a single function that accessed less than 1 MiB from a GPU buffer each frame.
At the time DXVK was not a thing yet and I ran the game with wined3d on top of OpenGL. In OpenGL an application does not specify the location of GPU buffers directly, but specifies some properties about how it is going to be used and the driver decides. Poorly in this case.
There was a clear tweak to the driver heuristics that choose the memory location and the frame rate of the game more than doubled and was now properly GPU bound.
After the anecdote above you might be wondering how slow reading from VRAM can really be? 1 MiB is not a lot of data so even if it is slow it cannot be that bad right?
To show you how bad it can be I ran some benchmarks on my system (Threadripper 2990wx, 4 channel DDR4-3200 and a RX 6800 XT). I checked read/write performance using a 16 MiB buffer (512 MiB for system memory to avoid the test being contained in L3 cache)
We look into three allocation types that are exposed by the amdgpu Linux kernel driver:
VRAM. This lives on the GPU and is mapped with Uncacheable Speculative Write Combining (USWC) on the CPU. This means that accesses from the CPU are not cached, but writes can be write-combined.
Cacheable system memory. This is system memory that has caching enabled on the CPU and there is cache snooping to ensure the memory is coherent between the CPU and GPU (up till the top level caches. The GPU caches do not participate in the coherence).
USWC system memory. This is system memory that is mapped with Uncacheable Speculative Write Combining on the CPU. This can lead to slight performance benefits compared to cacheable system memory due to lack of cache snooping.
For context, in Vulkan this would roughly correspond to the following memory types:
| Hardware | Vulkan |
|---|---|
| VRAM | VK_MEMORY_PROPERTY_DEVICE_LOCAL_BIT | VK_MEMORY_PROPERTY_HOST_VISIBLE_BIT | VK_MEMORY_PROPERTY_HOST_COHERENT_BIT |
| Cacheable system memory | VK_MEMORY_PROPERTY_HOST_VISIBLE_BIT | VK_MEMORY_PROPERTY_HOST_COHERENT_BIT | VK_MEMORY_PROPERTY_HOST_CACHED_BIT |
| USWC system memory | VK_MEMORY_PROPERTY_HOST_VISIBLE_BIT | VK_MEMORY_PROPERTY_HOST_COHERENT_BIT |
The benchmark resulted in the following throughput numbers:
| method (MiB/s) | VRAM | Cacheable System Memory | USWC System Memory |
|---|---|---|---|
| read via memcpy | 15 | 11488 | 137 |
| write via memcpy | 10028 | 18249 | 11480 |
I furthermore tested handwritten for-loops accessing 8,16,32 and 64-bit elements at a time and those got similar performance.
This clearly shows that reads from VRAM using memcpy are ~766x slower than memcpy reads from cacheable system memory and even non-cacheable system memory is ~91x slower than cacheable system memory. Reading even small amounts from these can cause severe performance degradations.
Writes show a difference as well, but the difference is not nearly as significant. So if an application does not select the best memory location for their data for CPU access it is still likely to result in a reasonable experience.
Even though APUs do not have VRAM they still are affected by the same issue. Typically the GPU gets a certain amount of memory pre-allocated at boot time as a carveout. There are some differences in how this is accessed from the GPU so from the perspective of the GPU this memory can be faster.
At the same time the Linux kernel only gives uncached access to that region from the CPU, so one could expect similar performance issues to crop up.
I did the same test as above on a laptop with a Ryzen 5 2500U (Raven Ridge) APU, and got results that are are not dissimilar from my workstation.
| method (MiB/s) | Carveout | Snooped System Memory | USWC System Memory |
|---|---|---|---|
| read via memcpy | 108 | 10426 | 108 |
| write via memcpy | 11797 | 20743 | 11821 |
The carveout performance is virtually identical to the uncached system memory now, which is still ~97x slower than cacheable system memory. So even though it is all system memory on an APU care still has to be taken on how the memory is allocated.
Since the performance cliff is so large it is recommended to avoid this issue if at all possible. The following three methods are good ways to avoid the issue:
If the data is only written from the CPU, it is advisable to use a shadow buffer in cacheable system memory (can even be outside of the graphics API, e.g. malloc) and read from that instead.
If this is written by the GPU but not frequently, one could consider putting the buffer in snooped system memory. This makes the GPU traffic go over the PCIE bus though, so it has a trade-off.
Let the GPU copy the data to a buffer in snooped system memory. This is basically an extension of the previous item by making sure that the GPU accesses the data exactly once in system memory. The GPU roundtrip can take a non-trivial wall-time though (up to ~0.5 ms measured on some low end APUs), some of which is size-independent, such as command submission. Additionally this may need to wait till the hardware unit used for the copy is available, which may depend on other GPU work. The SDMA unit (Vulkan transfer queue) is a good option to avoid that.
Another problem with CPU access from VRAM is the BAR size. Typically only the first 256 MiB of VRAM is configured to be accessible from the CPU and for anything else one needs to use DMA.
If the working set of what is allocated in VRAM and accessed from the CPU is large enough the kernel driver may end up moving buffers frequently in the page fault handler. System memory would be an obvious target, but due to the GPU performance trade-off that is not always the decision that gets made.
Luckily, due to the recent push from AMD for Smart Access Memory, large BARs that encompass the entire VRAM are now much more common on consumer platforms.
This is the first post of this blog and with it being past midnight I couldn’t be bothered making one about a technical topic. So instead here is an explanation of my plans with the blog.
I got inspired by the prolific blogging of Mike Blumenkrantz and some discussion on the VKx discord that some actually written updates can be very useful, and that I don’t need to make a paper out of each one.
At the same time I have been involved in some longer running things on the driver side which I think could really use some updates as progress is made. Consider for example raytracing, DRM format modifiers, RGP support and more.
I have no plans at all to be as prolific as Mike by a long shot, but I think the style of articles is probably a good template of what to expect from this blog.
Blogging is tough, but I’m getting the posts out there one way or another.
Today marks what is likely to be the last of the “big” changes to zink in Mesa 21.1 before the merge window closes in less than two weeks, and what changes they were.
Threaded context support is now implemented, which, on its own, makes zink vaguely competitive against native GL drivers. I’d expect that for many scenarios, people should start seeing upwards of 60-70% native perf when previously the numbers were much lower, excepting things like furmark, where a weird problem with alpha blending is still causing a massive perf hit.
If that wasn’t enough, my timeline semaphore handling also snuck in, providing a reduction in CPU overhead for asynchronous queue-related operations where supported. Special thanks to Vulkan crash test dummy and uninitialized variable enthusiast Lionel Landwerlin for tripping and falling over basically every line of code in this implementation to help get it to the finish line for your consumption.
And if that still wasn’t enough, my RADV draw dispatch refactor also landed yesterday, both paving the way for some totally secret future work of mine and also bringing a 3-4% reduction in CPU overhead for draws that will make your gaming feel faster now that you’re aware of it but realistically won’t have any discernible effect. Basically racing stripes.
Today, a brief post and lamentation.
I’m sure everyone is well aware of Vulkan semantics regarding array vs non-array image types: when using an array type, e.g., VK_IMAGE_TYPE_2D with VkImageCreateInfo::arrayLayers > 1, always use array members for accessing/copying/blitting, and when using a 3D type, always use depth members.
This means array types should use baseArrayLayer and layerCount for copying/blitting and arrayPitch for accessing subresource regions. Non-array types, specifically 3D types, should use VkExtent3D::depth and VkSubresourceLayout::depthPitch.
This is really important, as I’ve found out over the past week, given that this has not been handled as it should’ve in many places throughout the zink stack. Some drivers were cool and didn’t make a big deal about it. Other drivers were more accurate and have just been failing all along.
I was recently interviewed by Boiling Steam, a small Linux gaming-oriented news site focused on creating original content and interviewing only the most important figures within the community (like me). If you’ve ever wanted to know more about the rich open source pedigree of Super Good Code, the interview goes deep into the back catalogue of how things got to this point.
It’s been a while since I blogged about descriptors, so let’s fix that since this site may as well be called Super Good Descriptors.
Last time, I talked a bit about descriptors 3.0: lazy descriptors. The idea I settled on here was to do templated updates, and to do the absolute minimal amount of work possible for each draw while still never reusing any written-to descriptor sets once they’d been cycled out.
Lazy descriptors worked out great, and I’m sure many of you have grown to enjoy the ZINK: USING LAZY DESCRIPTORS log message that got spammed on startup over the past couple months of zink-wip.
Well, times have changed, and this message will no longer fill your terminal by default after today’s (20210330) zink-wip snapshot.
New today is the ZINK_DESCRIPTORS environment variable, supporting three modes of operation:
auto - the default, which attempts to detect system capabilities and use caching with templated updateslazy - the mode we all know and love from the past few monthsnotemplates - this is the old-style caching mechanismauto mode moves zink one step closer to my eventual goal, which is to be able to use driconf to do application-based mode changes to disable caching for apps which never reuse resources. Also potentially useful would be the ability to dynamically disable caching on a pipeline-by-pipeline basis while an application is running if too many cache misses are detected.
With that said, I’ve come to the conclusion that any form of caching may actually be, at best, equivalent to uncached mode for the general desktop user, and it may only be worthwhile for special cases, like Vulkan drivers which can’t do descriptor templates or embedded devices. In my latest testing (on desktop systems), I have yet to see any scenarios where lazy mode fails to provide the best performance.
ARM in particular seems to gain a lot from it, as the post shows a ~40% perf improvement. It’s unclear to me, however, whether any benchmarking was done against a highly optimized uncached implementation like I’ve done. The overhead from doing basic descriptor updating without templates is definitely significant, so it might just be that things are different now that more functionality is available. On Linux systems, at least, every Vulkan driver that matters supports descriptor templates, so this is functionality that can be relied upon.
No.
The goal of zink-wip is to provide an optimal testing environment with the absolute bleeding edge in terms of performance and features. The auto mode should provide that, and the cases I’ve seen where its performance is noticeably worse number exactly one, and it’s a subtest for drawoverhead. If anyone finds any other cases where auto is worse than lazy, I’m interested, but it shouldn’t be a concern.
With that said, it might be worth doing some benchmarking between the two for some extremely high CPU usage scenarios, as that’s the only case where it may be possible to detect a difference. Gone are the days of zink(-wip) hogging the whole CPU, so probably this is just useless pontificating to fill more of a blog page.
But also, if you’re doing any kind of benchmarking on a high-end CPU, I’d probably recommend going with the lazy mode for now.
I’m pleased with the current state of descriptor caching, but it does bother me that it isn’t dramatically better than the uncached mode on my desktop. I think this ultimately just comes down to the current cache implementation being split into two steps:
This effectively sits on top of the lazy mode, moving work out of the Vulkan driver and into the cache lookup any time there’s a cache hit. As such, I’ve been considering working to shift some of this work into threads, though this is somewhat challenging given the current gallium API. Specifically, only SSBOs and shader images can be per-stage updated immediately after bind, as both UBOs and samplers bind only a single descriptor slot at a time, meaning there’s no way to know when the “final” one is bound.
But then again, I’ve certainly reached the point of diminishing returns now. Most applications that I test have minimal CPU usage for the zink driver thread (e.g., Unigine Superposition is only at about 10% utilization on a i7-6700K), and are instead bottlenecking hard in the GPU, so I think it’s time to call things “good enough” here unless things change in a significant way.
A restrictive end-user license agreement is one way a company can exert power over the user. When the free software movement was founded thirty years ago, these restrictive licenses were the primary user-hostile power dynamic, so permissive and copyleft licenses emerged as synonyms to software freedom. Licensing does matter; user autonomy is lost with subscription models, revocable licenses, binary-only software, and onerous legal clauses. Yet these issues pertinent to desktop software do not scratch the surface of today’s digital power dynamics.
Today, companies exert power over their users by: tracking, selling data, psychological manipulation, intrusive advertising, planned obsolescence, and hostile Digital “Rights” Management (DRM) software. These issues affect every digital user, technically inclined or otherwise, on desktops and smartphones alike.
The free software movement promised to right these wrongs via free licenses on the source code, with adherents arguing free licenses provide immunity to these forms of malware since users could modify the code. Unfortunately most users lack the resources to do so. While the most egregious violations of user freedom come from companies publishing proprietary software, these ills can remain unchecked even in open source programs, and not all proprietary software exhibits these issues. The modern browser is nominally free software containing the trifecta of telemetry, advertisement, and DRM; a retro video game is proprietary software but relatively harmless.
As such, it’s not enough to look at the license. It’s not even enough to consider the license and a fixed set of issues endemic to proprietary software; the context matters. Software does not exist in a vacuum. Just as proprietary software tends to integrate with other proprietary software, free software tends to integrate with other free software. Software freedom in context demands a gentle nudge towards software in user interests, rather than corporate interests.
How then should we conceptualize software freedom?
Consider the three adherents to free software and open source: hobbyists, corporations, and activists. Individual hobbyists care about tinkering with the software of their choice, emphasizing freely licensed source code. These concerns do not affect those who do not make a sport out of modifying code. There is nothing wrong with this, but it will never be a household issue.
For their part, large corporations claim to love “open source”. No, they do not care about the social movement, only the cost reduction achieved by taking advantage of permissively licensed software. This corporate emphasis on licensing is often to the detriment of software freedom in the broader context. In fact, it is this irony that motivates software freedom beyond the license.
It is the activist whose ethos must apply to everyone regardless of technical ability or financial status. There is no shortage of open source software, often of corporate origin, but this is insufficient – it is the power dynamic we must fight.
We are not alone. Software freedom is intertwined with contemporary social issues, including copyright reform, privacy, sustainability, and Internet addiction. Each issue arises as a hostile power dynamic between a corporate software author and the user, with complicated interactions with software licensing. Disentangling each issue from licensing provides a framework to address nuanced questions of political reform in the digital era.
Copyright reform generalizes the licensing approaches of the free software and free culture movements. Indeed, free licenses empower us to freely use, adapt, remix, and share media and software alike. However, proprietary licenses micromanaging the core of human community and creativity are doomed to fail. Proprietary licenses have had little success preventing the proliferation of the creative works they seek to “protect”, and the rights to adapt and remix media have long been exercised by dedicated fans of proprietary media, producing volumes of fanfiction and fan art. The same observation applies to software: proprietary end-user license agreements have stopped neither file sharing nor reverse-engineering. In fact, a unique creative fandom around proprietary software has emerged in video game modding communities. Regardless of legal concerns, the human imagination and spirit of sharing persists. As such, we need not judge anyone for proprietary software and media in their life; rather, we must work towards copyright reform and free licensing to protect them from copyright overreach.
Privacy concerns are also traditional in software freedom discourse. True, secure communications software can never be proprietary, given the possibility of backdoors and impossibility of transparent audits. Unfortunately, the converse fails: there are freely licensed programs that inherently compromise user privacy. Consider third-party clients to centralized unencrypted chat systems. Although two users of such a client privately messaging one another are using only free software, if their messages are being data mined, there is still harm. The need for context is once more underscored.
Sustainability is an emergent concern, tying to software freedom via the electronic waste crisis. In the mobile space, where deprecating smartphones after a few short years is the norm and lithium batteries are hanging around in landfills indefinitely, we see the paradox of a freely licensed operating system with an abysmal social track record. A curious implication is the need for free device drivers. Where proprietary drivers force devices into obsolescence shortly after the vendor abandons them in favour of a new product, free drivers enable long-term maintenance. As before, licensing is not enough; the code must also be upstreamed and mainlined. Simply throwing source code over a wall is insufficient to resolve electronic waste, but it is a prerequisite. At risk is the right of a device owner to continue use of a device they have already purchased, even after the manufacturer no longer wishes to support it. Desired by climate activists and the dollar conscious alike, we cannot allow software to override this right.
Beyond copyright, privacy, and sustainability concerns, no software can be truly “free” if the technology itself shackles us, dumbing us down and driving us to outrage for clicks. Thanks to television culture spilling onto the Internet, the typical citizen has less to fear from government wiretaps than from themselves. For every encrypted message broken by an intelligence agency, thousands of messages are willingly broadcast to the public, seeking instant gratification. Why should a corporation or a government bother snooping into our private lives, if we present them on a silver platter? Indeed, popular open source implementations of corrupt technology do not constitute success, an issue epitomized by free software responses to social media. No, even without proprietary software, centralization, or cruel psychological manipulation, the proliferation of social media still endangers society.
Overall, focusing on concrete software freedom issues provides room for nuance, rather than the traditional binary view. End-users may make more informed decisions, with awareness of technologies’ trade-offs beyond the license. Software developers gain a framework to understand how their software fits into the bigger picture, as a free license is necessary but not sufficient for guaranteeing software freedom today. Activists can divide-and-conquer.
Many outside of our immediate sphere understand and care about these issues; long-term success requires these allies. Claims of moral superiority by licenses are unfounded and foolish; there is no success backstabbing our friends. Instead, a nuanced approach broadens our reach. While abstract moral philosophies may be intellectually valid, they are inaccessible to all but academics and the most dedicated supporters. Abstractions are perpetually on the political fringe, but these concrete issues are already understood by the general public. Furthermore, we cannot limit ourselves to technical audiences; understanding network topology cannot be a prerequisite to private conversations. Overemphasizing the role of source code and under-emphasizing the power dynamics at play is a doomed strategy; for decades we have tried and failed. In a post-Snowden world, there is too much at stake for more failures. Reforming the specific issues paves the way to software freedom. After all, social change is harder than writing code, but with incremental social reform, licenses become the easy part.
The nuanced analysis even helps individual software freedom activists. Purist attempts to refuse non-free technology categorically are laudable, but outside a closed community, going against the grain leads to activist burnout. During the day, employers and schools invariably mandate proprietary software, sometimes used to facilitate surveillance. At night, popular hobbies and social connections today are mediated by questionable software, from the DRM in a video game to the surveillance of a chat with a group of friends. Cutting ties with friends and abandoning self-care as a prerequisite to fighting powerful organizations seems noble, but is futile. Even without politics, there remain technical challenges to using only free software. Layering in other concerns, or perhaps foregoing a mobile smartphone, only amplifies the risk of software freedom burnout.
As an application, this approach to software freedom brings to light disparate issues with the modern web raising alarm in the free software community. The traditional issue is proprietary JavaScript, a licensing question, yet considering only JavaScript licensing prompts both imprecise and inaccurate conclusions about web “applications”. Deeper issues include rampant advertising and tracking; the Internet is the largest surveillance network in human history, largely for commercial aims. To some degree, these issues are mitigated by script, advertisement, and tracker blockers; these may be pre-installed in a web browser for harm reduction in pursuit of a gentler web. However, the web’s fatal flaw is yet more fundamental. By design, when a user navigates to a URL, their browser executes whatever code is piped on the wire. Effectively, the web implies an automatic auto-update, regardless of the license of the code. Even if the code is benign, it is still every year more expensive to run, forcing a hardware upgrade cycle deprecating old hardware which would work if only the web weren’t bloated by corporate interests. A subtler point is the “attention economy” tied into the web. While it’s hard to become addicted to reading in a text-only browser, binge-watching DRM-encumbered television is a different story. Half-hearted advances like “Reading Mode” are limited by the ironic distribution of documents over an app store. On the web, disparate issues of DRM, forced auto-update, privacy, sustainability, and psychological dark patterns converge to a single worst case scenario for software freedom. The licenses were only the beginning.
Nevertheless, there is cause for optimism. Framed appropriately, the fight for software freedom is winnable. To fight for software freedom, fight for privacy. Fight for copyright reform. Fight for sustainability. Resist psychological dark patterns. At the heart of each is a software freedom battle – keep fighting and we can win.
Declaration of Digital Autonomy
Local-first software: You own your data, in spite of the cloud


