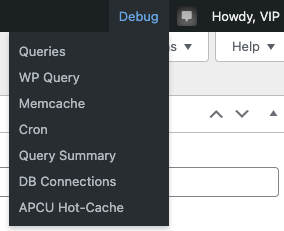
Debug Bar
How to enable
The Debug Bar is enabled through code, by hooking into debug_bar_enable filter, found in the debug-bar.php file. Logic can be added to enable the Debug Bar for specific user accounts, or for specific WordPress user roles as shown in the following code example. This code should be added to a file in client-mu-plugins:
/**
 * Enable Debug Bar for a defined set of roles or users.
 *
 * @param bool $enable Whether the Debug bar should be enabled.
 */
function vip_custom_enable_debug( $enable ) {

    $allowed_roles = array( 'administrator' );
	// Optional, enable for specific user logins.
    // $allowed_users = array( 'dev_user_login', 'qa_user_login' );

    if ( is_user_logged_in() ) {
        $user  = wp_get_current_user();
        $login = $user->get('user_login');
        $roles = (array) $user->roles;

        // Allow if the user is assigned a role in the $allow_role array.
        if ( count( array_intersect( $roles, $allowed_roles ) ) > 0 ) {
            return true;
        }

        // Allow if the user's login is in the $allowed_users array.
        if ( isset( $allowed_users ) && in_array( $login, $allowed_users ) ) {
            return true;
        }
    }

    return $enable;
}

add_filter( 'debug_bar_enable', 'vip_custom_enable_debug', 100, 1 );Once enabled, the Debug Bar is accessible from the top right corner of the WordPress Admin Bar when logged in.

Environment information
Information specific to the environment is displayed at the top of the Debug Bar panel:
- PHP: Running version of PHP
- DB: Database version of MySQL
- Memory Usage: Memory usage by the current page
Debug Bar panels
The type of debug information available in the Debug Bar menu will vary based on the type of page that is currently loaded.
WP_Http
Any outgoing HTTP calls made by the current page using the WP_Http class are displayed here. In each row, a call’s start, duration, method, and target URL are listed. Selecting the Toggle link under the More column displays the details of the request sent.
Notices/Warnings
PHP errors, warnings and notices thrown by the current page are listed, as well as the related stack trace and location of the file and line causing the error, warning, or notice.

Queries
SQL queries sent to both the database and Memcache are listed in order of execution. The top of the page displays statistics for Total Queries sent, Total Query Time, Peak Memory Used, and Total Memcache Query Time.
WP Query
WP_Query details are displayed including Queried Object ID, Query Type, Query Template, Show On Front, and Post Type. Additional details displayed lower on the panel include Query Arguments, Query SQL, and an array of Queried Object data.
Deprecated
The file location and line number for deprecated PHP functions used by the current page are listed. Each deprecation notice for a function is followed by a suggestion for a replacement function to be used instead.

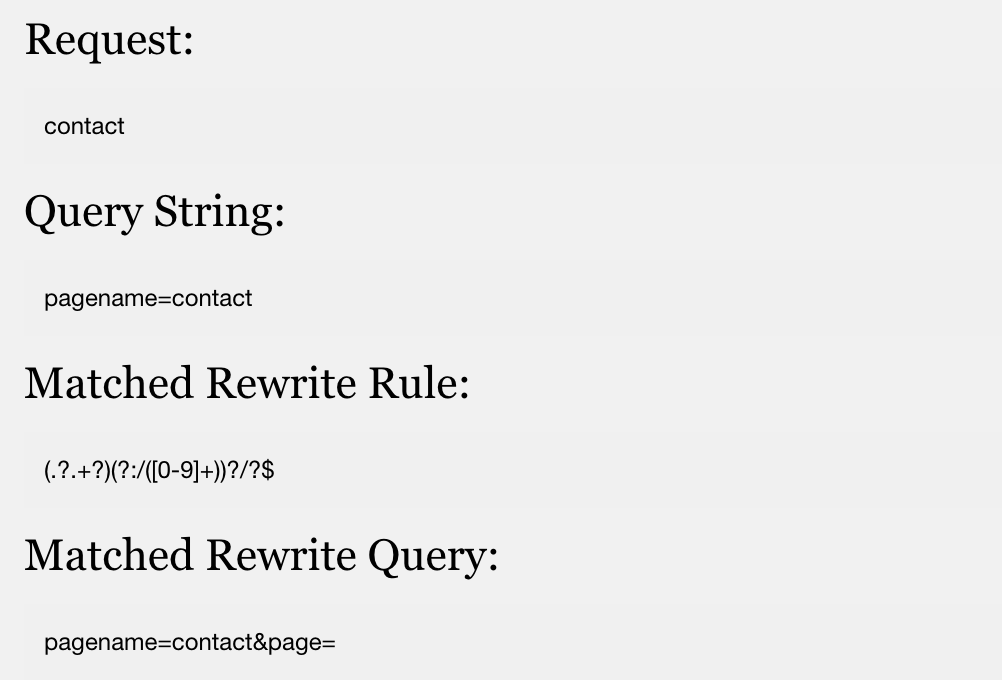
Request
An overview of how the page request is processed by WordPress, including the Request, Query string, Matched Rewrite Rule and Matched Rewrite Query. The information displayed on this panel is especially helpful when using rewrite rules or custom permalinks.

Memcache
A breakdown of information related to the Memcached calls made by the current page is displayed in a row at the top of page, including Total memcache query time, Total memcache size, get, get_local, get_multi, set, set_local, add, and get_flush_number.
Below that is a bullet-pointed list of linked cache groups for the Memcached calls. Selecting one of the linked cache groups will display below the list:
- Information about the gets and sets happening in the request.
- The number of requests and the total size of each group.
JavaScript
JavaScript errors that are present on the current page are listed with the file and line number where the error originates. This does not include JavaScript errors from externally loaded third-party scripts.

ElasticPress
If ElasticPress is enabled, details related to the queries sent to the search service are listed including the Time Taken to execute the query, the URL the query was sent to, and the Method used. Additional details can be reviewed by toggling the black triangle icon located to the right of Headers, Query Body, Query Response Code, and Query Result.

Jetpack Search
The query information sent by Jetpack Search made by the current page including the response code (response_code), arguments sent (args), elapsed time (elapsed_time), search API URL (url), and the response (response) in JSON format.
Cron
Core and custom cron events and the information related to each are outlined in this panel. The top of the panel displays summary information including Total Events, number of Core Events, number of Custom Events, number of currently running cron events (Doing Cron), Next Event, and the Current Time in UTC.
Custom Events and Core Events are listed in separate sub-panels, and details for each event include Next Execution, Hook, Interval Hook, Interval, and Value Args.
Cron events highlighted in yellow have no actions hooked into them, most likely because a plugin or a theme was de-activated or uninstalled and did not clean up after itself.
Query Summary
Unique SQL queries, the number of times each query was executed, and the execution time in milliseconds are displayed in the panel. The listed queries are displayed in one of three colors, indicating the query’s relative speed of execution.
- Red: Slow queries calculation is relative based on the maximum execution time. It is possible that a query will display in red and not actually be that slow in milliseconds, as it will be the slowest query as compared to all other executed queries on that page. A query is determined to be slow if takes between 30 to 100% of the duration of the longest query executed on that given page.
- Orange: Queries that take between 10 and 29% of the duration of the longest query executed on the current page.
- Green: Queries that take 9% or less in duration as compared to the slowest query.
DB Connections
Database connections that were used to execute the queries on the current page are listed. The dbhname value will have either __r (read) or __w (write) appended to it indicating if the queries were executed against a replica database (__r) or the primary database (__w).

global__w and 15 queries sent to the replica database global__rRemote Requests
A list of remote requests made by the page currently loaded, such as those made by xmlrpc.php, the Status code returned, the URL requested, the Time it took to make the request, the Message returned, and other related details are displayed.
Elasticsearch
If the currently loaded page has made an Elasticsearch query, the number of queries made, Total Query Time, and Total ES Engine Time are displayed in a row at the top of the panel. Displayed further down are the query’s Request and Response in JSON format, a Backtrace, and a cURL of the request.
APCU Hot-Cache
The APC Cache Interceptor creates short-term local caches for frequently accessed Memcached keys. The Configuration sub-panel shown in the Debug Bar lists the configuration details for each group of short-term local caches, including the type, group name, key pattern, and the cached time to live (ttl).
The Intercepted Values sub-panel further down displays the actual intercepted keys (key) and their values (value) and the group they belong to.