Sumo Logic
This tutorial explains how to analyze Cloudflare Logs using the Cloudflare App for Sumo Logic.
Overview
If you have not used Cloudflare Logs before, refer to the Logs documentation for more details. Contact your Cloudflare Customer Account Team to enable logs for your account.
This tutorial describes how to use Cloudflare Logpush to send logs to AWS S3 and the AWS S3 source collector to get logs into Sumo Logic. To learn how to use Logpush to send logs to AWS S3, refer to the Logpush documentation. Alternatively, you can use Logpull to get logs to your Sumo Logic instance directly and skip Task 1.
Prerequisites
Before sending your Cloudflare log data to Sumo Logic, make sure that you:
- Have an existing Sumo Logic account
- Have a Cloudflare Enterprise account with Cloudflare Logs enabled
- Configure Logpush or Logpull
- Consult the Sumo Logic documentation for the Cloudflare App
Task 1 - Send Cloudflare Logs data to Sumo Logic
You can use either Cloudflare Logpush or AWS S3 to send your Cloudflare Logs data to Sumo Logic.
1.1 - Send logs data via Cloudflare Logpush
To enable Cloudflare Logpush in Sumo Logic:
Configure a Hosted Collector.
Configure an HTTP Logs and Metrics Source.
Provide the HTTP Source Address (URL) required by the Cloudflare Logpush API or Cloudflare dashboard UI.
Enable Cloudflare Logpush to Sumo Logic.
1.2 Send log data via AWS S3
To connect AWS S3 to Sumo Logic:
Begin collecting Cloudflare logs data.
Task 2 - Filter Workers requests
If you have Cloudflare Workers enabled and want to filter them out from the logs, do the following:
Under Processing Rules for Logs create a Filter (processing rule regex on our Cloudflare collector) to exclude any log data where WorkerSubrequest is true, as illustrated below:

Task 3 - Install the Cloudflare App
To install the Cloudflare App for Sumo Logic:
In the Sumo Logic UI, click App Catalog and search for Cloudflare.
Click Add to Library and specify the Source category Cloudflare, which was completed in Step 1.
You should now be able to see the Cloudflare dashboards populated with your Cloudflare log data.
Task 4 - View the Dashboards
There are nine dashboards to help you analyze Cloudflare logs. You can also use filters within the dashboards to help narrow the analysis by date and time, device type, country, user agent, client IP, hostname, and more, to further help with debugging and tracing.
About the Dashboards
Cloudflare - Snapshot
Get a quick overview of the most important metrics from your websites and applications on the Cloudflare network.

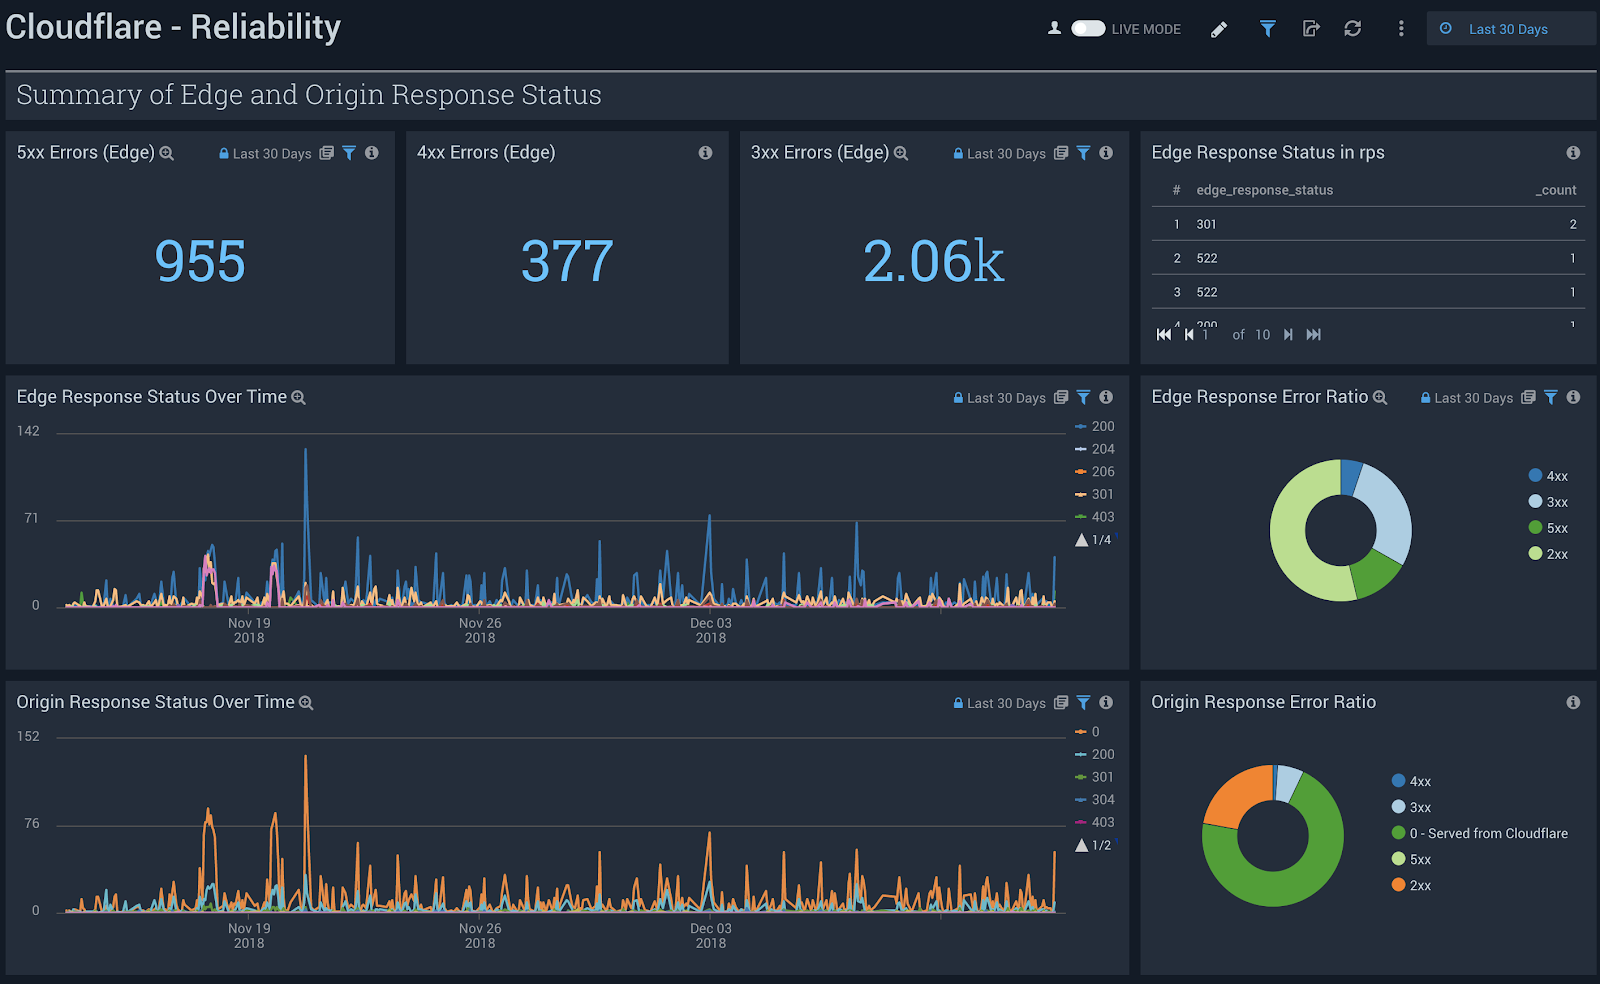
Cloudflare - Reliability
Get insights on the availability of your websites and Applications. Metrics include origin response error ratio, origin response status over time, percentage of 3xx/4xx/5xx errors over time, and more.
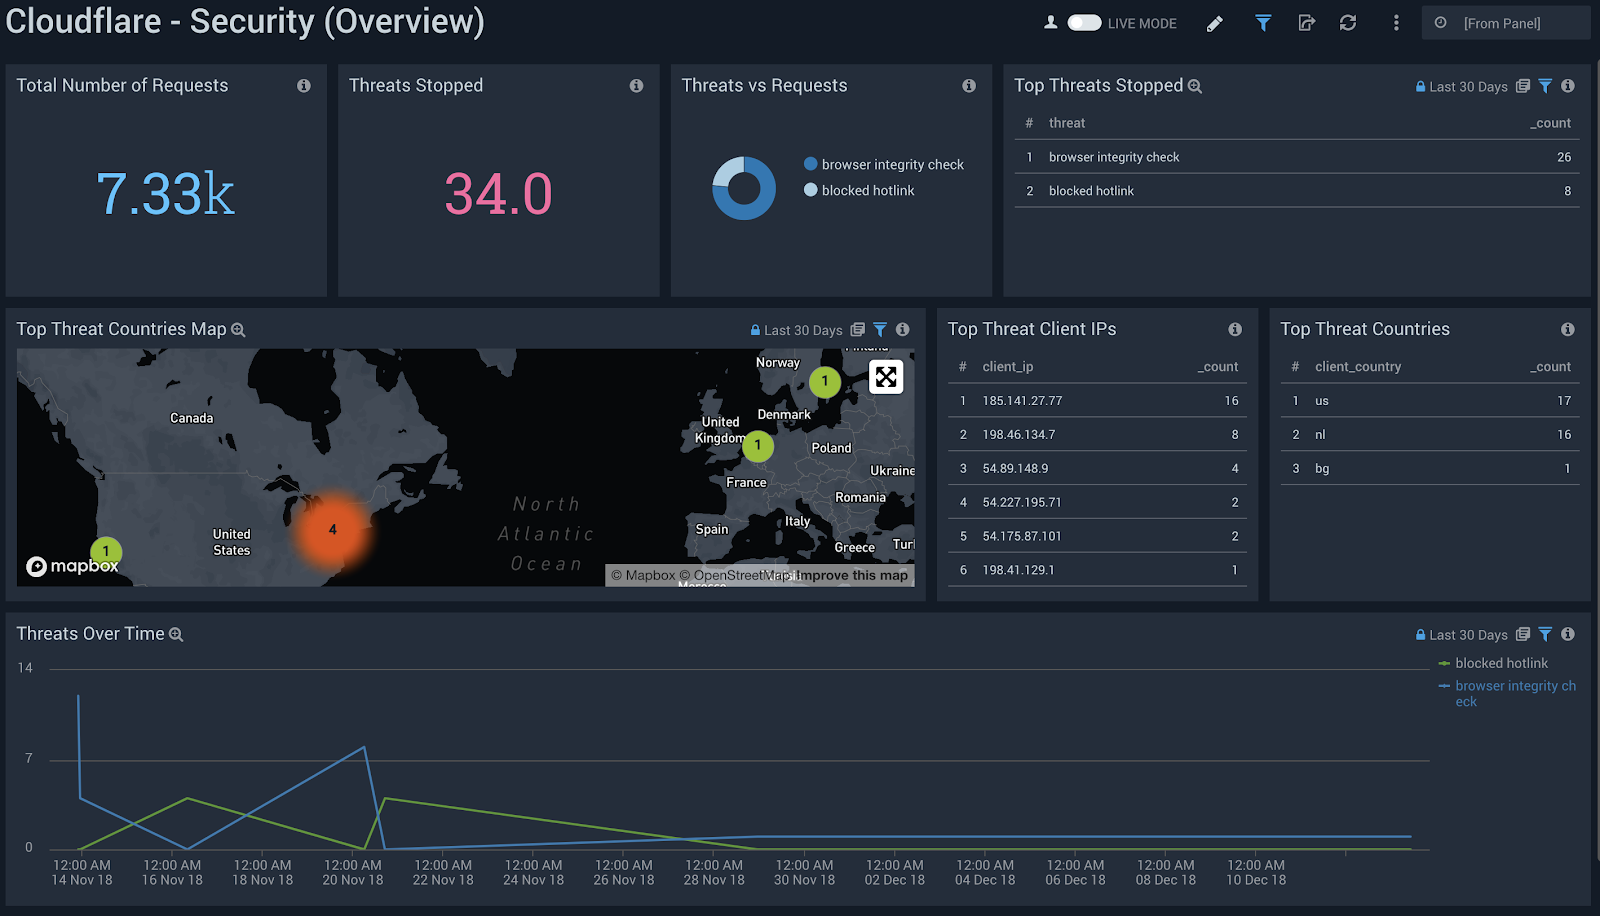
Cloudflare - Security (Overview)
Get insights on threats to your websites and applications, including number of threats stopped, threats over time, top threat countries, and more.
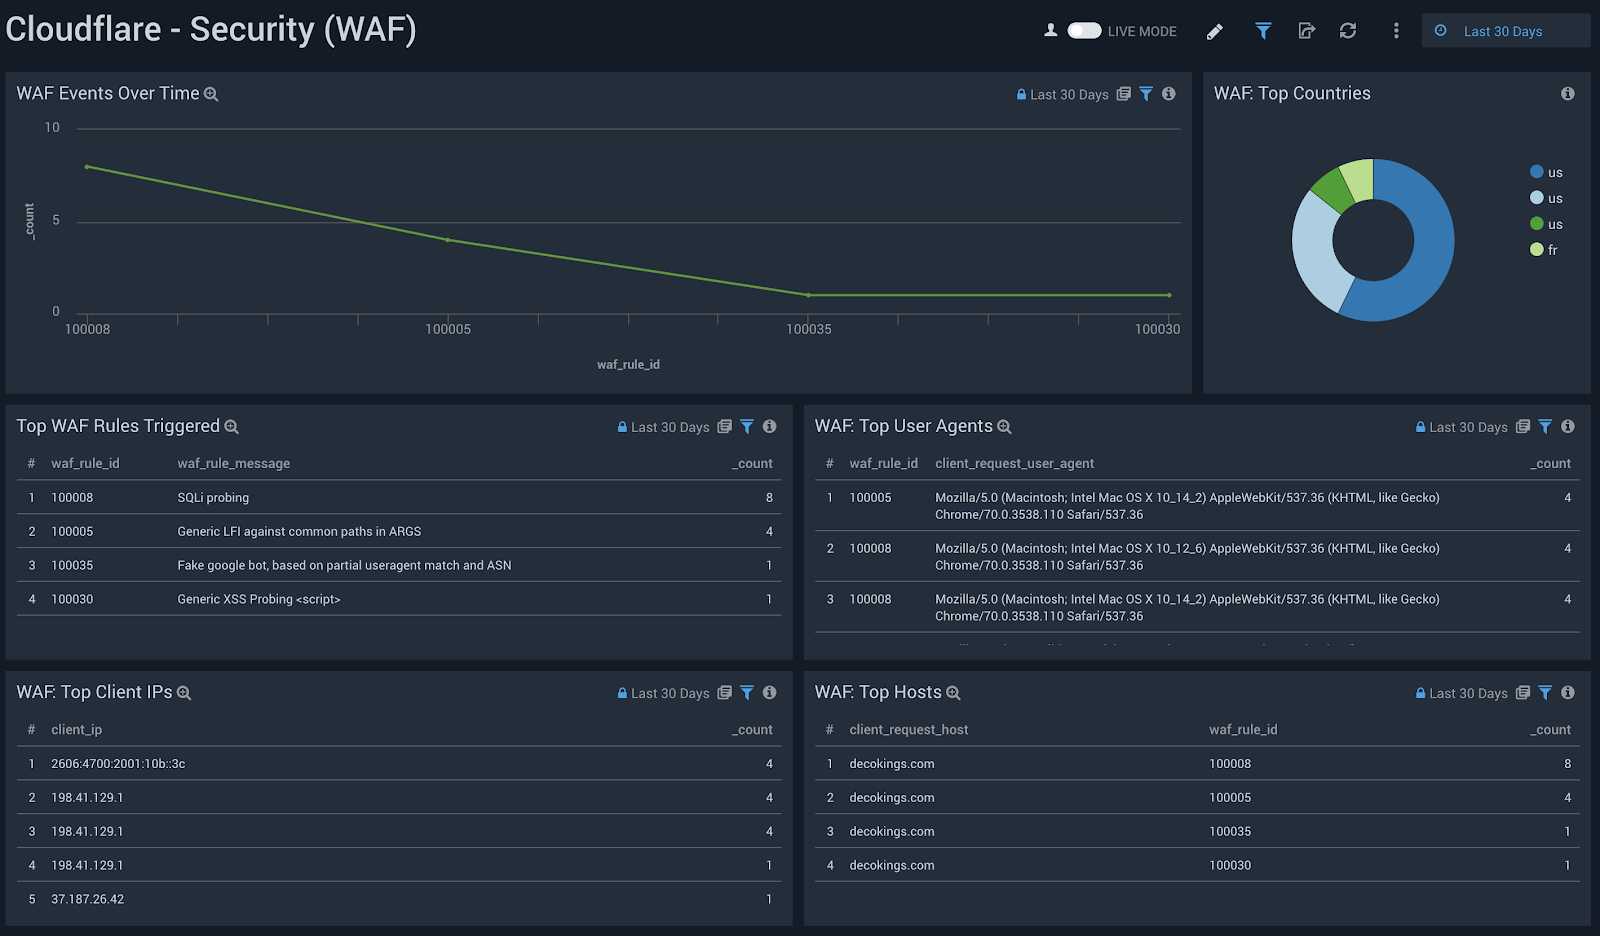
Cloudflare - Security (WAF)
Get insights on threat identification and mitigation by our Web Application Firewall, including events like SQL injections, XSS, and more. Use this data to fine tune the firewall to target obvious threats and prevent false positives.
Cloudflare - Security (Rate Limiting)
Get insights on rate limiting protection against denial-of-service attacks, brute-force login attempts, and other types of abusive behavior targeted at your websites or applications.

Cloudflare - Security (Bot Management)
Investigate bot activity on your website to prevent content scraping, checkout fraud, spam registration and other malicious activities.

Cloudflare - Performance (Requests, Bandwidth, Cache)
Identify and address performance issues and caching misconfigurations. Metrics include total vs. cached bandwidth, saved bandwidth, total requests, cache ratio, top uncached requests, and more.

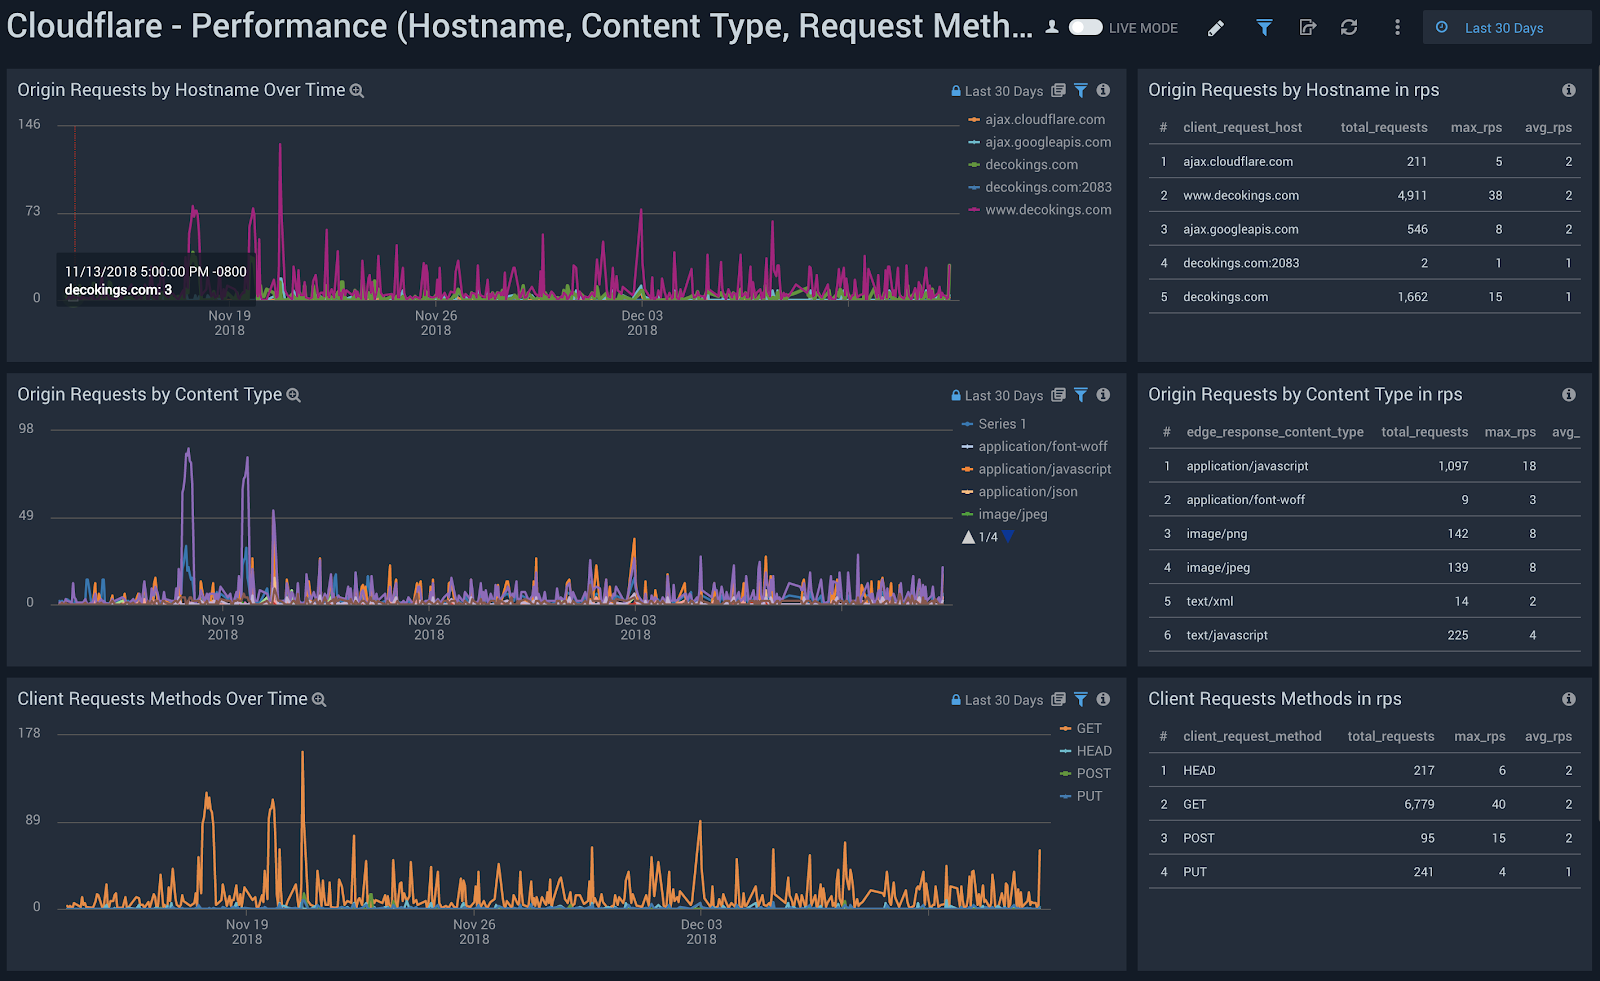
Cloudflare - Performance (Hostname, Content Type, Request Methods, Connection Type)
Get insights into your most popular hostnames, most requested content types, breakdown of request methods, and connection type.
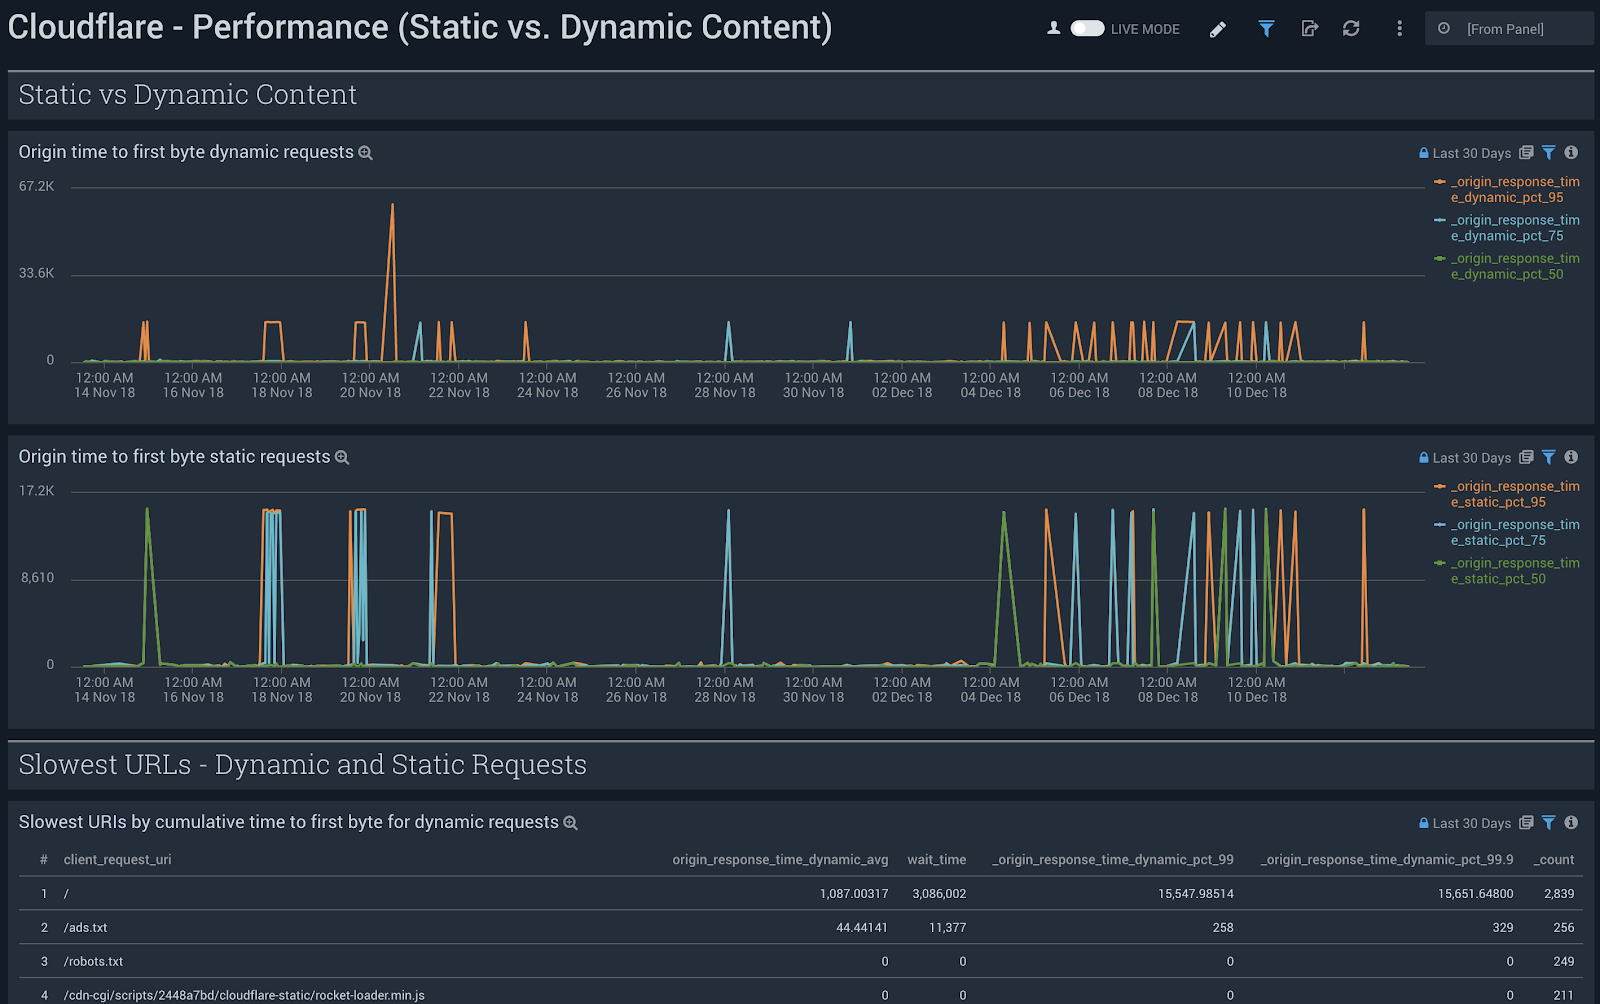
Cloudflare - Performance (Static vs. Dynamic Content)
Get insights into the performance of your static and dynamic content, including slowest URLs.
Filters
All dashboards have a set of filters that you can apply to the entire dashboard, as shown below.
Click the funnel icon in the top dashboard menu bar to display a scrollable list of filters that are applied across the entire dashboard.

Each panel has a set of filters that are applied to the results for that panel only, as shown in the following example. Click the funnel icon in the top panel menu bar to display a list of panel-specific filters.
The default time interval is set to 24 hours. Note that for correct filter calculations, you need to exclude Worker subrequests (WorkerSubrequest = false) and purge requests (ClientRequestMethod is not PURGE).
Available Filters
Date (EdgeStartTimestamp)
client_country
client_device_type
client_ip
client_request_host
client_request_method
client_request_uri
client_request_user_agent
edge_response_status
origin_ip
origin_response_status
ray_id
worker_subrequest
Debugging tips
Incomplete dashboards
The Sumo Logic Cloudflare App relies on data from the Cloudflare Enterprise Logs fields outlined below. Depending on which fields you have enabled, certain dashboards might not populate fully.
If that is the case, verify and test the Cloudflare App filters below each dashboard (these filters are the same across all dashboards). You can delete any filters that you don’t need, even if such filters include data fields already contained in your logs.
The available fields are:
CacheCacheStatus
CacheResponseBytes
CacheResponseStatus
ClientASN
ClientCountry
ClientDeviceType
ClientIP
ClientIPClass
ClientRequestBytes
ClientRequestHost
ClientRequestMethod
ClientRequestPath
ClientRequestProtocol
ClientRequestReferer
ClientRequestURI
ClientRequestUserAgent
ClientSSLCipher
ClientSSLProtocol
ClientSrcPort
EdgeColoCode
EdgeColoID
EdgeEndTimestamp
EdgePathingOp
EdgePathingSrc
EdgePathi
ngStatus
EdgeRateLimitAction
EdgeRateLimitID
EdgeRequestHost
EdgeResponseBytes
EdgeResponseContentType
EdgeResponseStatus
EdgeServerIP
EdgeStartTimestamp
FirewallMatchesActions
FirewallMatchesSources
FirewallMatchesRuleIDs
OriginIP
OriginResponseStatus
OriginResponseTime
OriginSSLProtocol
RayID
WAFAction
WAFFlags
WAFMatchedVar
WAFProfile
WAFRuleID
WAFRuleMessage
WorkerSubrequest
ZoneID