Last Updated: November 2021
In addition to evaluations of other charities, GiveWell publishes evaluations of our own work. This page summarizes the funding we influenced in 2020, the most recent year for which data is available and analyzed.
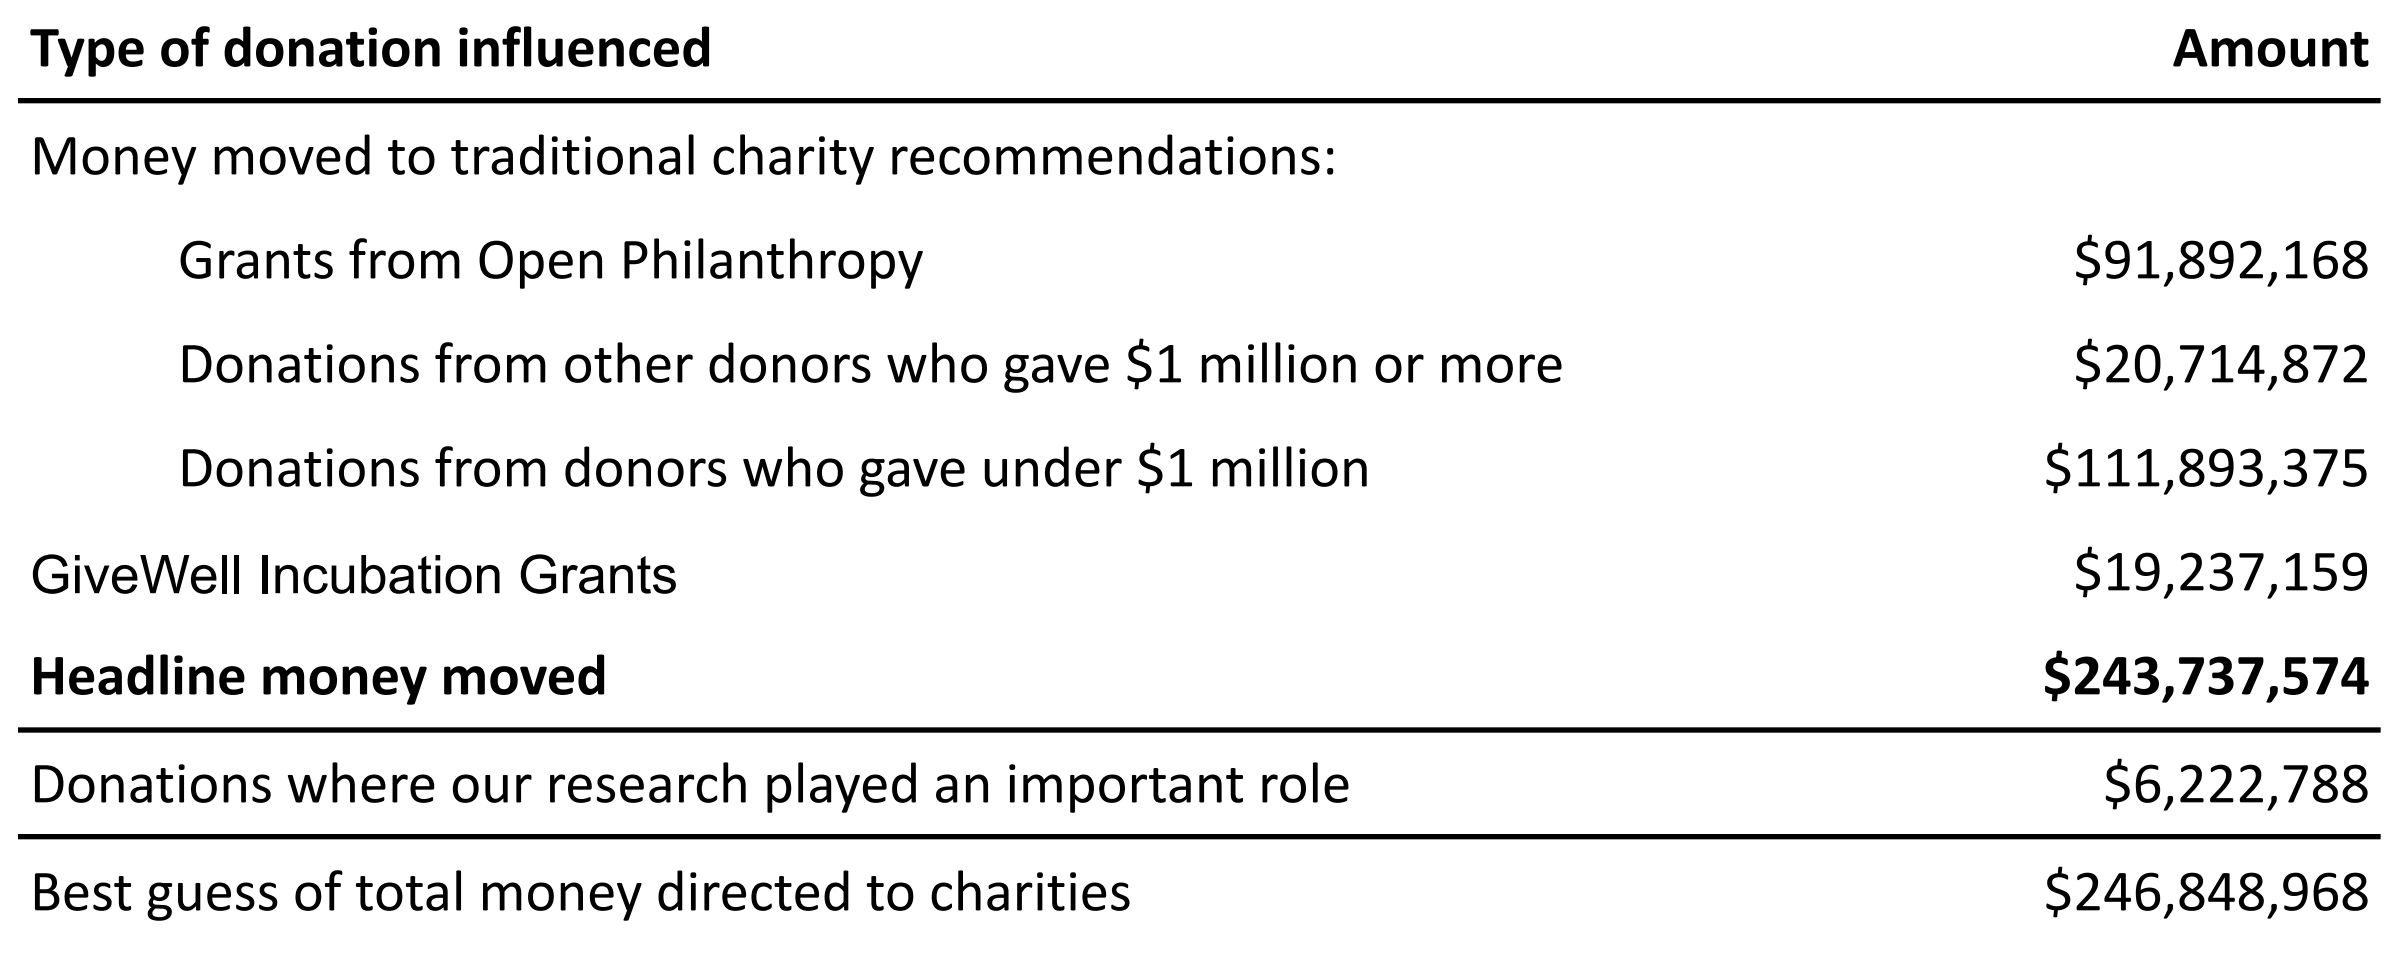
Money moved
In 2020, GiveWell influenced charitable giving in several ways. The following table summarizes the money that we were able to track.
For more details on our money moved, our growth, and our donors, see:
Money moved to recommended charities
The chart below shows GiveWell's annual money moved to our recommended charities (top charities and standout charities)1 and via our Incubation Grants program. In this chart, we include only donations that we can confidently attribute to our research (more detailed definition below).
Please note that the Open Philanthropy support marked in gray on the chart below refers only to grants that Open Philanthropy, the single largest funder of our recommended charities, made to GiveWell's top and standout charities. It does not include support that Open Philanthropy provided as a funder of GiveWell Incubation Grants, which are listed separately in purple.2

The table below shows GiveWell's money moved to our recommended and standout charities (excluding Incubation Grants).3
| Charity | 2020 | 2019 | 2018 | 2017 | 2016 | 2015 | 2014 | 2013 | 2007-2012 |
|---|---|---|---|---|---|---|---|---|---|
| Malaria Consortium (SMC program) | $69,015,249 | $52,851,227 | $37,339,086 | $29,125,071 | $5,054,101 | $0 | $0 | $0 | $0 |
| Against Malaria Foundation | $60,828,825 | $30,098,834 | $28,581,931 | $20,663,628 | $33,742,956 | $38,786,450 | $9,866,835 | $2,551,449 | $9,035,391 |
| GiveDirectly | $41,644,770 | $17,407,199 | $14,013,550 | $10,103,626 | $18,390,049 | $57,185,355 | $12,171,167 | $11,033,254 | $1,558,497 |
| New Incentives | $18,276,865 | $0 | $0 | $0 | $0 | $0 | $0 | $0 | $0 |
| Helen Keller International (VAS program) | $15,690,700 | $15,222,982 | $10,943,891 | $7,776,601 | $0 | $0 | $0 | $0 | $0 |
| Evidence Action (Deworm the World) | $6,735,882 | $2,669,534 | $12,392,229 | $26,044,483 | $7,112,402 | $11,910,125 | $1,167,635 | $2,145,379 | $0 |
| SCI Foundation (Schistosomiasis Control Initiative) | $4,061,584 | $2,846,190 | $5,947,206 | $12,098,906 | $16,123,430 | $3,685,071 | $6,399,690 | $2,202,407 | $1,972,620 |
| Sightsavers (deworming program) | $3,916,707 | $2,996,005 | $9,999,763 | $2,660,257 | $3,109,090 | $0 | $0 | $0 | $0 |
| Evidence Action Unrestricted | $1,115,511 | $344,904 | $372,756 | $0 | $0 | $0 | $0 | $0 | $0 |
| END Fund (deworming program) | $985,449 | $2,941,175 | $2,772,566 | $2,842,723 | $5,422,097 | $0 | $0 | $0 | $0 |
| Development Media International | $884,720 | $9,028,197 | $1,298,110 | $409,303 | $663,107 | $500,035 | $612,540 | $0 | $0 |
| Iodine Global Network | $429,823 | $520,860 | $497,063 | $571,431 | $597,766 | $857,885 | $478,530 | $0 | $0 |
| GAIN (Universal Salt Iodization) | $187,546 | $159,829 | $177,681 | $225,806 | $559,603 | $494,309 | $484,792 | $0 | $0 |
| Living Goods | $179,049 | $206,260 | $186,506 | $126,615 | $331,518 | $338,936 | $514,893 | $0 | $0 |
| Project Healthy Children | $169,844 | $244,238 | $162,268 | $140,502 | $377,360 | $0 | $0 | $0 | $0 |
| Food Fortification Initiative | $155,001 | $135,265 | $168,461 | $150,242 | $362,678 | $0 | $0 | $0 | $0 |
| Evidence Action (Dispensers for Safe Water) | $144,312 | $250,561 | $154,810 | $135,453 | $0 | $0 | $0 | $0 | $0 |
| Zusha! Road Safety Campaign | $70,071 | $112,478 | $109,328 | $0 | $0 | $0 | $0 | $0 | $0 |
| Precision Agriculture for Development | $8,505 | $0 | $0 | $0 | $0 | $0 | $0 | $0 | $0 |
| Malaria Consortium (unrestricted) | $0 | $0 | $150,338 | $0 | $0 | $0 | $0 | $0 | $0 |
| Other/previously recommended charities | $0 | $409,577 | $167,785 | $7,728,428 | $0 | $0 | $0 | $54,343 | $4,899,738 |
| Total to recommended charities | $224,500,413 | $138,445,315 | $125,435,328 | $120,803,075 | $91,846,157 | $113,758,166 | $31,696,082 | $17,986,832 | $17,466,246 |
Notes:
- Because a significant amount of GiveWell's money moved comes in around December each year, we only update these figures annually.
- Because donations tend to be clustered in late December and early January, grouping these donations together provides a more accurate picture of annual growth. In the table and chart above, we report on "metrics years," each of which covers the period from February 1 to January 31 (e.g., "2020" refers to February 1, 2020 to January 31, 2021).
Money moved by program
Our recommended charities implement a variety of health and poverty alleviation programs. But some charities work on the same type of program. For example, we recommend four charities for their programs that support treatments for parasitic worm infections (deworming programs), and two charities for their programs to prevent malaria (Malaria Consortium’s seasonal malaria chemoprevention program and the Against Malaria Foundation).
The table below shows GiveWell's 2020 money moved by program area (excluding Incubation Grants). The majority was directed to malaria prevention programs—followed by unconditional cash transfers, conditional cash transfers to promote vaccination, deworming, and vitamin A supplementation. Other programs each received less than 1% of our total money moved (excluding Incubation Grants).

Incubation Grants
In 2020, Open Philanthropy, EA Funds, and private donors made GiveWell Incubation Grants due to our recommendation, totaling $19 million.4 These grants support organizations at any point in their development. The following table shows Incubation Grants made in our 2020 metrics year.
Other money moved
In addition to donations that we can confidently attribute to our research (detailed definition of these types of donations below), our best guess is that we had additional impact in 2020 via funding directed by The Life You Can Save, an organization that makes charity recommendations. We believe our research has played a significant role in the decisions of this organization, but we also understand that our research was not the only input into its decisions about what to recommend, and we therefore include it in the table above in a separate category from our headline money moved.
Details about other money moved are available in our 2020 annual metrics report.
What we count as "money moved"
- Donations made to GiveWell to support our recommended charities.
- Donations made directly to our recommended charities that donors reported as attributable to GiveWell.
- Donations made directly to our recommended charities that donors reported as attributable to other organizations that we believe relied heavily on our research (e.g., Effective Altruism Foundation, RC Forward, Effective Altruism Australia).
- Donations that donors report to us (informally or using our donation report form) as donations that they made on the strength of our recommendation.
- Grants made as part of our Incubation Grants program.
We are cautious not to double-count donations reported by the charity and the donor. For more details on our methodology, see the appendix of our 2020 annual metrics report.
Previous metrics reports
- 1.
Note that as of October 2021, we have discontinued the standout charity designation. See this blog post for more details.
- 2.
In previous years, Open Philanthropy has been the primary funder of GiveWell Incubation Grants. However, in 2020, other donors constituted 48% of total Incubation Grant funding.
- 3.
The amounts listed in this table represent our most recent estimates of our money moved by charity from 2007 to 2020. These figures may not correspond precisely with those presented in past metrics reports. We sometimes receive new information after publishing our annual metrics reports that causes us to update our money moved estimates for prior years.
- 4.
An additional $250,000 in Incubation Grants were made using GiveWell's unrestricted funding.