14 July 2021: Aberdeen Python User group (APUG) “Green Thumb Tech: Using a Raspberry Pi to monitor your house plants” by Euan Wielewski Tickets
11 Aug 2021 APUG – Speaker and Topic to be confirmed – Tickets
08 Sep 2021 APUG – Speaker and Topic to be confirmed – Tickets
2 – 3 October SODU 2021 The return of Scottish Open Data Unconference
13 Oct 2021 APUG – Speaker and Topic to be confirmed – Tickets
27-28 November 2021 – #CTC24 – Topic to be announced
Note – all of our planned events are currently being run fully online. Everything we do is free to attend. While tickets for events have a suggested donation of £5 to help with charity running costs, this should not be a barrier to anyone attending.
To get advanced notice of our events, and make sure of a place, why not sign-up for our bi-monthly, spam-free, mailing list?
A guest blog-post by Sara Mazzoli, a post-graduate student at Edinburgh University, who has been interning at Code The City for the last three months. During this project she has worked closely with us and with the Aberdeen City and Aberdeenshire Archives.
Introduction: what is the Register of Returned Convicts?
Historical context, use and description
The Register of Returned Convicts of Aberdeen (1869-1939) is a fascinating, “small-but-chunky” (Astley, 2021) volume contained in the Aberdeen and Aberdeenshire Archives, comprising a total of 279 entries. It is located in the Grampian police collection of the Archives. Out of these entries, about sixty feature mug shots – which can be seen here.
As suggested by the register’s title, the register was used to take note of convicts’ addresses upon release. In fact, Phil Astley – Aberdeen’s Archivist – explained to us that this register contains information on convicts that were sentenced to Penal Servitude (often noted in the register as P.S.).
The Penal Servitude Act, enforced in 1857, was meant to substitute transportation with a prison sentence. This specific sentence consisted of three parts: solitary confinement; labour and release on licence. This latter element meant that individuals sentenced to P.S. had to report monthly to the police during their licence time. Also, they had to report any change in address within 48 hours.
A typical page of the Register looks like this:
As it can be seen, at the top of each page of the register, information was noted on convicts’ physical traits and age upon release, as well as conviction and sentence. In the “Marks” section, anything noteworthy – such as tattoos, scars, deformities and moles – was written down. In fact, according to Phil Astley the industrialisation process determined a high incidence of accidents in factories. Therefore, disfigurements were common amongst workers.
At the bottom half of the page, the register featured information on the convicts’ addresses after their sentence ended. Most of the addresses of the people noted in the register were in Aberdeen. However, some also moved to nearby towns and villages – such as Dundee – or to bigger cities, such as Edinburgh and Glasgow.
Moreover, Phil suggested that there are other two particular acts that shaped the register.
The Habitual Offenders Act 1869.
The Prevention of Crimes Act of 1871. This act
Simply put, these two acts tightened former criminals’ liberties, and enhanced police monitoring of these individuals. These laws were in fact especially crafted to fight habitual criminals (Radzinowicz and Hood, 1980): with increasing urbanization, authorities were concerned with what they labelled as “criminal classes”, an expression by which they referred to individuals who mainly lived through criminal activities. The Register can ultimately be understood as an example of the attempt to monitor the movements of these repeat offenders.
The mugshots and the “habitual criminal”
The camera was developed in the first half of the Nineteenth century, and was initially seen as a tool to represent bodies in a realistic manner. Indeed, photography was depicted as an objective and neutral representation of reality, and therefore authorities started using this tool for law enforcement since the 1840s: “Given its material features and its cultural value as an objective form of representation, the camera provided the perfect tool for the documentation, classification, and regulation of the body within the carceral network” (Finn, 2009, p. 29).
Indeed, at first, as the concept of “mug shot” was developing, photos of individuals in the Register lacked a unique formatting, which started to appear in the 1890s. Indeed, as claimed by Finn (2009), mug shots developed from the Nineteenth-century portrait. These portraits featured an individual sitting, with no facial expression, and were usually taken from the front. As it can be seen, the first few mug shots look more like portraits compared to the later ones. For example:
Fig 1: two mug shots from the Register of the Returned Convicts (1869-1939). The first one, depicts Ann Mc Govern, released in 1872. The second one is the mug shot of John Proctor, discharged in 1893.
According to Holligan and Maitra (2018, p. 173), mug shots were established and developed in a milieu of “pessimism about classes of society”. Moreover, the development of criminal anthropology led to a more wide-spread use of photography in carceral settings. Scholars of this field of studies, such as Cesare Lombroso, believed that certain physical characteristics could yield the identification of criminals. The believed objectivity of photography meant that mug shots could further inform these studies; as characteristics found in mugshots could be analysed by criminal anthropologists. At the same time, the popularity of criminal anthropology led this field of studies also to shape law enforcement practices; first and foremost, by shaping the practices of mug shots taking and of noting distinguishing marks.
Specifically, mug shots were introduced in the UK thanks to the above-mentioned Prevention of Crimes Act of 1871: “Under the section 7 of the Prevention of Crime Act 1871 it was recommended that convicted prisoners be photographed before release, full and side face,measurements in millimetres and feet and inches to be made of length and width of head, and lengths of arms,feet and left middle finger including the papillary ridges of the ten fingers as well as distinctive marks by position on body” (Holligan & Maitra, 2018, p. 177). Indeed, Holligan and Maitra (2018) contend that the development of criminal anthropology led to the belief that “habitual criminals” could be identified by some specific marks; such as the length of imbs. Some of these marks were collected and published by the British Registry of Distinctive Marks, which regulated and influenced the ways in which authorities saw and noted distinguishing marks on prisoners.
Ultimately, we aim to argue that this Victorian construction of crime and of the criminal influenced the way in which the register is composed as well, and that the meaning of “crime” and “criminal” are dictated by moral and social standards. Indeed, many were arrested due to charges of Theft “Habit & Repute” which, according to Dr. Darby, means considering someone’s as having a “bad character, a bad name for theft specifically, and that other witnesses considered him a bad person”. Analysing the register means considering those social rules that shaped the way in which the register is written.
It is in our opinion fundamental to acknowledge such dimensions of the register as we open its data. It is in fact important to recognize that “Registers are political” (Ziegler, 2020), and that therefore the categories of the register are constructed. However, it must also be acknowledged that their construction does not make these categories any less impactful on individuals’ lives. Indeed, this is why we embrace attempts such as that of Phil, who tried to retrieve the humanity of the individuals in the register by associating their mug shots to stories; as we shall argue in the next paragraph.
Why this project is important: how did everything start?
Phil Astley explained that the interest in the register was built up during the 2019 and 2020 Granite Noir festival exhibitions, to which the Archives provided 19th century wanted posters, photos of 1930s crime scenes, as well as mug shots contained in the Register.
Indeed, the mug shots had attracted a positive response, and Phil started the Criminal Portraits blog, in which he started exploring the stories of returned convicts whose mug shots are contained in the register. Therefore, Phil has published more than 50 blog posts, drawing on heterogeneous sources, such as newspapers of the time and censuses. The blog has attracted more than 20 thousand views.
In discussing the plans for this project with Phil and Ian Watt of Code The City we agreed that opening up the data contained in the register – making it available as Open Data – would have social and other benefits.
According to the Open Data Handbook, open data is data that can be easily available and re-usable by anyone. There are many values pertaining to open data. Indeed, it can allow for more transparency, and therefore institutions’ or organizations’ accountability. Moreover, it can also prompt economic participation and investment by private companies. Finally, open data can enable citizen participation and engagement, as it is with this project.
In this specific case, we decided to open data from the register precisely because of the public interest it attracted. Not only is the life of the individuals contained in the register fascinating in itself, but we would argue that opening up this data has also a greater social value. For example, it would allow for individuals with a genealogical interest to find out more about their possible ancestors; or it could be useful for researchers who are carrying out their work on criminality in Scotland.
In any case, opening up data from the Archives could lead to more interest towards their rich collections, as well as to a more thorough understanding of these collections’ communal utility.
It was agreed that we would use Wikidata as the place to host the data, given Code The City’s and Ian’s knowledge of, and enthusiasm, for this platform.
How we made the data available
In the second part of this blog we will detail how we transcribed the data, prepared it for Wikidata, uploaded it in bulk, published mugshot photos and linked those.
Finn, J. M. (2009). Capturing the criminal image: From mug shot to surveillance society. U of Minnesota Press.
McLean, R., Maitra, D. E. V., & Holligan, C. (2017). Voices of quiet desistance in UK prisons: Exploring emergence of new identities under desistance constraint. The Howard journal of crime and justice, 56(4), 437-453
Open Knowledge Foundation. (n.d.). Open Definition: Defining Open in Open Data, Open Content and Open Knowledge. Retrieved from Open Knowledge Foundation: https://opendefinition.org/od/2.1/en/
Radzinowicz, L., & Hood, R. (1980). Incapacitating the habitual criminal: The English experience. Michigan Law Review, 78(8), 1305-1389.
Ziegler, S. L. (2020). Open Data in Cultural Heritage Institutions: Can We Be Better Than Data Brokers?. Digital Humanities Quarterl, 14(2).
CTC23 – the future of the City. A new theme to explore. After introductions, initial ideas were sought for the Miro board – to ease us along Bruce put on some Jazz music. This was to inspire Dimi to put forward an idea on how sounds in a City could be. This post-its gathered interest and the Social Sounds project and team was formed.
Dimi shared his vision and existing knowledge on sound projects, namely, Luckas Martinelli project This would become the algorithmic starting point visualising sound data on a map. The first goal was to using this model and apply it and visualise a sound map of Aberdeen. This was achieved over the weekend but was only half of the visualisation goals. The other half was to look build a set of tools that would allow communities to envision and demonstrate noise pollution reductions through interventions, green walls, trees plantings or even popup band stands. An early proof of concept toolkit was produced. The social in social sounds references to community, connecting all those connected by sound and place. The product concluded by show how this social graph could be export to a decision making platform e.g.loomio.org
What is next? The algorithmic model needs to be ground with real world sound sensor data. Air quality devices in Aberdeen can be upgraded with a microphone. Also, noise itself needs to be included in the map experience, this can be achieved through a sound plug in of existing recordings. The toolkit needs much more work, it needs to give members of the community the ability to add their own intervention ideas and for those ideas to be visualised on the map, highlight the noise reduction potential or enhancement, permanent or temporary. Much achieved, much to do.
Open data has the power to bring about economic, social, environmental, and other benefits for everyone. It should be the fuel of innovation and entrepreneurship, and provide trust and transparency in government.
But there are barriers to delivering those benefits. These include:
Knowing who publishes data, and where,
Knowing what data is being published – and when that happens, and
Knowing under what licence (how) the data is made available, so that you can use it, or join it together with other agencies’ data.
In a perfect world we’d have local and national portals publishing or sign-posting data that we all could use. These portals would be easy to use, rich with metadata and would use open standards at their core. And they would be federated so that data and metadata added at any level could be found further up the tree. They’d use common data schemas with a fixed vocabulary which would be used as a standard across the public sector. There would be unique identifiers for all identifiable things, and these would be used without exception.
You could start at your child’s school’s open data presence and get an open data timetable of events, or its own-published data on air quality in the vicinity of the school (and the computing science teacher would be using that data in classes). You could move up to a web presence at the city or shire level and find the same school data alongside other schools’ data; and an aggregation or comparison of each of their data. That council would publish the budget that they spend on each school in the area, and how it is spent. It would provide all of the local authority’s schools’ catchment areas or other LA-level education-specific data sets. And if you went up to a national level you’d see all of that data gathered upwards: and see all Scottish Schools and also see the national data such as SQA results, school inspection reports – all as open data.
But this is Scotland and it’s only six years since the Scottish Government published a national Open Data Strategy; one which committed data publication would be open by default.
Looking at the lowest units – the 32 local authorities – only 10, or less than a third, even have any open data. Beyond local government, of the fourteen health boards none publishes open data, and we note that of the thirty Health and Social Care Partnerships onlyone has open data. Further, in 2020 it was found that of an assumed 147 business units comprising Scottish Government (just try getting data of what comprises what is in the Scottish Government) – 120 have published no data.
And, of course there are no regional or national open data portals. Why would Scottish Government bother? Apart, that is, from that six year old national strategy and an EU report in 2020 from which it was clear that OD done well would benefit the Scottish economy by around £2.21bn per annum? Both of these are referred to in the Digital Strategy for Scotland 2021.
Why there is no national clamour around this is baffling.
And despite there being a clear remit at Scottish Government for implementing the OD Strategy no-one, we are told, measures or counts the performance nationally. Because if you were doing this poorly, you’d want to hide that too, wouldn’t you?
And, for now, there is no national portal. There isn’t even one for the seven cities, let alone all 32 councils. Which means there is
no facility to aggregate open data on, say, planning, across all 32 councils.
no way to download all of the bits of the national cycle paths from their custodians.
no way to find out how much each spends on taxis etc or the amount per pupil per school meal.
There is, of course, the Spatial Hub for Scotland, the very business model of which is designed (as a perfect example of the law of unintended consequences) to stifle the publication of open data by local government.
So, if we don’t have these things, what do we have?
What might we expect?
What should we expect from our councils – or even our cities?
Remember, back about 2013 , both Aberdeen and Edinburgh councils received funding from Nesta Scotland to be part of Code For Europe where they learned from those cities above. One might have expected that by now they’d have reached the same publication levels as these great European cities by now? We’ll see soon.
But let’s be generous. Assume that each local authority in Scotland could produce somewhere between 100 and 200 open data sets.
Scotland has 32 local authorities
Each should be able to produce 100 – 200 datasets per authority – say 150 average
= 150 x 32 = 4800 data sets.
The status quo
Over the weekend our aim was to look in detail at each of Scotland’s 32 local authorities and see which was publishing their data openly – to conform with the 2015 Open Data Strategy for Scotland. What did we find?
Our approach
As we’ve noted above there is no national portal. And no-one in Scottish Government is counting or publishing this data. So, following the good old adage, “if you want something done, do it yourself”, a few of us set about trying to pull together a list of all the open datasets for Scotland’s 7 cities and the other 25 authorities. For the naive amongst us, it sounded like an easy thing to do. But getting started even became problematic. Why?
Only some councils had any open data – but which?
Only some of those had a landing page for Open Data. Some had a portal. Some used their GIS systems.
Those that did provide data used different categories. There was no standardised schema.
For others, some had a landing page but then additional datasets were being found elsewhere on their websites
Contradictory licence references on pages – was it open or not?
We also looked to see if there was already a central hub of sorts upon which we could build. We found reference to Open Data on Scottish Cities Alliance website but couldn’t find any links to open data.
Curiosity then came into play, why were some councils prepared to publish some data and others so reluctant? What was causing the reluctancy? And for those publishing, why were all datasets not made open, what was the reason for selecting the ones they had chosen?
What we did
Our starting point was to create a file to allow us to log the source of data found. As a group, we decided upon headers in the file, such as the type of file, the date last updated to name but a few.
From previous CTC events which we attended we knew that Ian had put a lot of effort previously into creating a list of council datasets – IW’s work of 2019 and 2020which became our starting source. We also knew that Glasgow and Edinburgh were famous for having large, but very out of date, open data portals which were at some point simply switched off.
We were also made aware of another previous attempt from the end of 2020 to map out the cities’ open data. The screenshot below (Fig 1) is from a PDF by Frank Kelly of DDI Edinburgh which compared datasets across cities in Scotland. You can view the full file here.
Fig 1 From an analysis of Scottish Cities’s open data by Frank Kelly of DDI Edinburgh, late 2020 or early 2021
For some councils, we were able to pull in a list of datasets using the CKAN API. That worked best of all with a quick bit of scripting to gather the info we needed. If all cities, and other authorities did the same we’d have cracked it all in a few hours! But it appears that there is no joined up thinking, no sharing of best practices, no pooling of resources at play in Scotland. Surely COSLA, SCA, SOCITM and other groups could get their heads together and tackle this?
For others there were varying degrees of friction. We could use the arcGIS API to gather a list of data sets. But the arcGIS API tied us up in knots trying to get past the sign in process, i.e. did we need an account or could we use it anonymously – it was difficult to tell. Luckily with an experienced coder in our team we were able to make calls to the API and get responses – even if these were verbose and needed manual processing afterwards. This post from Terence Eden “What’s your API’s “Time To 200”?” is really relevant here!
For the rest it was a manual process of going into each city/council website and listing files. With three of us working on it for several hours. We succeeded in pulling together the datasets from the different sources into our csv file.
One council trying to publish open data but the quality, and the up-to-date-ness was questionable
Ultimately, the sources were so varied and difficult to navigate that it took 5 digitally-skilled individuals a full day, that is 30 man-hours, to pull this data together. Yet if we have missed any, as we are sure to have done, it may be because they have moved or are hidden away. Let us know if there are more.
From this output it became clear that there was no consistency in the types of files in which the data was being provided and no consistency in the refresh frequency. This makes it difficult to see a comprehensive view in a particular subject across Scotland (because there are huge gaps) and makes it difficult for someone not well versed in data manipulation to aggregate datasets, hence reducing usability and accessibility. After all, we want everyone to be able to use the data and not put barriers in the way.
We have a list, now what
We now had a list of datasets in a csv file, so it was time to work on understanding what was in it. Using Python in Jupyter Notebooks, graphs were used to analyse the available datasets by file type, the councils which provided it, and how the data is accessed. This made it clear that even among the few councils which provide any data, there is a huge variation in how they do that. There is so much to say about the findings of this analysis, that we are going to follow it up with a blog post of its own.
Unique Datasets by CouncilUnique dattes by council and filetypeAverage filetypes provided for each data set by Council
One of our team also worked on creating a webpage (not currently publicly-accessible) to show the data listings and the graphs from the analysis. It also includes a progress bar to show the number of datasets found against an estimated number of datasets which could be made available – this figure was arbitrary but based on a modest expectation of what any local authority could produce. As you saw above, we set this figure much lower than we see from major cities on the continent.
What did we hope to achieve?
A one stop location where links to all council datasets could be found.
Consistent categories and tags such that datasets containing similar datasets could be found together.
But importantly we wanted to take action – no need for plans and strategies, instead we took the first step.
What next?
As we noted at the start of this blog post, Scotland’s approach Open Data is not working. There is a widely-ignored national strategy. There is no responsibility for delivery, no measure of ongoing progress, no penalty for doing nothing and some initiatives which actually work against the drive to get data open.
Despite the recognised economic value of open data – which is highlighted in the 2021 Digital Strategy but was also a driver for the 2015 strategy! – we still have those in government asking why they should publish and looking specifically to Scotland (a failed state for OD) for success stories rather than overseas.
We’ve seen closed APIs being, we assume, to try to measure use. We suspect the thinking goes something like this:
A common circular argument
In order for open data to be a success in Scotland we need it to be useful, usable, and used.
Useful
That means the data needs to be geared towards those who will be using it: students, lecturers, developers, entrepreneurs, data journalists, infomediaries. Think of the campaign in 2020 led by Ian to get Scottish Government to publish Covid data as open data, and what has been made of it by Travelling Tabby and others to turn raw data into something of use to the public.
Usable
The data needs to be findable, accessible, and well structured. It needs to follow common standards for data and the metadata. Publishers need to collaborate – coordinate data releases across all cities, all local authorities. ‘Things’ in the data need to use common identifiers across data sets so that they can be joined together, but the data needs to be usable by humans too.
Used
The data will only be used if the foregoing conditions are met. But government needs to do much more to stimulate its use: to encourage, advertise, train, fund, and invest in potential users.
The potential GDP rewards for Scotland are huge (est £2.21bn per annum) if done well. But that will not happen by chance. If the same lacklustre, uninterested, unimaginative mindsets are allowed to persist; and no coordination applied to cities and other authorities, then we’ll see no more progress in the next six years than we’ve seen in the last.
While the OGP process is useful, bringing a transparency lens to government, it is too limited. Government needs to see this as an economic issue as is the case, and one which the current hands-off approach is failing. We also need civic society to get behind this, be active, visible, militant and hold government to account. What we’ve seen so far from civic society is at best complacent apathy.
Scotland could be great at this – but the signs, so far, are far from encouraging!
Team OD Bods (Karen, Pauline, Rob, Jack, Stephen and Ian)
At Code The City 22 we started Meet Your Next MSP, a project to list hustings for the Scottish Parliamentary election. The team comprised of James Baster and Johnny Mckenzie.
James Baster had prior experience working on a similar project for the UK general election in 2015, where they listed over 1000 events in a project that was cited by many charities and campaigns. This showed him that there was interest in such a project. It also showed that many people don’t even know what a hustings areis, so the project deliberately tries to be accessible in order to introduce others to these type of events.
Thanks to Johnny who wrangled data from National Records of Scotland to make a dataset that mapped postcodes to areas; vital for powering the postcode lookup box on the home page of the site.
Storing data in a git repository is an interesting approach; it has some drawbacks but some advantages (moderation by pull requests and a full history for free). Crucially, it’s not a new idea and is something many people already do so it will be interesting to learn more about this approach.
Since the hackathon, the website has been tweaked, the Google form replaced with a better custom form and the website is now live!
We will run this over the next month and see how this goes.
And after the general election, the lessons won’t be lost. What we are essentially building are tools that let a community of people list events of interest together, with the data stored in a git repository. We think this tool could be applicable to many different situations.
The public have access to two free, easy accessible waste recycling and disposal methods. The first is “kerbside collection” where a bin lorry will drive close to almost every abode in the UK and crews will (in a variety of different ways) empty the various bins, receptacles, boxes and bags. The second is access to recycling centres, officially named Household Waste Recycling Centres (HWRCs) but more commonly known as the tip or the dump. These HWRCs are owned by councils or local authorities and the information about these is available on local government websites.
However, knowledge about this second option: the tips, the dumps, the HWRCs, is limited. One of the reasons for that is poor standardisation. Council A will label, map, or describe a centre one way; Council B will do it in a different way. There is a lot of perceived knowledge – “well everybody just looks at their council’s website, and everybody knows you can only use your council’s centres”. This is why at CTC22 we wanted to get all the data about HWRCs into a standard set format, and release it into the open for communities to keep it present and up to date. Then we’d use that data to produce a modern UI so that residents can actually get the information they require:
Which tips they can use?
When these dumps are open?
What can they take to these HWRCs?
“I have item x – where can I dispose of it?”
Our approach
There were six main tasks to complete:
Get together a list of all the HWRCs in the UK
Build an open data community page to be the centre point
Bulk upload the HWRCs’ data to WikiData
Manually enter the HWRCs into OpenStreetMap
Create a website to show all the data
Create a connection with OpenStreetMap so that users could use the website to update OSM.
What we built / did
All HWRCs are regulated by a nation’s environmental regulator:
For Scotland it is SEPA
For Northern Ireland it is NIEA
For Wales it is NRW
For England it is EA
A list of over 1,000 centres was collated from these four agencies. The data was of variable quality and inconsistent.
This information was added to a wiki page on Open Street Map – Household waste in the United Kingdom, along with some definitions to help the community navigate the overly complex nature of the waste industry.
From that the lists for Scotland, Wales and England were bulk uploaded to WikiData. The was achieved by processing the data in Jupiter Notebooks, from which formatted data was exported to be bulk uploaded via the Quick Statements tool. The NIEA dataset did not include geolocation information so future investigation will need to be done to add these before these too can be uploaded. A Wikidata query has been created to show progress on a map. At the time of writing 922 HWRCs are now in Wikidata.
Then the never-ending task of locating, updating, and committing the changes of each of the OSM locations was started.
To represent this data the team built a front-end UI with .NET Core and Leaflet.js that used Overpass Turbo to query OSM. Local Authority geolocation polygons were added to highlight the sites that a member of the public could access. By further querying the accepted waste streams the website is able to indicate which of those centres they can visit can accept the items they are wanting to recycle.
However, the tool is only as good as the data so to close the loop we added a “suggest a change” button that allowed users to post a note on that location on OpenStreetMap so the wider community can update that data.
We named the website OpenWasteMap and released it into the wild.
The github repo from CTC22 is open and available to access.
What we will do next (or would do with more time/ funding etc)
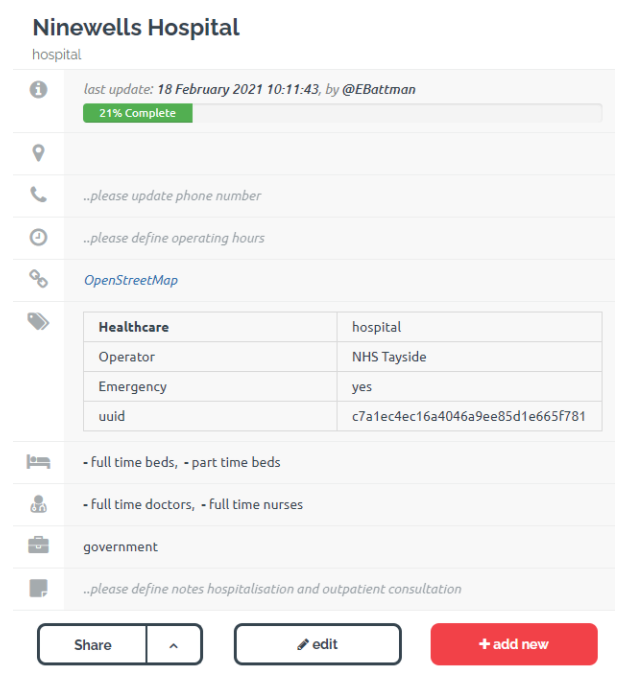
The next task is to get all the data up-to-date and to keep it up to date; we are confident that we can do this because of the wonderful open data community. It would also be great if we could improve the current interface on the frontend for users to edit existing waste sites. Adding a single note to a map when suggesting a change could be replaced with an edit form with a list of fields we would like to see populated for HWRCs. Existing examples of excellent editing interfaces in the wild include healthsites.io which provides an element of gamification and completionism with a progress bar with how much data is populated for a particular location.
While working through the council websites it has become an issue that there is no standard set of terms for household items, and the list is not machine friendly. For example, a household fridge can be called:
Fridge
Fridge Freezer
WEEE
Large Domestic Electrical Appliance
Electric Appliance
White Good
A “fun” next task would be to come up with a taxonomy of terms that allows easier classification and understanding for both the user and the machine. Part of this would include matching “human readable” names to relevant OpenStreetMap tags. For example “glass” as an OSM tag would be “recycling:glass”
There are other waste sites that the public can used called Bring Banks / Recycling Points that are not run by Local Authorities that are more informal locations for recycling – these too should be added but there needs to be some consideration on how this information is maintained as their number could be tenfold that of HWRCs.
As we look into the future we must also anticipate the volume of data we may be able to get out of sources like OpenStreetMap and WikiData once well populated by the community. Starting out with a response time of mere milliseconds when querying a dozen points you created in a hackathon is a great start; but as a project grows the data size can spiral into megabytes and response times into seconds. With around 1,000 recycling centres in the UK and thousands more of the aforementioned Bring Banks this could be a lot of data to handle and serve up to the public in a presentable manner.