
- Journal List
- Int J Epidemiol
- PMC2734063
Multi-country analysis of the effects of diarrhoea on childhood stunting
William Checkley
1 Department of International Health, The Johns Hopkins University, Bloomberg School of Public Health, Baltimore, MD, USA.
Gillian Buckley
1 Department of International Health, The Johns Hopkins University, Bloomberg School of Public Health, Baltimore, MD, USA.
Robert H Gilman
1 Department of International Health, The Johns Hopkins University, Bloomberg School of Public Health, Baltimore, MD, USA.
Ana MO Assis
2 School of Nutrition, Federal University of Bahia in Salvador, Bahia, Brazil.
Richard L Guerrant
3 Department of Medicine, Center for Global Health, Division of Infectious Diseases and International Medicine, University of Virginia, Charlottesville, VA, USA.
Saul S Morris
4 London School of Hygiene & Tropical Medicine (honorary), London, UK.
Kåre Mølbak
5 Department of Epidemiology Research, Danish Epidemiology Science Centre, Statens Serum Institut, Copenhagen, Denmark.
Palle Valentiner-Branth
5 Department of Epidemiology Research, Danish Epidemiology Science Centre, Statens Serum Institut, Copenhagen, Denmark.
6 Bandim Health Project, Bissau, Guinea-Bissau.
Claudio F Lanata
7 Instituto de Investigación Nutricional, Lima, Perú.
Robert E Black
1 Department of International Health, The Johns Hopkins University, Bloomberg School of Public Health, Baltimore, MD, USA.
Abstract
Diarrhoea is an important cause of death and illness among children in developing countries; however, it remains controversial as to whether diarrhoea leads to stunting. We conducted a pooled analysis of nine studies that collected daily diarrhoea morbidity and longitudinal anthropometry to determine the effects of the longitudinal history of diarrhoea prior to 24 months on stunting at age 24 months. Data covered a 20-year period and five countries. We used logistic regression to model the effect of diarrhoea on stunting. The prevalence of stunting at age 24 months varied by study (range 21–90%), as did the longitudinal history of diarrhoea prior to 24 months (incidence range 3.6–13.4 episodes per child-year, prevalence range 2.4–16.3%). The effect of diarrhoea on stunting, however, was similar across studies. The odds of stunting at age 24 months increased multiplicatively with each diarrhoeal episode and with each day of diarrhoea before 24 months (all P < 0.001). The adjusted odds of stunting increased by 1.13 for every five episodes (95% CI 1.07–1.19), and by 1.16 for every 5% unit increase in longitudinal prevalence (95% CI 1.07–1.25). In this assembled sample of 24-month-old children, the proportion of stunting attributed to ≥5 diarrhoeal episodes before 24 months was 25% (95% CI 8–38%) and that attributed to being ill with diarrhoea for ≥2% of the time before 24 months was 18% (95% CI 1–31%). These observations are consistent with the hypothesis that a higher cumulative burden of diarrhoea increases the risk of stunting.
Introduction
The bidirectional relationship between diarrhoea and malnutrition has been one of the most extensively investigated topics in medical research ever since Scrimshaw and colleagues postulated an interaction between infection and nutrition nearly 40 years ago.1 While it is generally accepted that poor nutritional status, as assessed by anthropometric measurements, leads to a greater risk of diarrhoea,2–9 there is less agreement on whether repeated episodes of diarrhoea adversely affect a child's growth.10–13 Reasons for this lack of agreement include: the complexity of nutritional and metabolic responses to diarrhoeal illness; heterogeneity in the etiology and in the prevalence of diarrhoea across study populations; lack of standard definitions; diversity of geographical and cultural settings; and, methodological differences in study design and in the analysis of longitudinal data. Therefore, epidemiological research into the effects of diarrhoea on growth has been especially challenging.
Standardization helped to address some of these methodological challenges. In 1977, Waterlow and colleagues14 recommended the use of Z-scores for reporting anthropometry against an international reference. Consensus on an epidemiological definition for childhood diarrhoea was not achieved until later, in the early 1990s.15,16 It is now generally agreed that diarrhoea is present when there are three or more loose stools in a day; and, in defining a diarrhoeal episode, it is agreed that there must be at least 2 or 3 consecutive days free of diarrhoea between episodes.15,16 The development of a standard definition for diarrhoea was particularly useful to help quantify the global burden of disease, and it has provided a standard for epidemiological studies.
On the other hand, there is a lack of consensus on how to best analyse the effects of diarrhoea on a child's nutritional status. Early studies reported decreased weight gain and linear growth following diarrhoea when the effects of diarrhoea on growth were analysed in 1 or 2 month intervals. Some investigators argue, however, that these studies may have overestimated growth deficits associated with diarrhoea because short intervals do not allow time for catch-up growth to occur.11 For example, one group of investigators reported that, in Bangladesh, the effect of diarrhoea appeared to be transient because children recovered from their growth deficits.17 These investigators suggested that children in developing countries were malnourished because of inadequate food intake and not because of a high burden of diarrhoea. Other investigators have reported similar findings.18,19 Therefore, it follows that any meaningful analysis of the effects of diarrhoea on growth should account for the entire history of diarrhoeal exposures. The importance of disease control as a means to reduce the burden of malnutrition in underprivileged children of developing countries lies at the heart of this controversy. Child malnutrition is a major contributor to the burden of disease in developing countries. For this reason, a better understanding of the relationship between diarrhoea and stunting will help define the role of disease control programmes in the prevention of childhood stunting.
Published studies that account for the entire history of diarrhoeal illness are scarce in part because of the challenges involved in adequately summarizing the entire history of diarrhoeal exposures in a longitudinal analysis. Some investigators have, therefore, proposed using the ‘longitudinal prevalence of diarrhoea’ as a summary measure of the cumulative burden over time.20 More recent investigations that use the longitudinal history of diarrhoea to model growth effects have reported that diarrhoea may result in both transient growth deficits and in delayed and cumulative effects resulting in permanent growth deficits later in life.21,22 Although multiple diarrhoeal episodes appear to linearly ablate the process of catch-up growth,12,21 these observations were obtained from single-site studies. In this context, the purpose of this study was to obtain a summary estimate of the effect of longitudinal history of diarrhoea in the first 24 months on the prevalence of stunting at 24 months of age by pooling data collected in multiple countries.
Methods
This analysis pooled longitudinal information from nine prospective studies that enrolled participants at or near birth and followed them with regular anthropometric measurements and daily records for diarrhoeal surveillance (Table 1). Details of the field methods of each study were published elsewhere.21,23–30 We aimed to combine multiple cohorts using original data from studies that collected longitudinal information on diarrhoea and growth. We used our literature search to guide us in identifying groups of investigators. Our PubMed search terms were ‘diarrhea’ AND ‘growth’ AND ‘longitudinal’ with the following limits: humans, English, Spanish, all infant (birth 23 months) and preschool children (2–5 years). This search identified 89 articles. We then searched for potential studies among the cited references. We selected studies that enrolled children in the first year of life, collected daily records for diarrhoeal surveillance and performed at least three anthropometric assessments. We excluded studies of HIV-infected children. This was not a systematic review, however, because we used expert opinion among the selected articles to identify groups of investigators with considerable experience in conducting longitudinal studies of diarrhoea and growth. We identified 14 investigators from this search, contacted them by electronic mail or telephone and obtained complete data for nine longitudinal studies. One investigator did not wish to participate, two investigators no longer had access to the original data, one investigator provided incomplete data and one investigator provided us with complete data, but we were unable to use this study because it had only two anthropometric assessments and it conducted diarrhoeal surveillance over a 2-week period only. Each study measured height in children at regular time intervals ranging from once monthly to every 4 months.
Table 1
Summary of nine studies included in a pooled analysis of the effect of diarrhoea on stunting at 24 months of age
| Year | Setting | Design | Purpose | Participants |
|---|---|---|---|---|
| 1978–79 | Matlab, Bangladesh25 (Rural) | Observational cohort | Effects of diarrhoea on growth | 197 |
| 1985–87 | Lima, Peru27 (Urban) | Observational cohort | Effects of diarrhoea on growth | 167 |
| 1987–90 | Bandim, Guinea-Bissau28 (Urban) | Observational cohort | Identify risk-factors for diarrhoea in Africa | 1165 |
| 1989–93 | Fortaleza, Brazil24 (Urban) | Observational cohort | Effects of diarrhoea on growth | 119 |
| 1989–91 | Lima, Peru26 (Urban) | Observational cohort | Effects of diarrhoea on growth | 217 |
| 1990–91 | Serrinha, Brazil23 (Urban) | Field trial | Effects of vitamin A on morbidity | 487a |
| 1990–91 | Ghana30 (Rural) | Field trial | Effects of vitamin A supplementation on morbidity | 1857 |
| 1994–97 | Bandim, Guinea-Bissau29 (Urban) | Nested randomized trial in an observational cohort | Effects of dietary management of diarrhoea on growth | 1060 |
| 1995–98 | Lima, Peru21 (Urban) | Observational cohort | Effects of diarrhoea on growth | 224 |
a(controls).
Data management
We requested three separate sets of de-identified data from each participating investigator. For the serial anthropometrics, we requested a data file with the child's identification code, the date of measurement, weight in kilograms, length or height in centimetres, sex and the child's date of birth. For the daily records of diarrhoeal surveillance, we requested a data file with the date, the number of liquid and semi-liquid stools in that day or, alternatively, if the number of liquid and semi-liquid stools was not available then we requested investigators to provide maternal reporting of whether the child had diarrhoea or not without any further definition being required. For baseline information, we requested a data file with the number of years of maternal education, a measure of household sanitation, the number of people in the house and if available a measure of household income or a measure of household goods and services. We asked investigators to include other determinants of socioeconomic status (SES) in their community.
We used data from children who had at least three height measurements and a recorded date of birth. We excluded measurements with a height-for-age Z-scores (HAZ) >4 and those with a HAZ <−7. We chose a HAZ <−7 as the lower cut-off because at least one quarter of children from the ‘Bangladesh 1978’ study had a HAZ <−4.
Socioeconomic status
All investigators collected socioeconomic data at baseline. Contributing investigators reported on the socioeconomic variables that were important in each study in published papers or by personal communication. All studies were conducted in rural or poor urban communities. Nonetheless, given that these studies were conducted in different countries with different cultural settings, different socioeconomic indicators and using different questionnaires, we created an aggregate SES variable.
We used a combination of variables to construct the aggregate SES variable for each study. For ‘Brazil 1990’, we used a composite index based on the possession of household goods and services,23 maternal education and sanitation. For ‘Brazil 1989’, we used sanitation and household crowding.24 For ‘Bangladesh 1978’, we used maternal education, water source and household crowding.25 For ‘Peru 1995’, we used maternal educational, sanitation and household income.21 For ‘Peru 1985’, we used maternal education, sanitation and household crowding.27 For ‘Guinea-Bissau 1987’ study, we used maternal education, sanitation and household crowding.28 For ‘Guinea-Bissau 1994’, we used maternal education, household crowding and having a zinc roof.29 For ‘Ghana 1990’, we used maternal education, crowding and having a zinc roof.30 Socioeconomic data were not available for ‘Peru 1989’.26
Once we identified the above socioeconomic variables, we created rank scores for each of these variables. We used these rank scores to create an aggregate SES score, and stratified this aggregate score into low, intermediate and high categories (Appendix 1).
Definitions
We calculated HAZ by comparing length or height with the 2006 World Health Organization (WHO) international growth reference.31 We used an algorithm provided by the WHO in Stata 9 (StataCorp, College Station, TX) to calculate HAZ. We defined stunting as a HAZ less than or equal to 2 SD below the mean of the reference population (i.e., HAZ ≤−2).
The international consensus definition for a day of diarrhoea is three or more liquid or semi-liquid stools in a day.15,16 Contributing investigators generally used this definition, although one study defined diarrhoea as four or more liquid stools per day,25 and three relied solely on mother's report of diarrhoea.28–30 Another study defined the onset of a diarrhoeal episode as three or more liquid or semi-liquid stools in a day and when the mother indicated that the child had diarrhoea.21 We used each investigators definition for a day of diarrhoea, but used a standard definition for an episode of diarrhoea for all studies, i.e. we defined the first day of a diarrhoeal episode as the onset of diarrhoea; and, defined the end of a diarrhoeal episode as the last day of diarrhoea that was followed by two consecutive days without diarrhoea.
We calculated the cumulative diarrhoeal incidence per child-year as the number of diarrhoeal episodes divided by the number of days at risk over a specified time period and multiplied by 365. We calculated days at risk for diarrhoea as the total days of follow-up minus the days of diarrhoea but for the first day of an episode. We calculated the longitudinal prevalence of diarrhoea as the sum of the duration of all diarrhoeal episodes over a specified time period divided by the total number of follow-up days over that same time period and multiplied by 100.
Reversibility of stunting
Stunting may be reversed over time. While the epidemiological definition of stunting is clearly established, there is no standard epidemiological definition for reversibility of stunting. A small change in HAZ between two points in time may be incorrectly defined as reversibility of stunting. For example, a change in HAZ from −2.01 to −1.99 between two time periods can be hardly considered recovery. Reversibility of stunting can also be affected by regression to the mean.32 To address these concerns, we defined recovery from stunting between ages t1 and 24 months for a child who was stunted at t1 months but not stunted at 24 months and for whom HAZ24 > r × HAZt1, where HAZ24 was the child's HAZ at 24 months, HAZt1 was the child's HAZ at t1 months and r was the correlation coefficient between HAZ24 and HAZt1 for the subset of children who were stunted at t1 months and not stunted at 24 months. That is, we did not include children for whom HAZ24 ≤ r × HAZt1 in the category of those who recovered.
Biostatistical methods
The objective of our analysis was to determine the effect of diarrhoea prior to 24 months of age on stunting at 24 months of age. The primary outcome in our analyses was the prevalence of stunting at 24 months. Because not all children were measured at exactly 24 months of age, we accepted the HAZ measurement at the oldest age in the interval between 18 and 24 months of age as the HAZ measurement at 24 months. We selected 24 months of age as the reporting age for this analysis because the majority (54%) of children from all nine studies contributed data at this age. In contrast, only 45% of children contributed data at 3 years of age and 28% of children contributed data at 5 years of age.
We first conducted exploratory data analysis to determine the shape of the relationship between the cumulative burden of diarrhoea prior to 24 months of age and the log odds of stunting at 24 months. We then used logistic regression to model the prevalence of stunting at 24 months as a function of the cumulative burden of diarrhoea prior to 24 months. In our logistic regression model, the outcome was coded as 1 if a child was stunted at 24 months of age and coded as 0 if otherwise. We included the history of diarrhoea prior to 24 months as a continuous covariate. We required children to contribute at least 250 days of diarrhoeal surveillance to be included in the regression analysis. All studies contributed data on 48 or more children for this analysis.
We constructed our regression model manually (Appendix 2). Because study and sex were important determinants of stunting at 24 months, we modelled the log odds of stunting at 24 months as a function of diarrhoea prior to 24 months, sex and study. In constructing our regression model, we began with three fixed-effects parameters for each study: an intercept, a parameter for the study-specific effect of diarrhoea on stunting and a parameter for the study-specific effect of sex on stunting.
We compared nested models using the likelihood ratio test (LRT) to identify the model with the fewest number of parameters. We used the LRT to determine if we could pool studies to summarize the effect of diarrhoea on stunting. We first compared a regression model with only one parameter to explain the effect of diarrhoea on stunting vs a regression model with study-specific parameters to explain the effect of diarrhoea on stunting. We then compared a regression model with only one intercept vs a regression model with study-specific intercepts, and a regression model with only one parameter for a sex effect on stunting vs a regression model with study-specific parameters for a sex effect on stunting.
We used the Hosmer-Lemeshow test to determine goodness-of-fit in logistic regression.33 We used Pearson residuals and deviance residuals to identify outliers,34 and used Pregibon's delta–beta statistic to identify influential data points.34
In separate regression analyses, we estimated the odds ratio of stunting at 24 months of age by four categories of cumulative diarrhoeal incidence and four categories longitudinal diarrhoeal prevalence prior to 24 months. To calculate attributable risks, we categorized cumulative diarrhoeal incidence before 24 months (<5 episodes and ≥5 episodes) and longitudinal diarrhoeal prevalence before 24 months (<2% and ≥2%) into only two groups that represented a ‘low’ or ‘high’ cumulative burden. We calculated the proportion of stunting at 24 months of age attributed to having a high cumulative burden of diarrhoea prior to 24 months of age using parameter estimates obtained from logistic regression.35
We conducted biostatistical analyses in Stata and R (R Foundation for Statistical Computing, www.r-project.org).
Subset analyses
Fewer children had complete information on the requested socioeconomic variables. To determine whether socioeconomic status confounded the effect of diarrhea on stunting, we conducted a subset analysis using the data of children with complete SES data. To determine if the results of our regression model were affected by the exposure period, we modelled the effects of diarrhea prior to 23 months and the effects of diarrhea prior to 22 months on the prevalence of stunting at 24 months of age. We also conducted various subset analyses to exclude children who were stunted between birth and 6 months of age. Because not all children had an anthropometric measurement before 6 months of age, fewer children and fewer studies were included in these subset analyses. In the subset analyses that excluded children who were stunted at 6 months of age, we included HAZ at 6 months in our regression model. We accepted the HAZ measurement at the oldest date in the interval between 3 and 6 months of age as the HAZ at 6 months.
Results
Descriptive statistics
Of 5493 children who had at least one height measurement in the original datasets submitted by all investigators, a total of 4348 children had at least three measurements and a recorded date of birth. Because this analysis included data over a 20-year period and from five countries, the prevalence of stunting at 24 months was heterogeneous across studies (Figure 1). Nonetheless, the general pattern of change in stunting by age was similar across studies. That is, the prevalence of stunting was low soon after birth; it increased with age and, it had an asymptote around 20 months of age in the majority of studies.

Prevalence of stunting by study as a function of age. Each panel represents a separate study. The y-axis is the prevalence of stunting (%), and the x-axis is age in months. We calculated height-for-age using the 2006 WHO growth reference, and defined stunting as two standard deviations below the growth reference
Of 4348 children, 1393 had a height measurement at 18–24 months and had at least 250 days of diarrhoeal surveillance in the first 24 months of life. Diarrhoea also varied by study (Table 2). Overall, 5.3% (646/12 173) of diarrhoeal episodes lasted 14 days or longer (i.e. persistent diarrhoea). The proportion of diarrhoeal episodes that were persistent varied by study, and ranged from 1.3% to 15.9%. We did not identify a clear relationship between the proportion of diarrhoeal episodes that were persistent before 24 months and stunting at age 24 months.
Table 2
Descriptive statistics by study in the subset of children included in the analysis
| Study | Sample size | Mean age at entry in months (SD) | Median days of follow-up (interquartile range) | Diarrhoeal incidencea (per child-year of surveillance) | Longitudinal diarrhoea prevalencea (percentage of days with diarrhoea) |
|---|---|---|---|---|---|
| Bangladesh 1978 | 48 | 10.81 (3.34) | 333 (291–355) | 6.94 | 13.91 |
| Peru 1985 | 73 | 0.12 (0.18) | 682 (620–723) | 8.96 | 8.50 |
| Guinea-Bissau 1987 | 241 | 5.31 (4.65) | 449 (337–550) | 11.00 | 13.09 |
| Brazil 1989 | 115 | 0.06 (0.16) | 635 (627–643) | 4.91 | 6.34 |
| Peru 1989 | 72 | 1.53 (1.24) | 575 (533–611) | 4.56 | 7.21 |
| Brazil 1990 | 91 | 12.29 (2.75) | 363 (255–365) | 13.42 | 10.78 |
| Ghana 1990 | 123 | 10.49 (2.21) | 354 (301–371) | 9.28 | 16.33 |
| Guinea-Bissau 1994 | 475 | 3.76 (4.04) | 473 (361–567) | 6.20 | 6.54 |
| Peru 1995 | 155 | 0.84 (0.99) | 665 (618–705) | 3.56 | 2.40 |
| Combined | 1393 | 4.49 (4.91) | 500 (360–626) | 6.96 | 8.06 |
aBurden of diarrhoea prior to 24 months of age.
Of the 1393 children included in our analysis, 1004 (72%) had at least one height measurement between birth and 6 months of age. Of these children, 14% (143/1004) were stunted by 6 months of age. A pooled analysis estimating the odds of stunting at 24 months of age required a separate intercept for each study (P < 0.001; LRT), reflecting observed heterogeneity across studies. Sex was an important determinant of stunting, and the association between sex and the prevalence of stunting at 24 months varied substantially across studies (P < 0.001; LRT). Therefore, in our model, we allowed for study-specific parameters describing the effect of sex on stunting.
Effects of cumulative diarrhoeal incidence on stunting
The relationship between cumulative diarrhoeal incidence prior to 24 months and the log odds of stunting at 24 months of age was closely linear (Figure 2a). The effect of cumulative diarrhoeal incidence prior to 24 months on stunting at 24 months was similar among studies (P = 0.409; LRT), meaning that we could pool the effect of diarrhoeal incidence on stunting across studies into a single summary estimate. The adjusted odds of stunting at 24 months increased multiplicatively by a factor of 1.025 (95% CI 1.01–1.04) per episode of diarrhoea prior to 24 months (P < 0.001; LRT). For the purpose of interpretation, we scaled the increase in the odds of stunting at 24 months to an increase of five episodes prior to 24 months (Figure 3). That is, the odds of stunting at 24 months increased by 1.13 when cumulative diarrhoeal incidence increased by five episodes (95% CI 1.07–1.19). The Hosmer-Lemeshow goodness-of-fit test indicated that this model fit the data well (P = 0.786; Chi-square test). Residual analysis did not identify outliers or influential data points.

Relationship between the cumulative burden of diarrhoea prior to 24 months of age and the log odds of stunting at 24 months of age. We calculated the log odds of stunting for these panels as log (yi + 0.5/ni − yi + 0.5) across unit intervals of cumulative diarrhoeal incidence (per episode of child-year) and one percent intervals in the longitudinal prevalence of diarrhoea, where yi represents the number of stunted children at each interval and ni represents the total number of children in that same interval. The size of the circles is proportional to the square root of the number of children in each interval. Panel A: association between diarrhoeal incidence before 24 months and the log odds of stunting at 24 months of age. Panel B: association between longitudinal diarrhoeal prevalence before 24 months and the log odds of stunting at 24 months of age

Effect of diarrhoeal incidence prior to 24 months on stunting at 24 months of age. Point estimates of the effect of diarrhoeal incidence on stunting at 24 months are shown for each study. The size of the square around the point estimate is proportional to sample size. The lines represent 95% CI. In the pooled estimate, represented by a diamond, the odds of stunting at 24 months increased by 1.13 when diarrhoeal incidence prior to 24 months increased by five episodes (95% CI 1.07 to 1.19)
The proportion of diarrhoeal episodes that were persistent prior to 24 months did not confound the effect of cumulative diarrhoeal incidence prior to 24 months on stunting at 24 months of age, and it did not explain the odds of stunting at 24 months of age above and beyond the effect of diarrhoeal incidence prior to 24 months (P = 0.757; Wald test). After controlling for cumulative diarrhoeal incidence, the effect of the proportion of episodes that were persistent prior to 24 months on stunting at 24 months did not vary by study (P = 0.839; LRT).
Figure 4a shows that the odds ratio of stunting at 24 months increased with each category of cumulative diarrhoeal incidence when children with fewer than five episodes of diarrhoea prior to 24 months were chosen as the reference group. In this assembled sample of 24-month-old children, the proportion of stunting that was attributed to five or more episodes of diarrhoea prior to 24 months was 25% (95% CI 8–38%).

Odds ratio of stunting at 24 months of age across categories of diarrhoeal incidence and longitudinal prevalence of diarrhoea before 24 months. Panel A: effect of diarrhoeal incidence before 24 months by category on the odds of stunting at 24 months. The reference group is comprised of children who had fewer than five episodes before 24 months. The squares represent estimated odds ratio and the vertical segments represent their corresponding 95% CI. Panel B: effect of longitudinal diarrhoeal prevalence before 24 months by category on the odds of stunting at 24 months. The reference group is comprised of children who had a longitudinal diarrhoeal prevalence of 1% before 24 months. The squares represent estimated odds ratio and the vertical segments represent their corresponding 95% CI
Effects of the longitudinal prevalence of diarrhoea on stunting
The relationship between longitudinal prevalence of diarrhoea prior to 24 months and log odds of stunting at 24 months of age was also closely linear (Figure 2b). The effect of the longitudinal prevalence of diarrhoea on stunting was similar between studies (P = 0.507; LRT), meaning that we could pool the effect of diarrhoeal incidence on stunting across studies into a single summary estimate. The adjusted odds of stunting increased multiplicatively by a factor of 1.03 (95% CI 1.01–1.04) for every percent increase in the longitudinal prevalence of diarrhoea (P < 0.001; LRT). For the purpose of interpretation, we scaled the increase in odds of stunting at 24 months to a 5% increase in the longitudinal prevalence of diarrhoea before 24 months (Figure 5). That is, the odds of stunting at 24 months increased by 1.16 when the longitudinal prevalence of diarrhoea prior to 24 months increased by 5% (95% CI 1.07–1.25). The Hosmer-Lemeshow goodness-of-fit test indicated that this model fit the data well (P = 0.998; Chi-square test). Residual analysis did not identify outliers or influential data points.

Effects of the longitudinal prevalence of diarrhoea in the first 24 months on stunting at 24 months of age. Point estimates of the effect of longitudinal diarrhoea prevalence on stunting at 24 months are shown for each study. The size of the square around the point estimate is proportional to sample size. The lines represent 95% CI. In the pooled estimate, represented by a diamond, the odds of stunting at 24 months increased by 1.16 when the longitudinal prevalence of diarrhoea increased by 5% (95% CI 1.07–1.25)
Figure 4b shows that the odds ratio of stunting at 24 months increased with each category of longitudinal prevalence of diarrhoea when children who had <1% of diarrhoea prior to 24 months were chosen as the reference group. In this assembled sample of 24-month-old children, the proportion of stunting attributed to being ill with diarrhoea for 2% of the time or more prior to 24 months was 18% (95% CI 1–31%).
Subset analyses
We conducted a total of eight subset analyses (Appendix 3). The effect of baseline SES on stunting at 24 months did not vary by study in the subset of children with available socioeconomic data (P = 0.152; LRT). We did not detect confounding by SES on the effects of diarrhoeal incidence or longitudinal prevalence of diarrhoea in the first 24 months on the odds of stunting at 24 months of age.
The magnitude of the effect of diarrhoea on stunting was not affected when we excluded children who were stunted before 6 months of age or when we used different exposure periods (Appendix 3). There was only modest variability in the magnitude of the effect of diarrhoea on stunting when we excluded children who were stunted before 6 months of age. However, the effect of diarrhoea on stunting at 24 months increased substantially when we excluded children who were stunted at 1 month of age.
Controlling for HAZ at 6 months of age did not confound the effect of diarrhoea on stunting at 24 months in the subset of children who had heights at ages 6 months and at 24 months and who were not stunted at 6 months of age. Furthermore, we did not find a significant interaction between HAZ at 6 months of age and either cumulative diarrhoeal incidence prior to 24 months (P = 0.215; Wald test) or the longitudinal prevalence of diarrhoea prior to 24 months (P = 0.835; Wald test).
Reversibility of stunting
Few children recovered from stunting within the first 2 years of life (Figure 6). Of the children, >10% who were stunted before 24 months of age recovered from stunting by 24 months beyond regression to the mean (Table 3).

Reversibility of stunting at 24 months of age in stunted children at 6, 12 and 18 months of age. This is a multipanel scatterplot figure of height-for-age at 24 months of age and height-for-age at 6, 12 and 18 months of age. The broken lines indicate 2 SD below the international reference. Filled circles identify children who were not stunted at 24 months but who were stunted at earlier ages
Table 3
Recovery from stunting in children between 6 and 24 months of age
| Age at t1 (months) | n | Stunted at 24 months, n (%) | Stunted at t1 months, n (%) | ra | Stunted at t1 and not stunted at 24 months, n (%) | Recovered from stuntingb beyond regression to the mean, n (%) |
|---|---|---|---|---|---|---|
| 6 | 1005 | 298 (30) | 99 (10) | 0.54 | 15 (15) | 6 (6) |
| 12 | 1422 | 529 (37) | 366 (26) | 0.67 | 47 (13) | 14 (4) |
| 18 | 1758 | 720 (41) | 681 (39) | 0.84 | 86 (13) | 62 (9) |
ar represents the correlation coefficient between HAZ24 and HAZt1 for the subset of children who were stunted at t1 months and not stunted at 24 months.
bWe defined recovery from stunting between ages t1 and 24 months for a child who was stunted at t1 months but not stunted at 24 months and for whom HAZ24 > r × HAZt1, where HAZ24 was the child's HAZ at 24 months, HAZt1 was the child's HAZ at t1 months and r was the correlation coefficient between HAZ24 and HAZt1 for the subset of children who were stunted at t1 months and not stunted at 24 months. That is, we did not include children for whom HAZ24 ≤ r × HAZt1 in the category of those who recovered.
Discussion
Using prospectively collected data from nine cohort studies in five countries, we found that a higher burden of diarrhoea prior to 24 months of life was associated with a greater frequency of stunting at 24 months of age. The effect of diarrhoea on stunting was consistent across studies, and we did not detect confounding by SES. Furthermore, the magnitude of this effect was not affected when we excluded children who were stunted before 6 months of age. Our analysis supports the hypothesis that a higher cumulative burden of diarrhoea adversely affects a child's nutritional status during early childhood and that catch-up growth does not appear to make up for this deficit.
This analysis shows that both cumulative incidence and longitudinal prevalence of diarrhoea prior to 24 months have a statistically significant ‘dose–response’ relationship with stunting at 24 months of age. Although both measures of cumulative burden appear to describe the effects of diarrhoea on stunting equally well, longitudinal prevalence (expressed as a proportion of time spent ill with diarrhoea) may be a more appealing measure of cumulative exposure than incidence because each observed day of diarrhoea can be represented as a lost opportunity to gain height. A critical assumption is that any day of diarrhoea has an equally adverse effect on the odds of stunting. However, we cannot exclude the possibility that unmeasured confounders, such as prevalence of zinc deficiency and infections other than diarrhoea, may affect the observed relationship between the cumulative burden of diarrhoea and stunting.
We approached individual investigators to request original data from longitudinal studies that collected daily records of diarrhoeal surveillance and regular anthropometric measurements per child over time. We identified several advantages of pooling original data from multiple studies over a classical meta-analysis approach. First, we applied a standard definition for a diarrhoeal episode across all studies. Second, we compared all anthropometric measurements against the same international growth reference. And third, we applied the same analytical method for all studies to test our hypothesis.
The effects of the history of diarrhoea prior to 24 months of life on stunting at 24 months of age were similar across studies despite differences in study design, and despite the heterogeneity in the prevalence of stunting and in the history of diarrhoea across studies. While other investigators have performed comprehensive reviews on this topic,36,37 we do not know of any published investigation that has attempted a pooled analysis, as we have done. Moreover, the results of our pooled analysis are easy to understand and easy to translate to other populations, while the methods can be used to examine the effects of other childhood infections on stunting.
Nonetheless, we encountered some methodological challenges in pooling data across multiple studies. For example, not all studies recorded the number of loose stools on each day of surveillance, but relied instead on maternal reporting to define a day of diarrhoea. We also did not have data on breastfeeding or food intake; however, one of the included longitudinal studies measured energy intake quantitatively and found that the effect of energy intake on growth was independent from the effect of diarrhoea on growth.38 Additionally, in the Peru 1995 study, we previously documented that breastfeeding did not confound the effect of diarrhoea on linear growth.21 Each study used a different definition for SES and this could explain why we did not detect an association between SES and stunting. One limitation is that our analysis uses only a subset of children who were followed for at least 250 days and who had an anthropometric measurement at 24 months of age, which may limit generalizability due to the increased likelihood that children of the subset were alive at that age. Another limitation is that we did not have information on other concurrent infections that may also affect growth. Our study has the potential for publication bias as a reason for the overall positive finding, as studies that did not find an association between diarrhoea and nutritional status may be less likely to be published.
There are other analytical approaches that we could have considered for this study, such as a longitudinal growth analysis or a time-to-event analysis. Any of these analyses, however, would have changed the inferential objective. We used the prevalence of stunting at 24 months as an outcome because, in developing countries, stunting is a common condition that is usually regarded as a manifestation of chronic malnutrition.39 Although the mechanisms that lead to stunting are not well understood, it is likely to be the product of cumulative nutritional insults.40 Thus, it is plausible that a higher cumulative burden of diarrhoea increases the chance of childhood stunting. An advantage of using stunting as the outcome is that the prevalence of stunting is generally low in the first months of life. In our study, 14% of children were stunted before 6 months of age. Moreover, there appears to be limited reversibility once a child becomes stunted.41 Our data showed that reversibility of stunting was relatively uncommon within the 2 years of life. That is, only 6% of children who were stunted at 6 months of age recovered from stunting at 24 months of age beyond regression to the mean. Moreover, stunting is a fairly robust measurement of nutritional status in that it appears to be only affected by sustained or multiple, frequent nutritional insults, in contrast to underweight where large fluctuations are common as a result of a nutritional insult.
Stunting is also a useful outcome from a health policy perspective. Stunting is an age-and-sex corrected health statistic that produces valid and reliable measurements when performed. It is an easy and inexpensive measurement to conduct in large-scale cross-sectional surveys. For example, stunting at 24 months of age is collected by Demographic Health Surveys worldwide. Furthermore, stunting is also a comparable health statistic across countries.
Finally, our analysis of the longitudinal prevalence of diarrhoea on stunting suggests a 24-month-old child with more days of diarrhoea had a greater chance of becoming stunted than a 24-month-old child with fewer days of diarrhoea. It follows that an episode of persistent diarrhoea (i.e. lasting 14 days or longer) contributes to a greater chance of stunting than an episode that lasts <14 days. On the other hand, our analysis showed that the proportion of episodes that were persistent did not contribute to stunting above and beyond the effect of cumulative incidence of diarrhoea. This suggests that the greater chance of stunting associated with a persistent episode is due only to its duration.
In summary, we found that a higher cumulative burden of diarrhoea prior to 24 months of life was associated with an increased prevalence of stunting at 24 months of age. The magnitude of this effect was constant across a range of different contexts. Therefore, prevention of early childhood diarrhoea should be fully integrated into programmes that aim to reduce the incidence of childhood stunting.
Acknowledgements
We would like to thank Dr Christopher Cox (The Johns Hopkins University, Baltimore, USA) for his help with the calculation of the attributable risk. This study was supported by a grant from Bill and Melinda Gates Foundation and in part by a National Institutes of Health grant awarded to W.C. (F32HL090179). The sponsors had no role in the design and conduct of the study, analysis or interpretation of results in this manuscript, or in the preparation of this manuscript. The authors have no conflicts of interest, including financial interests and relationships and affiliations relevant to the subject of this manuscript. The other members of the Childhood Malnutrition and Infection Network include: Dr Mauricio L Barreto (Federal University of Bahia, Salvador, Brazil), Dr Leonor M P Santos (Universidade de Brasília, Brazil), Dr Sean R Moore (Vanderbilt University, USA), Dr Aldo A M Lima (Universidade Federal do Ceará in Fortaleza, Brazil), Dr Relana C Pinkerton (University of Virginia, USA), Dr Peter Aaby (Statens Serum Institut, Denmark and the Bandim Health Project, Bissau, Guinea-Bissau), Lilia Z Cabrera (A.B. PRISMA, Peru), Dr Caryn Bern (Centers for Disease Control, USA), Dr Charles R Sterling (University of Arizona, USA), Dr Leonardo D Epstein (Universidad Catolica de Chile, Chile), Dr Paul Arthur (deceased), Dr John Gyapong (Ministry of Health, Ghana), Dr Betty R Kirkwood (London School of Hygiene & Tropical Medicine, UK), Dr David A Ross (London School of Hygiene & Tropical Medicine, UK), Dr Kenneth H Brown (University of California at Davis, USA), Dr Stan Becker (The Johns Hopkins University, USA), Dr Lawrence Moulton (The Johns Hopkins University, USA), Dr Simon N Cousens (London School of Hygiene & Tropical Medicine, UK), Dr Michael Perch (Statens Serum Institut, Copenhagen), Dr Thea K Fischer (Statens Serum Institut, Copenhagen), Dr Halvor Sommerfelt (Center of International Health, University of Bergen, Norway), Dr Hans Steinsland (Center of International Health, University of Bergen, Norway), Hector Verastegui (Instituto de Investigación Nutricional, Perú).
Appendix 1: Socioeconomic variables by study
Table A1
Description of socioeconomic groups, Brazil 1990
| Low SES (n=149) (%) | Middle SES (n=212) (%) | High SES (n=126) (%) | |
|---|---|---|---|
| No sanitation | 33.7 | 26.2 | 22.6 |
| No maternal education | 100 | 80.5 | 24.3 |
| Low consumer goods | 72.8 | 10.9 | 0 |
| Intermediate consumer goods | 27.1 | 71.4 | 41.7 |
| High consumer goods | 0 | 17.6 | 58.2 |
Table A2
Description of socioeconomic groups, Bangladesh 1978
| Low SES (n=49) (%) | Middle SES (n=60) (%) | High SES (n=31) (%) | |
|---|---|---|---|
| No maternal education | 100 | 89.5 | 68.3 |
| No water source | 100 | 84.2 | 68.3 |
| Less than 2.2 people/100 ft2 | 79.6 | 30.0 | 3.22 |
| 2.2–3 people/100 ft2 | 20.4 | 55.0 | 35.5 |
| More than three people/100 ft2 | 0 | 15.0 | 61.3 |
Table A3
Description of socioeconomic groups, Peru 1995
| Low SES (n=115) (%) | Middle SES (n=52) (%) | High SES (n=57) (%) | |
|---|---|---|---|
| No maternal education | 41.8 | 11.5 | 0 |
| Maternal education grade school or high school | 41.8 | 34.6 | 14.5 |
| Maternal higher education | 16.4 | 53.8 | 85.5 |
| Open field | 33.6 | 9.61 | 0 |
| Latrine | 40.0 | 34.6 | 17.7 |
| Flush toilet | 26.4 | 55.8 | 82.3 |
| Annual per capita household income <$96 | 57.3 | 23.1 | 0 |
| Annual per capita household income from $96 to 171.40 | 30.9 | 42.3 | 32.3 |
| Annual per capita household income >$171.40 | 11.8 | 34.6 | 67.7 |
Table A4
Description of socioeconomic groups, Peru 1985
| Low SES (n=33) (%) | Middle SES (n=35) (%) | High SES (n=37) (%) | |
|---|---|---|---|
| Maternal primary education incomplete | 57.5 | 28.6 | 18.9 |
| Maternal primary school complete | 18.2 | 31.4 | 45.9 |
| Maternal secondary education started or complete | 24.2 | 40 | 35.1 |
| Defecates in fields | 81.1 | 20.0 | 2.72 |
| Defecates in outhouse, bucket, bag or other not latrine | 6.06 | 34.3 | 10.8 |
| Indoor latrine | 12.1 | 45.7 | 86.5 |
| Three to five people per house | 45.5 | 48.6 | 16.2 |
| Six to seven people per house | 39.4 | 40.0 | 35.1 |
| Eight or more people per house | 15.5 | 11.4 | 48.7 |
Table A5
Description of socioeconomic groups, Guinea-Bissau 1987
| Low SES (n=508) (%) | Middle SES (n=495) (%) | High SES (n=381) (%) | |
|---|---|---|---|
| No maternal education | 88.9 | 64.4 | 21.9 |
| 1–4 years of maternal education | 11.0 | 25.0 | 35.6 |
| 5 or more years of maternal education | 0 | 10.6 | 42.5 |
| Toilet | 57.4 | 66.6 | 83.6 |
| Less than six people in household | 0 | 15.7 | 55.8 |
| Six to eight people in household | 17.6 | 55.5 | 34.2 |
| More than eight people in household | 82.4 | 28.7 | 9.93 |
Table A6
Description of socioeconomic groups, Guinea-Bissau 1994
| Low SES (n=136) (%) | Middle SES (n=216) (%) | High SES (n=292) (%) | |
|---|---|---|---|
| Zinc roof | 22.9 | 16.9 | 15.5 |
| No maternal education | 59.1 | 20 | 0 |
| Less than 4 years maternal education | 25.4 | 27.0 | 2.62 |
| 5 or 6 years maternal education | 11.5 | 34.9 | 32.3 |
| 7 to 12 years of maternal education | 3.99 | 18.0 | 65.1 |
| One other child alive to the mother | 0 | 29.7 | 70.0 |
| Two other children alive to the mother | 11.7 | 36.5 | 29.1 |
| Three other children alive to the mother | 22.7 | 25.5 | .78 |
| Four other children alive to the mother | 28.6 | 7.70 | 0 |
| Five or more other children alive to the mother | 36.9 | .65 | 0 |
Table A7
Description of socioeconomic groups, Ghana 1990
| Low SES (n=694) (%) | Middle SES (n=444) (%) | High SES (n=814) (%) | |
|---|---|---|---|
| No maternal education | 100 | 69.8 | 59.5 |
| One or fewer people sleeping in room with study child | 0 | 0 | 64.7 |
| Two people sleeping in room with study child | 0 | 32.0 | 17.0 |
| Three or more people sleeping in room with study child | 100 | 68.0 | 18.4 |
| Zinc roof | 0 | 13.0 | 42.6 |
Table A8
Description of socioeconomic groups, Brazil 1989
| Low SES (n=32) (%) | Middle SES (n=23) (%) | High SES (n=64) (%) | |
|---|---|---|---|
| No toilet | 43.7 | 0 | 17.7 |
| Open toilet | 56.3 | 91.3 | 64.5 |
| Flush toilet | 0 | 8.69 | 17.7 |
| Four or fewer people per house | 0 | 0 | 83.9 |
| Five people per house | 84.4 | 8.70 | 0 |
| Six or more people per house | 15.6 | 91.3 | 16.2 |
Appendix 2: Logistic regression model building
Cumulative diarrhoeal incidence
The Table A9 shows how we constructed our regression model. In this table, the outcome variable was the prevalence of stunting at 24 months (yij) and the covariates were study, diarrhoeal incidence prior to 24 months (dij), and sex (sij), where i = 1, …,9 indexed study, j = 1, …,ni indexed the number of children for each study, y was coded as 1 if stunted at 24 months and coded 0 if otherwise and s was coded as 1 if female and coded as 0 if male. In constructing our regression model, we began with three fixed-effects parameters for each study: an intercept (αi), a parameter for the effect of diarrhoeal incidence on stunting (βi), and a parameter for the effect of sex on stunting (γi). We then simplified our regression with a model that allowed for only one parameter to explain the effect of diarrhoeal incidence on the odds of stunting, one intercept for all children, and one parameter for a sex effect on stunting. We used the LRT to compare nested models.
Table A9
Cumulative diarrhoeal incidence
| Regression model | −2 log L | LRT | |
|---|---|---|---|
| 1 | 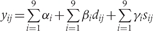 | 1549.432 | |
| 2 |  | 1558.672 | 2 vs 1; P = 0.409 |
| 3 |  | 1649.180 | 3 vs 2; P < 0.001 |
| 4 |  | 1585.169 | 4 vs 2; P < 0.001 |
Longitudinal prevalence of diarrhoea
The Table A10 shows how we constructed our regression model. In this table, the outcome variable was the prevalence of stunting at 24 months (yij) and the covariates were study, longitudinal prevalence of diarrhoea prior to 24 months (dij), and sex (sij), where i = 1, …,9 indexed study and j = 1, …,ni indexed the number of children for each study, y was coded as 1 if a child was stunted at 24 months and coded as 0 if otherwise and s was coded as 1 if female and coded as 0 if male. In constructing our regression model, we began with three fixed-effects parameters for each study: an intercept (αi), a parameter for the effect of the longitudinal prevalence of diarrhoea on stunting (βi), and a parameter for the effect of sex on stunting (γi). We then simplified our regression with a model that allowed for only one parameter to explain the effect of the longitudinal prevalence of diarrhoea on the odds of stunting, one intercept for all children, and one parameter for a sex effect on stunting. We used the LRT to compare nested models.
Table A10
Longitudinal prevalence of diarrhoea
| Regression model | −2 log L | LRT | |
|---|---|---|---|
| 1 |  | 1557.036 | |
| 2 | | 1564.314 | 2 vs 1; P = 0.507 |
| 3 | | 1647.955 | 3 vs 2; P < 0.001 |
| 4 | | 1590.091 | 4 vs 2; P = 0.001 |
Appendix 3: Results of logistic regressions on the effects of diarrhoea on stunting at 24 months in different subsets
The results of various logistic regression models are shown on the Figure A1. We evaluated the effect of diarrhoeal incidence and the longitudinal prevalence of diarrhoea on stunting at 24 months of age in eight subsets: (i) the effect of diarrhoea before 24 months (0–23.99) on stunting at 24 months for children with at least 250 days of follow-up; (ii) the effect of diarrhoea before 23 months (0–22.99) on stunting at 24 months for children with at least 240 days of follow-up; (iii) the effect of diarrhoea before 22 months (0–21.99) on stunting at 24 months for children with at least 229 days of follow-up; (iv) the effect of diarrhoea between 1 and 23 months (1–23.99) on stunting at 24 months for children with at least 240 days of follow-up and excluding children not stunted at 1 month; (v) the effect of diarrhoea between 3 and 23 months (3–23.99) on stunting at 24 months for children with at least 219 days of follow-up and excluding children not stunted at 3 months; (vi) the effect of diarrhoea between 6 and 23 months (6–23.99) on stunting at 24 months for children with at least 188 days of follow-up and excluding children who were not stunted at 6 months; (vii) the effect of diarrhoea between 1 and 23 months (1–23.99) on stunting at 24 months for children with at least 240 days of follow-up and excluding children not stunted at 1 month or at 3 months; (viii) the effect of diarrhoea between 3 and 23 months (3–23.99) on stunting at 24 months for children with at least 219 days of follow-up and excluding children not stunted at 3 months or at 6 months. Panel A: odds ratio of stunting at 24 months per incident episode of diarrhoea per child-year. Filled squares represent adjusted odds ratios, and vertical segments represent 95% CI. The dashed horizontal line indicates the adjusted odds ratio for the effect of diarrhoea before 24 months (0–23.99) on stunting at 24 months. Panel B: odds ratio of stunting at 24 months per percentage increase in the longitudinal prevalence of diarrhoea. Filled squares represent adjusted odds ratios, and the segments represent 95% CI. The dashed horizontal line indicates the adjusted odds ratio for the effect of diarrhoea before 24 months (0–23.99) on stunting at 24 months. Panel C: rectangles indicate the relevant exposure periods for the history of diarrhoea, and the ‘N’ s represent subsets of stunted children at different ages that were excluded from the analysis. The first column of numbers (‘n's) in the x-axis represent the sample size for each subset analysis, and the second column of numbers (‘j's) represent the number of studies included for each subset analysis.

References
Articles from International Journal of Epidemiology are provided here courtesy of Oxford University Press
 Facebook
 Twitter
 Google+