Results
-
National Report Card
How We Measure Success
Helping our students get to and through college and achieve their dreams is only possible if we know exactly how we are doing. Data helps us understand what our true impact is, what is working, and what needs to be improved. Our Six Essential Questions provide a yardstick by which to measure our progress, keep us focused as we grow, and—most important—help us keep the promises we make to our students and their families.
-
Question 1: Who Are Our Students?
Who Are Our Students?
A great education is the best path to a life full of opportunity. KIPP schools aim to educate students in educationally underserved communities, including English language learners and students with special needs.
KIPP Student Demographics
-
Number of Students100,000+
-
Number of Schools256
-
Grades ServedPreK-12
-
95%African American or Latinx
-
2%White
-
2%Asian
-
2%Other
*This figure excludes the 115 schools that did not collect FRPL data because those schools are enrolled in the federal Community Eligibility Program (CEP), which qualifies 100% of their students for free lunch through other federal programs.
**Some schools serve a much higher proportion of ELL students than others do, given their location.
-
-
Question 2: Are Our Students Staying With Us?
Are Our Students Staying With Us?
We know that when a school is healthy, students want to return year after year. We are committed to creating schools where all students can thrive, and we closely track student attrition to ensure we’re keeping our students with us and meeting our mission.
KIPP Student Retention Rates
-
87%of KIPP students returned in 2018
-
13%did not return to KIPP
Student attrition data is based on the 209 KIPP schools that were open in the 2017-18 school year. KIPP defines attrition as the percentage of students who leave a school (for reasons other than completing the highest grade or transferring to another KIPP school) in one annual cycle between October 1 of 2017 and October 1 of 2018, which is the date that most states close their enrollment.
-
-
Question 3: Are Our Students Progressing and Achieving Academically?
Are Our Students Progressing and Achieving Academically?
Our goal is to put our students on an academic trajectory toward college readiness. We use a variety of tools to understand student achievement, and look closely at our results to ensure we’re fulfilling our promises to students and families.
Percentage of Students On or Above Grade Level on MAP
Results below show our students’ performance on the norm-referenced Measures of Academic Progress (MAP) test.
Elementary School 4th Grade Exiting Performance in Spring 2018

Middle School Cohort (Fall 2014 – Spring 2018)


Percentage of Students Meeting or Exceeding Growth Targets in 2017–18
Across all grades and subjects, the majority of KIPP students are outperforming the national average for annual growth.


Growth targets represent fall-to-spring growth based on NWEA’s MAP assessment.
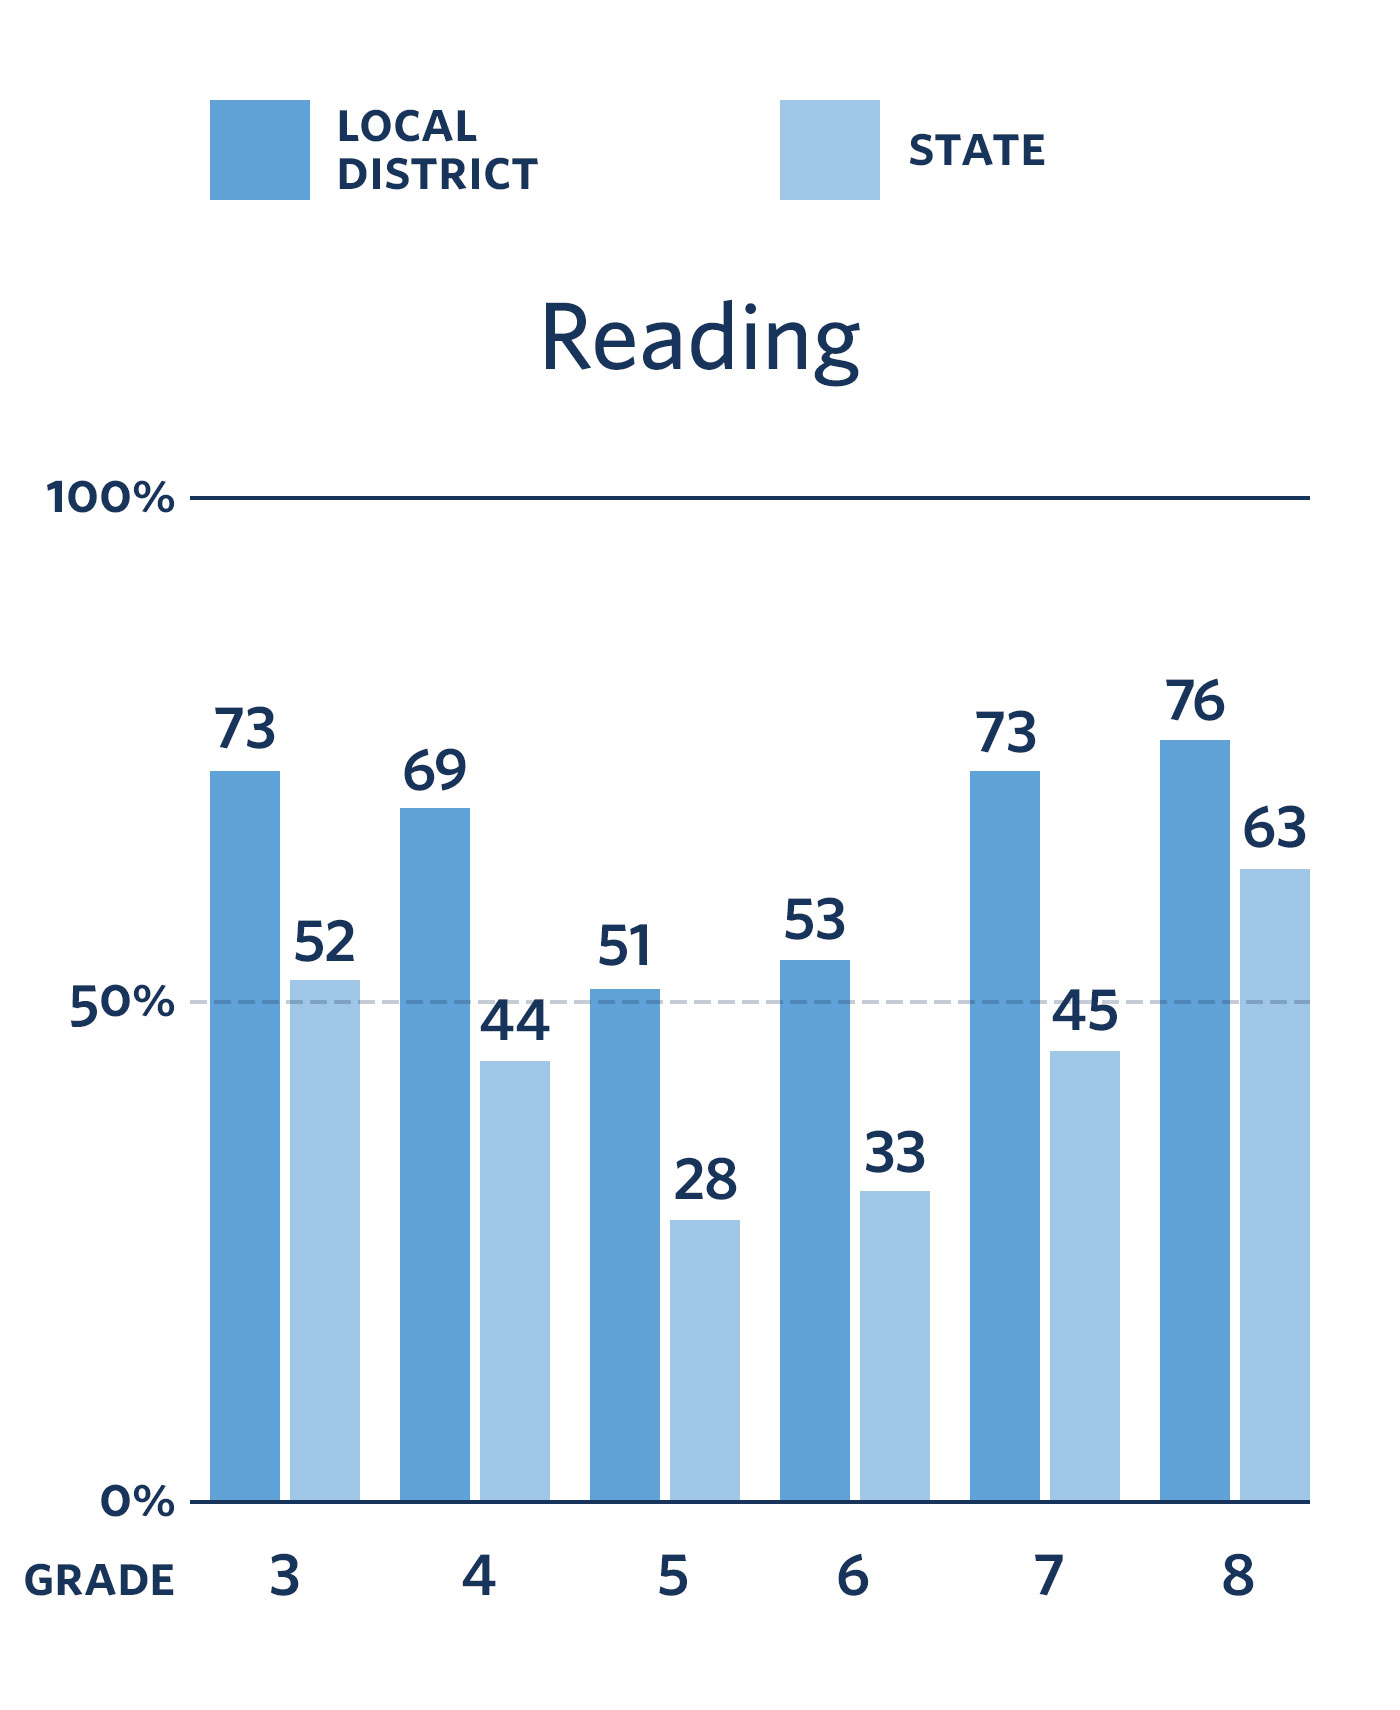
Percentage of KIPP Classes Outperforming Local Districts & States in 2017–18


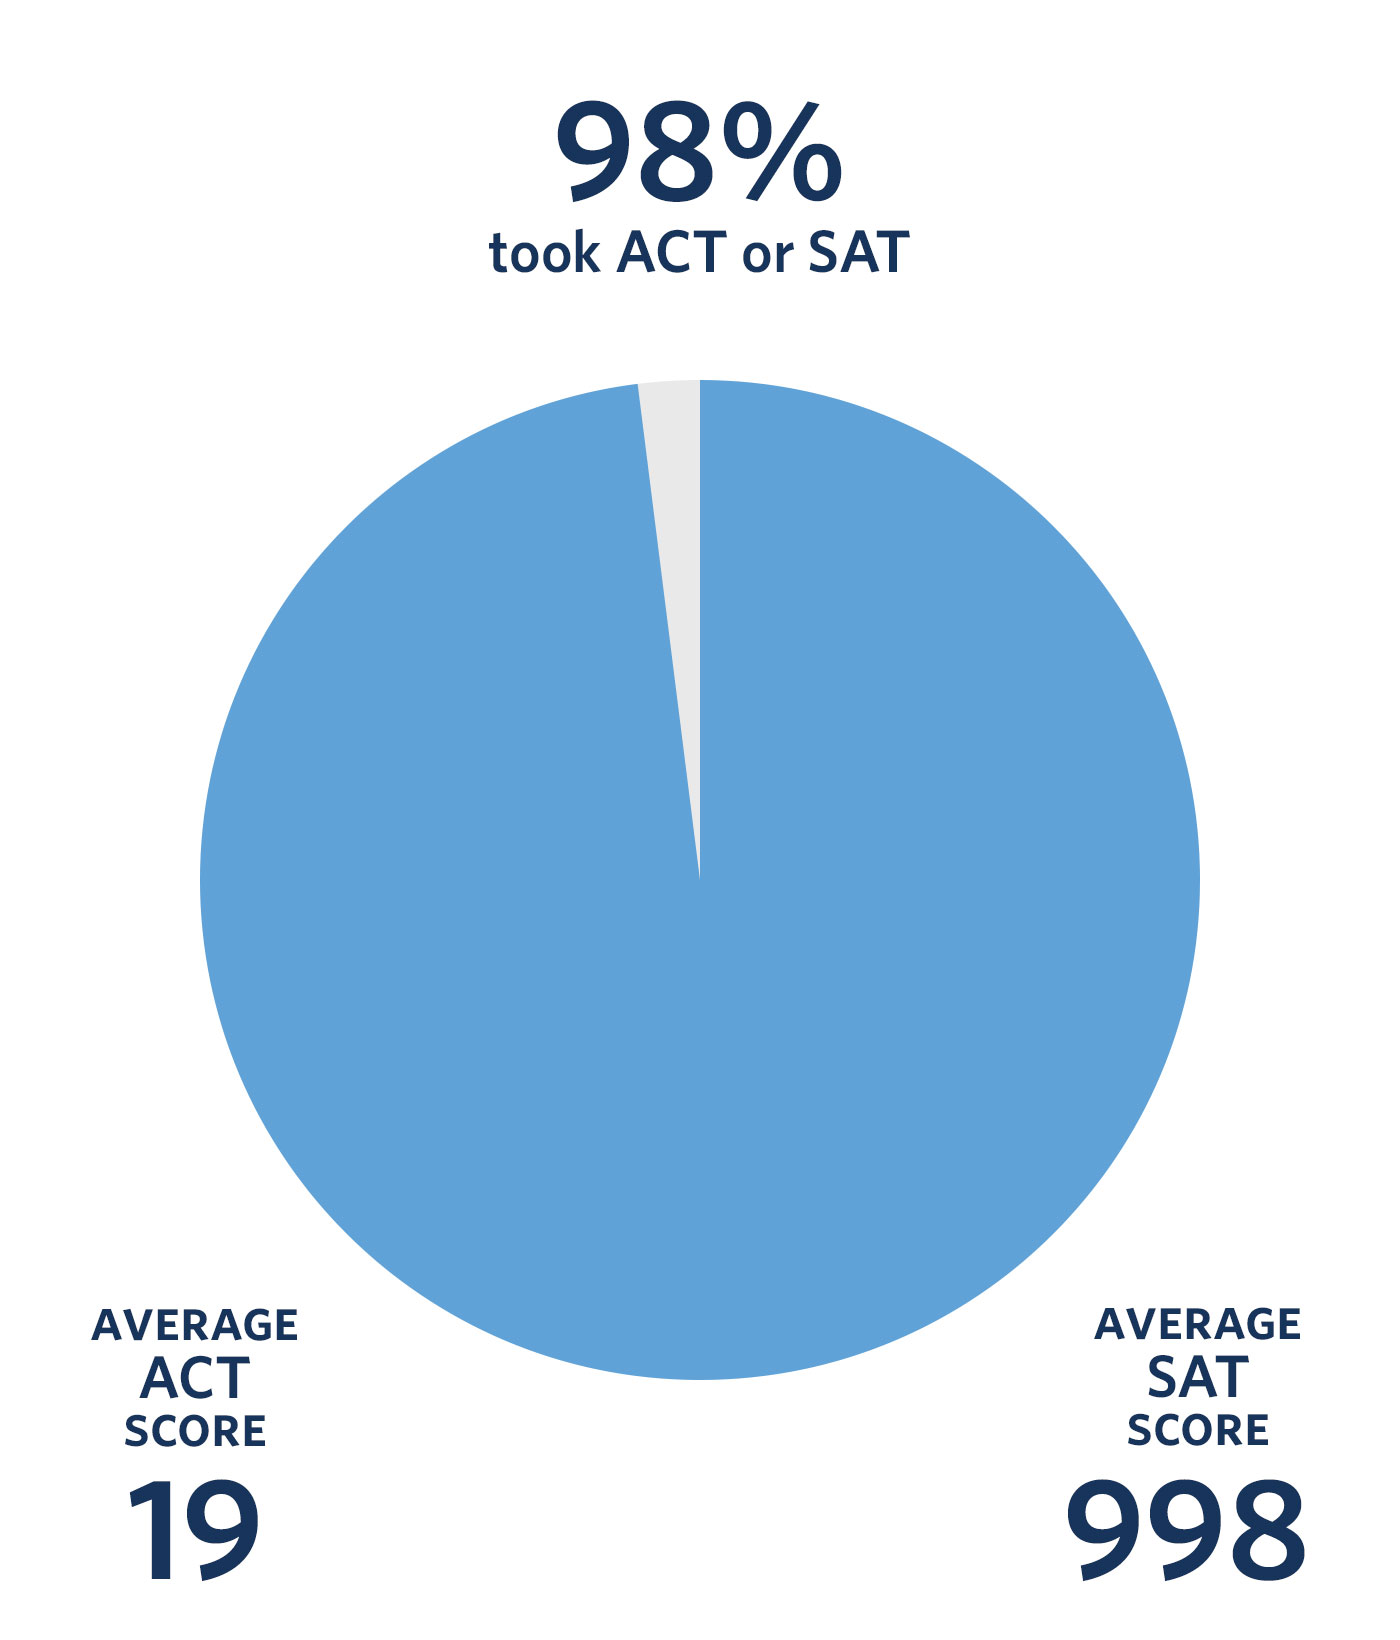
Advanced Placement (AP), ACT, and SAT Test Results for KIPP High School Graduating Seniors

-
Question 4: Are Our Students Climbing the Mountain To And Through College?
Are Our Students Climbing the Mountain To And Through College
To meet our mission in preparing students to lead choice-filled lives, we follow the progress of our KIPP alumni, examining their rates of high school graduation, as well as college enrollment and college completion.
KIPP Alumni Attainment Rates


*As of fall 2018, an additional 5% of KIPP alumni earned associate’s degrees.
KIPP tracks its rates of high school graduation, college enrollment, and college graduation for all students who either completed 8th grade at a KIPP middle school or graduated from a KIPP high school. For alumni who graduated from KIPP high schools, 45% have completed a four-year degree.
Data above reflects the latest available from the 2017-18 school year.
Printable national results and appendix
Higher Education Report 2019
Leading up to the reauthorization of the Higher Education Act, KIPP published a report calling on education leaders, policy makers, higher education institutions, and advocates to commit to drastic changes in the ways we currently support students in college. The report includes five strategies to increase college matriculation and persistence rates for students of color, first-generation college goers, and students from low income families, as well as the latest national college completion data for KIPP schools.
Download Report
2017 KIPP Alumni Survey
The 2017 KIPP Alumni survey focused on how KIPP alumni experience a sense of belonging in college. The financial difficulties faced by students from low-income families in making it to graduation are well documented, but recently, less tangible factors—like sense of belonging—have also been shown to impact college completion rates. The survey results also show a connection between sense of belonging for KIPP alumni in college and both their mental health and achievement.
2017 Alumni Survey Results
College Completion Report 2011
In an effort to demonstrate how our KIPP alumni were faring after they left our schools, we published The Promise of College Completion: KIPP’s Early Successes and Challenges in 2011. This report detailed the college completion rates from the first two KIPP middle schools and offered a clearer picture of the challenges students from low-income communities face on the path to a degree, as well as the factors that help them succeed.
Download Report -
Question 5: Are We Building a Sustainable People Model?
Are We Building a Sustainable People Model?
Educators are at the heart of KIPP. We are committed to investing in the people who join us, and making sure they have the supports they need to do their best work every day.
KIPP Talent Retention Percentages
-
65%returned to their teaching position
-
8%moved into a non-teaching position at KIPP or now teach at another KIPP school
-
28%did not return to KIPP
-
75%remained school leaders
-
11%remained in the KIPP network in other roles
-
14%did not return to KIPP
-
-
Question 6: Are We Building a Sustainable Financial Model?
Are We Building a Sustainable Financial Model?
Like all public schools, KIPP public charter schools receive funding from federal, state, and local public sources to support the cost of operations. And, like most public schools, KIPP schools also raise private funding to strengthen the impact of programs.
The cost to grow and serve more students varies greatly across our communities. As a result, there is no “one-size-fits-all” business model for providing a high-quality KIPP education.
Our goal for financial sustainability is for KIPP regions to have reliable and renewable financial resources. Financially healthy KIPP regions manage within a budget, accurately forecast revenue needs, ensure they take on only the debt they can afford, have strong internal controls, and prudently save as insurance to weather the unexpected.
For more information, download our financial forms:
-
- Regional Report Card
- Impact on Public Ed
- Independent Reports