Last Updated: September 2019
In addition to evaluations of other charities, GiveWell publishes substantial evaluation of our own work, from the quality of our research to our impact on donations. This page summarizes two key metrics: (a) money moved and (b) web traffic.
Money moved
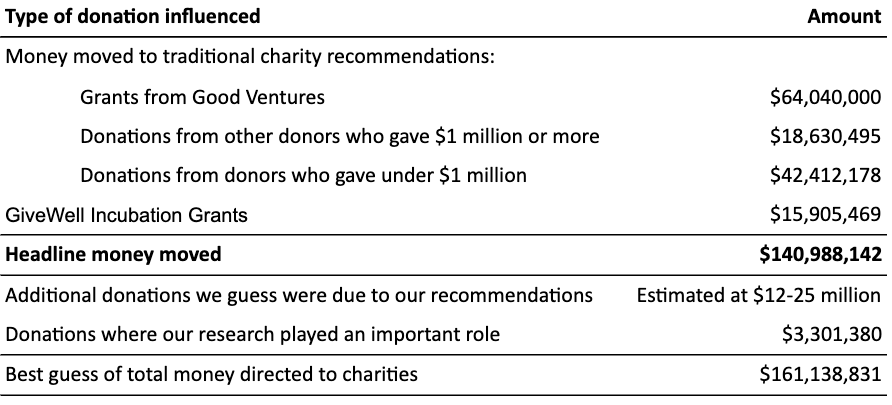
In 2018, GiveWell influenced charitable giving in several ways. The following table summarizes the money that we were able to track.
For more details on our money moved, our growth, and our donors:
Money moved to recommended charities
The chart below shows GiveWell's annual money moved to our recommended charities (top charities and standout charities) and via our Incubation Grants program. In this chart, we include only donations that we can confidently attribute to our research (more detailed definition below).
We have included grants made by Good Ventures to recommended charities.

The table below shows GiveWell's money moved to our recommended and standout charities.
| Charity | 2018 | 2017 | 2016 | 2015 | 2014 | 2013 | 2007-2012 |
|---|---|---|---|---|---|---|---|
| Malaria Consortium – Seasonal Malaria Chemoprevention | $37,339,086 | $29,124,571 | $5,054,101 | $0 | $0 | $0 | $0 |
| Against Malaria Foundation | $28,506,395 | $20,663,128 | $33,742,956 | $38,782,061 | $9,864,957 | $2,546,429 | $9,035,392 |
| GiveDirectly | $13,885,607 | $10,105,198 | $18,392,436 | $57,191,671 | $12,175,390 | $11,029,748 | $1,558,497 |
| Evidence Action's Deworm the World Initiative | $12,342,229 | $18,914,083 | $7,112,570 | $11,910,407 | $1,168,291 | $2,145,379 | $0 |
| Helen Keller International's Vitamin A Supplementation Program | $10,943,846 | $7,776,101 | $0 | $0 | $0 | $0 | $0 |
| Sightsavers' Deworming Program | $9,999,538 | $2,660,107 | $3,109,090 | $0 | $0 | $0 | $0 |
| Schistosomiasis Control Initiative | $5,923,074 | $12,099,806 | $16,125,572 | $3,692,480 | $6,405,458 | $2,202,878 | $1,972,620 |
| The END Fund's Deworming Program | $2,772,566 | $2,842,723 | $5,422,097 | $0 | $0 | $0 | $0 |
| Development Media International | $1,298,110 | $409,303 | $663,107 | $500,035 | $612,540 | $0 | $0 |
| Iodine Global Network | $497,063 | $571,431 | $598,216 | $859,685 | $478,530 | $0 | $0 |
| Evidence Action unrestricted | $372,756 | $0 | $0 | $0 | $0 | $0 | $0 |
| GAIN – Universal Salt Iodization | $177,681 | $225,806 | $559,603 | $494,309 | $484,792 | $0 | $0 |
| Project Healthy Children | $162,268 | $140,302 | $377,360 | $0 | $0 | $0 | $0 |
| Evidence Action's Dispensers for Safe Water | $154,810 | $135,453 | $0 | $0 | $0 | $0 | $0 |
| Malaria Consortium unrestricted | $150,338 | $0 | $0 | $0 | $0 | $0 | $0 |
| Food Fortification Initiative | $143,461 | $150,242 | $362,678 | $0 | $0 | $0 | $0 |
| Living Goods | $136,506 | $126,615 | $331,518 | $338,896 | $514,833 | $0 | $0 |
| Evidence Action's No Lean Season | $128,010 | $14,858,478 | $0 | $0 | $0 | $0 | $0 |
| Zusha! Road Safety Campaign | $109,328 | $0 | $0 | $0 | $0 | $0 | $0 |
| Other | $40,000 | $0 | $0 | $0 | $0 | $0 | $89,192 |
| Total to recommended charities | $125,082,673 | $120,803,347 | $91,851,304 | $113,769,543 | $31,704,790 | $17,924,434 | $12,655,701 |
Notes:
- Because a significant amount of GiveWell's money moved comes in around December each year, we only update these figures annually.
- Because donations tend to be clustered in late December and early January, grouping these donations together provides a more accurate picture of annual growth. In the table and chart above, each year covers February 1 to January 31, e.g. "2012" refers to February 1, 2012 to January 31, 2013.
Incubation Grants
In 2018, Good Ventures made GiveWell Incubation Grants, on our recommendation, totaling $15.9 million. These grants support organizations at any point in their development, with the hope of identifying additional future top charities to recommend to our donors. The following table shows Incubation Grants made in our 2018 metrics year.1
| Grant | Organization Name | Amount | Date |
|---|---|---|---|
| Evidence Action Beta—Iron and Folic Acid Supplementation ("Phase 2") | Evidence Action Beta | $3,408,259 | December 2018 |
| Evidence Action Beta—Incubator Program | Evidence Action Beta | $5,069,866 | July 2018 |
| Fortify Health—General Support | Fortify Health | $295,217 | June 2018 |
| Nick Otis—Forecasting Research | Nick Otis | $10,000 | May 2018 |
| IDinsight—Embedded GiveWell Team (2018) | IDinsight | $1,196,729 | April 2018 |
| Evidence Action Beta—Iron and Folic Acid Supplementation | Evidence Action Beta | $320,000 | March 2018 |
Other money moved
In addition to donations that we can confidently attribute to our research, detailed above, our best guess is that we had additional impact via (a) untracked donations made on our recommendation and (b) decisions where our research played an important role but where research by other groups also played a role.
For untracked donations, we estimate that donors gave $12-25 million based on our research that we did not track. This estimate is based on data from top charities on total donations not attributed to a source and the proportion of attributed donations that were attributed to GiveWell.
Our research has played a significant role in the decisions of The Life You Can Save, which makes charity recommendations and has cited our research. While we believe our research played an important role in this group’s recommendations, it was not the only input into the process, and we therefore include it in the table above in a separate category from our headline money moved.
Details in our 2018 annual metrics report.
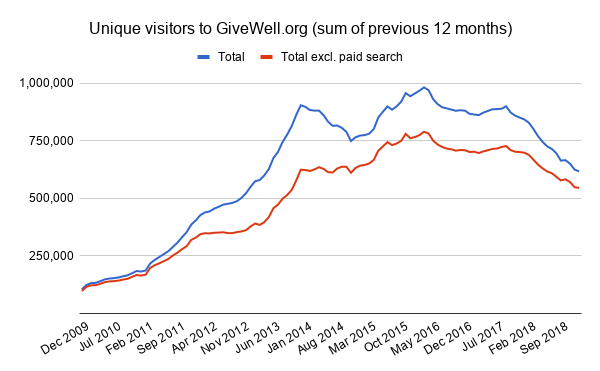
Web traffic
The chart below shows our web traffic over time, as measured by unique visitors each month. There are seasonal spikes each December when interest in charitable giving peaks so we emphasize the trend by showing the rolling sum over the previous twelve months. The chart starts in December 2009 (the first period for which we have 12 months of reliable data due to an issue tracking visits in 2008). (Full data and notes on data sources are here.)
What we count as "money moved"
- Donations made to GiveWell to support our recommended charities.
- Donations made directly to our recommended charities that donors reported as attributable to GiveWell.
- Donations made directly to our recommended charities that donors reported as attributable to other organizations that we believe relied heavily on our research (for example, Effective Altruism Foundation, RC Forward, and Effective Altruism Australia).
- Donations that donors report to us (informally or using our donation report form) as donations that they made on the strength of our recommendation.
- Grants made as part of our Incubation Grants program.
We are cautious not to double-count donations reported by the charity and the donor. For more details on our methodology, see the appendix of our 2018 annual metrics report.
Previous metrics reports
- 1.
A $1 million grant to J-PAL's Innovation in Government Initiative, dated on the website as December 2018, was not made until March 2019 and is excluded from the $15.9 million total. Included in the $15.9 million total but not listed in the table below is a $5,605,398 grant made in January 2019 but not yet listed on our website.