Fast and wild: new paper on my “boottest” program

Three coauthors and I just released a working paper that explains what the wild cluster bootstrap is, how to extend it to various econometric contexts, how to make it go really fast, and how to do it all with my “boottest” program for Stata. The paper is meant to be pedagogic, as most of the methodological ideas are not new. The novel ideas pertain mainly to techniques for speeding up the bootstrap, and to something called Restricted Limited-Information Maximum Likelihood estimation. The title is “Fast and Wild: Bootstrap Inference in Stata Using boottest.”
A few years ago I read the clever study by Kevin Croke that turned a short-term deworming impact study into a long-term one. Back in 2006, Harold Alderman and coauthors reported on a randomized study in Uganda of whether routinely giving children albendazole, a deworming pill, increased their weight. (Most of these children were poorly enough off that any weight gain was probably a sign of improved health.) In that study, the average lag from treatment to follow-up was 16.6 months. But randomized trials, as I like to say, are like the drop of a pebble in a pond: their ripples continue to radiate. Kevin followed up much later on the experiment by linking it to survey data from Uwezo on the ability of Ugandan children to read and do math, gathered in 2010–11. He obtained reading and math scores for some 700 children in parishes (groups of villages) that had been part of the experiment. This let him turn a study of short-term effects on weight gain into one of long-term effects on academic ability.
In a standard move, the Croke paper clusters standard errors by parish, to combat the false precision that might arise if outcomes are correlated for children within a parish for unmeasured reasons. And because there are relatively few parishes—10 in the treatment group, 12 in the control—the paper uses the “wild cluster bootstrap” to interpret the results. This method has become popular since Cameron, Gelbach, and Miller proposed it about 10 years ago.
Kevin’s paper introduced me to this method. As a part of my effort to understand it, I wrote a code fragment to apply it. I quickly saw that the available programs for wild bootstrapping in Stata, cgmreg and cgmwildboot were useful, but could be dramatically improved upon, at least in speed. And so I wrote my own program, boottest, and shared it with the community of Stata users. As programs often do, this one grew in features and complexity, largely in response to feedback from users. In standard applications, like Kevin’s, the program is so damn fast it must seem like alchemy to new users, returning instantaneously results that would once have taken long enough that you could get a cup of coffee while you waited.
The new paper offers a pedagogic introduction to wild (cluster) bootstrapping. I’m pleased and honored to have coauthored it with James MacKinnon, Morten Nielsen, and Matthew Webb. James in particular is a giant in the field; he coauthored many of the papers that led to the development of the wild cluster bootstrap (among numerous other methods), as well as a leading textbooks on econometrics.
The new paper also divulges the secrets of boottest’s speed. I think there’s a lesson here about just how much more efficiently mathematical code can sometimes be made to run when you carefully state and analyze the algorithm. And in computationally intensive techniques such as bootstraps, speed can matter.
Revised hookworm replication
After releasing and blogging a paper in December about the GiveWell replication of Hoyt Bleakley’s study of hookworm eradication in the American South, I submitted it to the Quarterly Journal of Economics, which published the original paper in 2007. Around the first of the year, QJE rejected the paper, enclosing comments from four reviewers, including from Bleakley. The comments were very helpful in identifying errors in the replication, suggesting new things to do, and pushing me to sharpen my thinking and writing.
I just posted a new version. The story does not change. As a result, I am more sure now that the relative gains in historically hookworm-burdened parts of the South continued trends that began well before and, in the case of income, continued well after. I made two significant substantive changes, both of which strengthen my skepticism.
Disappointment about the war on worms in the American South 100 years ago
On GiveWell.org, I just blogged a new study revisiting the evidence on whether the campaign in the 1910s to rid the South of hookworm brought major benefits. A great 2007 paper by Hoyt Bleakley suggests that it did: after eradication school attendance rose disproportionately in historically hookworm-heavy areas; and adult earnings of babies born in affected areas also later rose.
The new study revisits Bleakley’s original by reconstructing its database from primary sources, and replicating and revising the analysis. I ended up strongly questioning the original study’s conclusion. These two pairs of graphs show why. The first graph in each pair is from the original study, the second from the new version. The original graphs seem to show jumps in outcomes of interest—school attendance, earnings—but the new ones do not.
More…
Python program to scrape your solar panel production data from Enphase website
# queries Enphase Enlighten username and password
# then downloads panel-level production data for all panels, between dates hard-coded below
# time stamps expressed in Unix epoch time
# inverter ID numbers are not serial numbers; to determine those,
#   go to Devices tab on Enphase Enlighten site, hover mouse over hotlinked
#   serial numbers, and examine associated links
# saves to "Panelproduction.csv"
# prints each date for which data is scraped, along with number of inverters

import requests, csv, os, getpass
from datetime import timedelta, date
from bs4 import BeautifulSoup

start_date = date(2014, 3, 1)
end_date = date(2017, 11, 14)
user_name = input('User name: ')
password = getpass.getpass('Password: ') # this is only working for me in debug mode

os.chdir('C:\\[your csv destination path here]')

with open('Panelproduction.csv', 'w', newline='') as csvfile:
  writer = csv.writer(csvfile)
  writer.writerow(['Time','Inverter','Power'])

  with requests.Session() as s:
    # log in
    html = s.get('https://enlighten.enphaseenergy.com')
    soup = BeautifulSoup(html.text, 'html.parser')
    token = soup.find('input', attrs={'name': 'authenticity_token'})['value']
    payload = {'user[email]':user_name, 'user[password]':password, 'utf8':'✓', 'authenticity_token': token}
    html = s.post('https://enlighten.enphaseenergy.com/login/login', data=payload)

    for date in (end_date-timedelta(n) for n in range(int((end_date - start_date).days))):
      payload = {'date': str(date)}
      data = s.get('https://enlighten.enphaseenergy.com/systems/[your system ID from URL]/inverter_data_x/time_series.json', params=payload).json()
      print (date, len(data))
      for inverter, inverter_data in data.items():
        if inverter != 'date' and inverter != 'haiku':
          for datapoint in inverter_data['POWR']:
            writer.writerow([datapoint[0], inverter, datapoint[1]])
Four points on the debate over the impact of the Mariel boatlift

There’s been more back and forth this week in the argument over whether a giant influx of Cubans into Miami in 1980 lowered wages for low-education people already living there. A seminal 1990 paper by David Card said no. A 2015 reanalysis by immigration skeptic (and Cuban immigrant) George Borjas said yes. A 2015 blog post by me and a paper by Giovanni Peri and Vasil Yasenov said I don’t think so. And now Michael Clemens and Jennifer Hunt, both of whose work appears in my immigration evidence review, have announced the discovery of what they term a flaw in the Borjas analysis. It turns out that just as the Marielitos began arriving, the Census Bureau sharply increased its coverage of black Miamians in the surveys it conducts to monitor the pulse of the U.S. economy. Since black Miamians had especially low incomes, the racial shift had the power to generate the (apparent) wage decline that Borjas highlights. Borjas retorted on Tuesday, labeling the criticism “fake news.”
So, once more, academics are arguing. And concerned observers are confused by the dueling contentions and graphs. In an attempt to clarify, I’ll make a few points.
Disclosures and disclaimers: I used to work for the Center for Global Development, where I was a colleague of Michael Clemens. Now I work for the Open Philanthropy Project, which provides general support to CGD and specific support for Michael’s work on migration. This blog post represents my personal views and does not speak for the Open Philanthropy Project.
Four points:
Worms and more worms

I just finished the second of two posts for GiveWell on the heated academic controversy over whether it is a good idea to mass-deworm children in regions where the parasite infections are common. The first post focusses on the “internal validity” of a particularly influential study that took place along Lake Victoria, in Kenya, in the late 1990s. The second thinks through how safely we can generalize from that study to other times and places. It has a lot more graphs, including some that look pretty wormy…
On the geometric interpretation of the determinant of a matrix

Most econometric methods are buttressed by mathematical proofs buried somewhere in academic journals that the methods converge to perfect reliability as sample size goes to infinity. Most arguments in econometrics are over how best to proceed when your data put you very far from the theoretical ideal. Prime examples are when your data are clustered (some villages get bednets and some don’t) and there are few clusters; and when instruments are weak (people offered microcredit were only slightly more likely to take it).
Mucking about in such debates recently, as they pertain to criminal justice studies I’m reviewing, I felt an urge to get back to basics, by which I mean to better understand the mathematics of methods such as LIML. That led me back to linear algebra. So I’ve been trying to develop stronger intuitions about such things as: how a square matrices can have two meanings (a set of basis vectors for a linear space, and the variances and covariances of a set of vectors); and what the determinant really is.
Murder, I wrote

I have a new post on openphilanthropy.org suggesting that there was indeed an urban crime wave in the US in the last couple of years, but that it was mainly restricted to homicide and assault with a firearm, and may well have peaked last year.
Murder mystery
I started studying the causes and consequences of incarceration for the Open Philanthropy Project. The subject is full of mysteries. Here’s one.
As best we can measure, the US crime rate rose from the mid-1960s to the early 1990s and then reversed:

(Following FBI definitions, this graph is of “Part I” crimes and excludes excludes drug crime, white collar crime, drunk driving offenses, traffic violations, and other minor crimes. The property crime rate is graphed against the right axis, the violent crime rate against the left.)
The strange thing is, the experts aren’t completely sure why the rise and fall. More…
Headwind for the boatlift?
![Mariel_Refugees[1]](https://web.archive.org./web/20200616231416/https://en.wikipedia.org/wiki/Mariel_boatlift#/media/File:Mariel_Refugees.jpg)
In 1980, Fidel Castro suddenly allowed thousands of Cubans to leave the country—if they could find a way out. Americans, many of Cuban extraction, swooped to the rescue by bringing lots of boats to the Cuban Port of Mariel. It was called the Mariel boatlift. Some 125,000 Cubans moved to America in a matter of months and perhaps half settled in Miami.
Some 10 years later, economist David Card viewed the Mariel boatlift as a natural experiment and used it to study how immigration affects wages and employment in the receiving country. He concluded there was not much discernible impact in Miami. His paper is seminal, both for its counterintuitive finding and for its introduction of the natural-experiment approach to the study of immigration’s impacts.
Last month, George Borjas, an economist and Cuban emigré himself, revisited the data and came to opposite to conclusion from Card’s. The boatlift hurt the wages of low-education Miamians.
So I dug into the data. Borjas’s work ended up not convincing me. More on the GiveWell blog.
Coming down to earth: What if a big geomagnetic storm does hit?

The fourth installment in my series on geomagnetic storms is now up on the GiveWell blog.
The first three posts were about the odds of a big storming hitting earth. This one shifts to the question of likely impacts. Mostly I think the evidence is reassuring. But given the stakes, I think we should not relax, and instead support more thorough research.
On the consequences of taxing alcohol

The Open Philanthropy Project just released another big literature review of mine, this one on whether taxing alcohol save lives. I conclude that it probably does.
That’s hardly shocking. Making stuff more expensive generally leads to people to buy less. And alcohol in excess is bad for you. Perhaps the more significant finding is about the number of lives that could be saved, which is not so great next to other things that “Open Phil” might fund. E.g., we dream of financing the invention of a new research technique that leads to a cure for Alzheimer’s. The grant chasing that dream would be a longshot…but then so might be funding advocacy for raising taxes.
Coroners in the US attribute 23,000 deaths/year to alcohol-caused diseases, according to my calculation (see the report for more). The most rigorous studies I found produced a rather wide range of elasticities of death rates with respect to alcohol prices: 1–3. That means each 1% price rise reduces deaths 1–3%. And, if you do the math carefully, tax hikes sufficient to raise alcohol prices 10% would cut the alcohol death rate 9–25%, or 2,000–6,000 lives/year. This math leaves out any reduction in deaths from drunk driving, which currently amount to 10,000/year. The benefit there would presumably be of the same order of magnitude.
A few interesting things I learned and did along the way:
More…
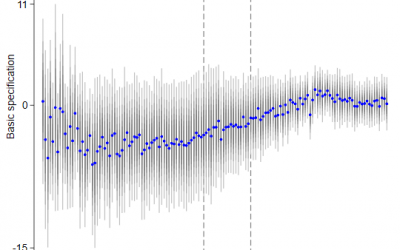
Geomagnetic storms: Using extreme value theory to gauge the risk
My third GiveWell post on geomagnetic storms is up. This one marshalls a branch of statistics called Extreme Value Theory, which I learned about through this work. Last year I wrote a program to bring EVT techniques to Stata.
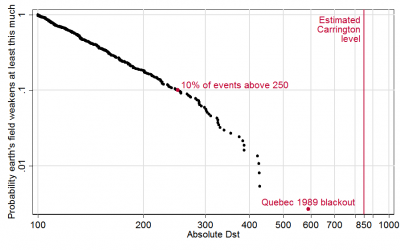
Geomagnetic storms: The “Big One” might only be twice as big as what’s already hit

The second post in my series on geomagnetic storms is up on GiveWell.org. It is arguably the most important and interesting in the series. It explains why I think past storms, reaching back to 1859, were probably at most twice as strong as anything our electricity-dependent societies have experienced in recent decades—and shrugged off.
Do you remember the great storms of 1982 and 2003? I didn’t notice them either. And probably you survived the Québec blackout of 1989, which was mostly over within 11 hours. Yet maybe that last doubling in storm intensity would inflict far, far more than twice as much destruction on the grid. Or maybe the grid has become much more vulnerable since 1989, even though grid operators have learned from that experience. It’s also possible I’m wrong that doubling is the worst we should fear. For all these reasons, I still think the threat deserves more attention from researchers, industry, and governments.
As I mentioned in my previous post, the strongest proponent for the view that the worst case is much worse, is John Kappenman, who has argued for a multiplier of 10 rather than 2. In the new post and the report, I trace this number in part to an obscure book of scientific scholarship written in 1925 by a Swedish telegraph engineer in French. The search involved talking to an electrical engineer in Finland, people at the Encyclopedia Britannica in Chicago (who were very helpful), and ordering said obscure book from a German book shop. Author David Stenquist describes how the storm of 1921 caused copper wires running into a telegraph office to melt—but not iron ones. He deduces that the storm-induced voltage on the line could not have been as high as 20 volts/kilometer. Yet through a scholarly game of telephone over the decades, this observation got turned on its head.
Below is a key section I scanned from the book’s yellowed pages. For more, read the post or the report.
Geomagnetic storms: Don’t panic
![popscise[1]](https://web.archive.org./web/20200616231416/https://en.wikipedia.org/?title=Geomagnetic_storm#/media/File:Magnetosphere_rendition.jpg)
My long-promised report for the Open Philanthropy Project on geomagnetic storms is posted. (Data, code, and spreadsheets are here.) The first of a series of posts based on the report just appeared on the GiveWell blog.
This has been one of the most fun projects I’ve worked on because it slices across so many disciplines, from statistics to power engineering to astrophysics. My grasp of those subjects declines in the order listed…but I think I learned enough to reach a preliminary assessment.
The risk that a major solar cataclysm could so disrupt the earth’s magnetic field as to deprive continent-scale regions of power for years looks low to me—lower than the most attention-getting voices, almost by definition, have suggested (Pete Riley, John Kappenman). Nevertheless, a long-term, large-area blackout would do so much harm, and the risk is so poorly studied, that it absolutely deserves more attention from researchers, industry, government, and philanthropies. My preliminary risk assessment could be wrong.
I just discovered that an elite, independent scientific advisory group for the US government arrived at a similar conclusion in 2011.
It follows that the most emphatic analysts, even if they have overshot, have done a service by drawing attention to the issue. This is for me a familiar paradox.
 Senior Advisor to the


