Features
StatCounter is packed full of useful and powerful tools to help you make better decisions about your website. A list of many of our features is below - just click on a feature for more detail (and check out the Live Demo for a hands-on look!).
Remember, unless otherwise stated, all these features are part of our free service!
- Log-Size
- Invisible Counter Option
- Configurable Counter
- Configurable Summary Stats
- Magnify User
- Drill Down
- Popular Pages
- Entry Pages
- Exit Pages
- Came From
- Keyword Analysis
- Recent Keyword Activity
- Search Engine Wars
- Visitor Paths
- Visit Length
- Returning Visits
- Recent Pageload Activity
- Recent Visitor Activity
- Country/State/City Stats
- Recent Visitor Google Map
- ISP Stats
- Browser Stats
- O.S. Stats
- Resolution Stats
- JavaScript Stats
- Email Reports
- Multiple Site Management
- User Access Management
- Public Stats
- Blocking Cookie
- HTTPS Tracking [Upgraded Members Only]
- Custom Branding Logo [Upgraded Members Only]
-
Log-Size
StatCounter offers 2 levels of analysis - simple summary statistics for all your pageloads, unique, returning and first-time visitors, and highly detailed analysis of a smaller number of your latest pageloads. This highly detailed analysis is limited to a smaller number of pageloads because it is highly resource intensive. Your log-size determines how many of your last pageloads are included in this detailed analysis. The free service offers a log-size of 500 - if you require more, upgrades are available (see the pricing page for more details). Back to Top
-
Invisible Counter Option
StatCounter allows all users to install an invisible counter on their site. This is important if you wish to include StatCounter code on your site without it interrupting the design of your site. Back to Top
-
Configurable Counter
If you wish to have a visible counter on your site, we offer a number of ways to customise its look to best suit your site's design. You can set the font size and color, the background color, and whether to display pageloads or unique visits. A visible counter will allow visitors to your site view your total pageloads or unique visits to date. Back to Top
-
Configurable Summary Stats

These stats are designed to show at a glance how many pageloads, unique visits, returning visits and first time visits your site has received to date. They can be configured to display data of specific interest in a number of different ways. You can:
- display summary stats per day, week, month, quarter or year
- display summary stats for a specific date range or period
- display summary stats using bar graphs or area graphs
- toggle on and off pageloads/unique/returning/first-time data
-
Magnify User
While browsing recent visitors, you can use the magnify tool, you can 'zoom in' on individual visitors:

You'll be presented with a plethora of information such as where they are from, their system settings, what link referred them to your site and their navigation path through your site:
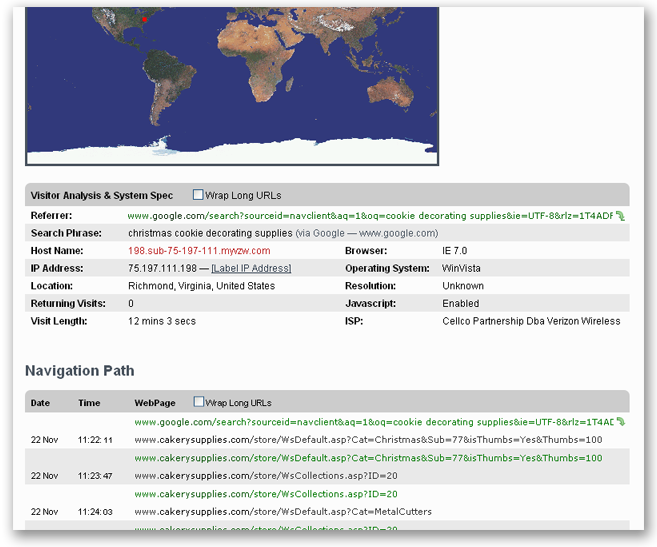
This kind of valuable detail is available to you as soon as you register a StatCounter account - or you can try out the demo here and have a look!
-
Drill Down
Drill Down is a very powerful tool, and one of the most advanced features StatCounter offers. It allows you to drill down on your stats and view visitors relating to them - because you can drill down on many of the stats StatCounter offers, it's difficult to provide a comprehensive example, but here's one way in which this can be used:
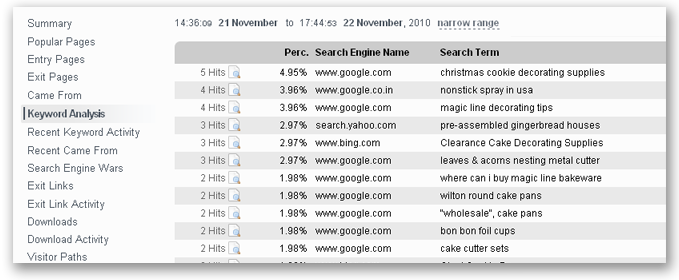
If you go to Keyword Analysis for example, you'll be presented with something like the following:

We've marked the entry for the keyword 'magic line decorating tips' - by clicking the page magnifying glass you drill down on that keyword to show all visitors who used that keyword in a search engine to find your site:
And, of course, you can then click on the Magnify User icon to get a detailed report on the user and their navigation path through your site!
This is just the tip of the iceberg. You can drill down on many stats, including Popular Pages, Referring Links, Entry and Exit pages and so on. For example, you could drill down on a page of particular interest - like a checkout page - and see the visitors who loaded that page, and subsequently magnify them to see how they got there. This kind of information is invaluable for optimising your most important pages and driving traffic to them - a combination of the drill down and magnify tools is the wise webmaster's most potent ally!
-
Popular Pages

This tool allows you to see the pages of your site ranked by popularity. This information is important to allow you to identify the most heavily visited pages, and optimise them for maximum impact. It can also help you discover potentially important pages which are getting overlooked - this could indicate poor navigation structure or linking to that page. Of course, you can drill down on your Popular Pages to see which visitors loaded them, and magnify those visitors for more detail.
-
Entry Pages
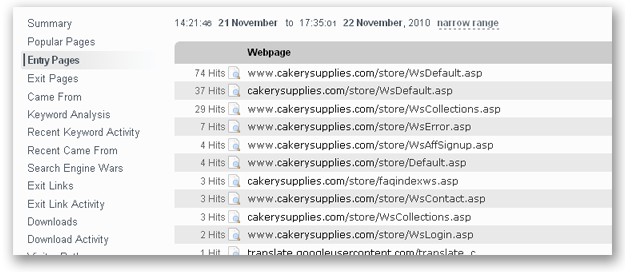
An entry page is the first page a visitor arrives at when they visit your site. There are often a lot more of these than just your homepage! It's important that the first page a visitor loads on your site makes a good impression, and this tool can help you identify which pages are the most commonly used entry pages. It can also highlight pages you did not expect to be entry pages, which you can subsequently optimise to keep a visitor on your site and drive them to your key pages. You can also drill down on your entry pages to show the visitors who entered on them, and magnify those users to find out how they got there.
-
Exit Pages
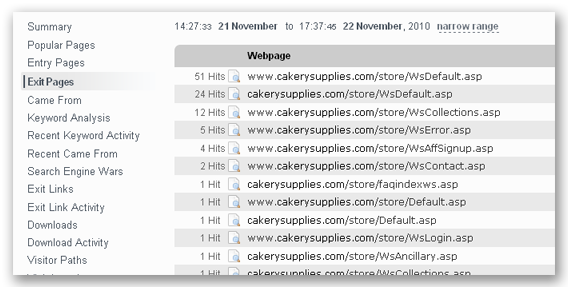
Opposite to the entry pages, are exit pages - pages your visitors use to leave your site. No webmaster needs to be told the importance of knowing where their visitors are abandoning their site! This tool shows you the most common Exit Pages, allowing you to optimise those pages to keep visitors on your site.
-
Came From

This is one of the most important stats for any webmaster. This tool allows you to see how your visitors are finding your site, and where they are coming from. This can help you identify, for example, links on other sites that are working and those that aren't, and help you trace where people are referring to your website.
-
Keyword Analysis
Traffic from search engines is the lifeblood of most websites, and many webmasters are familiar with the importance of ranking high in search engines for keywords relating to their site. This tool allows you to view the keywords used to reach your site, ranked by their popularity. This can help you identify keywords that are working, and those that aren't, so that you can optimise accordingly. For example, if you know a particular keyword is generally very popular for your type of site, but StatCounter indicates that it ranks low among the keywords used to reach your site, then there is an opportunity there to optimise for that keyword and generate more traffic from it.
You can also group keywords according to the search engine used, to focus in on results from specific engines.
Of course, you can also drill down on a keyword to view specific visitors who used that keyword, and magnify them for more detail.
-
Recent Keyword Activity

This tool features up-to-the-second reporting of keywords used to reach your site, the visitors who used them, and which search engine was used. The most recently used keywords appear toward the top. You can click the magnify button to view more detail on the visitor who used that keyword.
-
Search Engine Wars
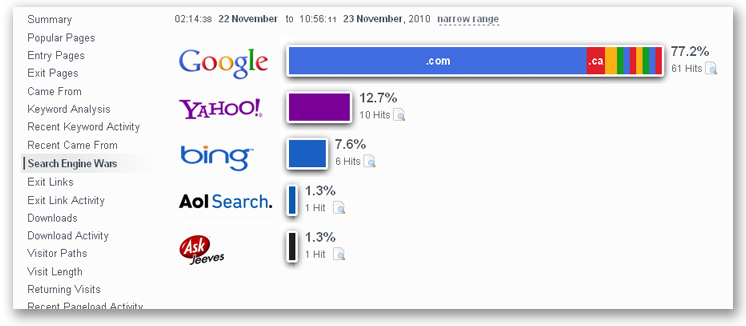
This tool allows you to see which search engines generate the most traffic for you. This can be useful in determining if your site is performing as well as it should be in specific engines, or if certain important engines are missing. For example, if Google made up only a small percentage of search engine traffic to your site, it's a good bet there's room for improvement for your site on Google!
You can also drill down on a specific search engine to view individual visitors that came from that search engine - and of course, you can magnify those visitors for more detail.
-
Visitor Paths

This tool shows you recent visitors to your site, and the navigation path they took through your site. You can use this to identify common visitor behaviour, or unusual navigation paths that may indicate a problem with your site.
-
Visit Length
This tool shows you how long your visitors are spending on your site - find out what percentage of your visitors stay for various periods of time. This stat is important, as it can help you determine how much 'pull' your website has for visitors - if your visit length is typically low, you may wish to find improved ways to keep your visitors on your site for longer.
You can drill down on specific visit lengths to view those visitors who stayed for different periods of time - drilling down on short visit lengths and magnifying those visitors will show their navigation path, which may help identify why they only stayed a short time.
-
Returning Visits
Every website ideally would like their visitors to come back again and again - this tool identifies what percentage of your visitors are returning (and how many times they've returned), and how many are visiting for the first time. If a very low percentage of your traffic is from returning visits it may be useful to identify ways to encourage repeat visits and loyalty from your users.
-
Recent Pageload Activity
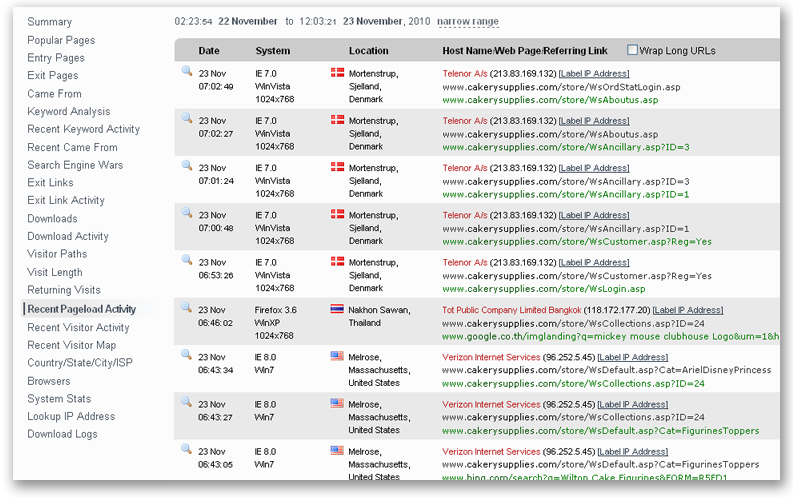
This tool shows you the latest, up-to-the-second pageloads on your website. It displays the most recent pageloads, some details about the visitor that made them, and allows you to magnify for even more detail on that visitor.
-
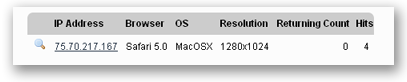
Recent Visitor Activity

This tool is similar to Recent Pageload Activity, but instead of displaying recent pageloads, it displays your latest visitors, who you can subsequently magnify for more detail.
-
Country/State/City Stats
These stats allow you to identify the geographical location of visitors to your site. Asides from the fun of seeing all the different places your visitors come from, this tool can be useful in identifying if you need to be catering more toward international visitors. For example, if a large number of visitors are coming from another country, it may be worth investigating translated versions of your site, or whether you should accepting that country's currency (if you're an eCommerce website).You can also view the State or Regions of your visitors, and the cities they come from.
Of course, you can also drill down on countries, states and cities to show and magnify individual visitors from those places.
-
Recent Visitor Google Map

The recent visitors to your website are plotted as markers on a Google map. This gives instant visual feedback about the location of your visitors worldwide. Each marker is expandable to give more information about when and how that particular visitor found your website, what webpages they navigated through and how long they spent on the website. The ability to easily zoom in and out on the marker is also available.
Click here for a Live Demo of the Recent Visitor Google Map!
-
ISP Stats
This tool shows you the ISPs used by your visitors, ranked by popularity. You can drill down on an ISP and show visitors who use that ISP.
-
Browser Stats

This is an important tool that lets you see which browsers your visitors use to view your site, and which are most popular. Your site may look great in one browser, but does it look good in the browsers used most frequently by your visitors? See which ones you should be checking with this tool.
You can also expand a particular browser to see which versions of the browser are most popular:

As always, you can drill down on specific browsers for more detail on the visitors who use them.
-
O.S. Stats
This tool shows you which operating systems your visitors use, and ranks them according to popularity. This tool may be useful in determining the technical background of your audience by the types of operating system they use.
You can also drill down on an operating system to view specific visitors who use it.
-
Resolution Stats
This tool identifies the display resolutions used by your visitors ranked by popularity. This can be very useful in ensuring your site looks its best for the majority of your users. For example, if most of your visitors are using 800x600 and your site is optimised for a 1280x720, it may make sense to revise your site's design to accommodate the majority of your users on the lower resolution!
Furthermore, you can drill down on specific resolutions to see and magnify indivdual visitors using those resolutions.
-
JavaScript Stats
This tool identifies the percentage of your visitors that have JavaScript enabled in their browsers. JavaScript can be embedded in webpages to introduce dynamic content, but if some of your users do not have JavaScript enabled, it may be worthwhile ensuring your site is still accessible to them.
-
Email Reports
Want to have summaries of your stats sent to your email account? We can send email reports every week and every month featuring a summary of your pageloads, unique, returning and first time visitor stats. You can have your report sent to multiple users on your account, or CCed to other email addresses.
Upgraded members can also receive daily email reports featuring a summary of pageloads, unique, returning and first time visits for the previous day, as well as summarised Keyword and Came From stats.
To set up an email report; login to your account. Click the
 icon beside your project. Click "Add New Report" and fill in the form.
Back to Top
icon beside your project. Click "Add New Report" and fill in the form.
Back to Top -
Multiple Site Management
StatCounter offers the ability to manage multiple websites from one account - no need to sign up for different accounts for different websites! Just create new projects for each of your sites, and you can manage your stats for them all from one account.
To use this feature login to your StatCounter account. Click "Add Project" above your current project(s) and follow the wizard as before. Do not register a new account! Back to Top
-
User Access Management
User Access Management allows you to provide access to your account for multiple other users. You can limit access to allow additional users to only view statistics for your projects, or only specific projects.
To use this feature. Login to your account. Click the lock icon
 beside your project name. Tick or untick the users you want to have access to this project. To add more users click "Users" in the top navigation bar.
Back to Top
beside your project name. Tick or untick the users you want to have access to this project. To add more users click "Users" in the top navigation bar.
Back to Top -
Public Stats
Public stats allows you to show your website stats to the whole world, unlike User Access Management which gives you a specific username and password to allow one individual to see your stats.
To enable/disable public stats. Login to your account. Click the lock icon
beside your project name. Tick or untick the box to "Enable public stats". The link provided
http://statcounter.com/project/standard/stats.php?project_id=XXXXXX&guest;=1
is your public stats link. You can link to specific stats such as the "Came From" by changing the link slightly to
http://my.statcounter.com/project/standard/camefrom.php?project_id=XXXXXX&guest;=1 Back to Top -
Blocking Cookie
A blocking cookie is a cookie that's stored in your own browser to prevent your own visits to your websites from being logged by StatCounter - this ensures that your sites' stats are not skewed by your own visits. This can be set and unset at will.
To use this feature. Login to your account. Click the "Blocking Cookie" link above your list of projects. Click the button to block or unblock your visits frombeing recorded. Back to Top
-
HTTPS Tracking [Upgraded Members Only]
If you run a secure site using a secure sockets layer (SSL) your https traffic will only be recorded if you have an upgraded account. Back to Top
-
Custom Branding Logo [Upgraded Members Only]
Upgraded members have the option to disable the banner ads on the StatCounter, and also to replace them with their own custom banner. So, for example, if a number of people who work for your site have access to your StatCounter account, you might want to put your own logo in place of the banners. Back to Top