Preparing for the 2020 Census: Measuring Race and Ethnicity in America

Bookmark and Share

By John H. ThompsonDSC_0031

The year 2020 may seem a long way away, but we’re already in full swing preparing for the next decennial census. Today, we held an operations update to announce some of the steps we’re taking to ensure that the 2020 Census provides the highest-quality statistics about our nation’s increasingly changing population, such as how we measure race and ethnicity.

One challenge we face is how Americans view race and ethnicity differently than in decades past. In our diverse society, a growing number of people find the current race and ethnic categories confusing, or they wish to see their own specific group reflected on the census. The Census Bureau remains committed to researching approaches that more accurately measure and reflect how people self-identify their race and ethnic origin.

During the 2010 Census, most households received a census form that asked about race and Hispanic origin through two separate questions. However, we also conducted a major research project – called the “2010 Census Race and Hispanic Origin Alternative Questionnaire Experiment” (AQE) – to better understand how and why people identify themselves in different ways and in different contexts.

The AQE tested different questionnaire strategies with four goals in mind:AQE_Graphic1

  1. Increase reporting in the race and ethnic categories as defined by the U.S. Office of Management and Budget,
  2. Increase responses to the race and ethnicity question(s),
  3. Increase the accuracy and reliability of the results, and
  4. Elicit detailed responses for all racial and ethnic communities (e.g., Chinese, Mexican, Jamaican, Lebanese, etc.).

The results of the AQE supported all of these objectives. One of our experimental approaches asked about race and Hispanic origin in one combined question. In the combined question, each major racial and ethnic group had a checkbox with examples and a write-in line where respondents could provide detailed responses. Many individuals across communities liked the combined question approach. They felt it presented equity to the different categories.

Some of our findings from this experiment include:AQE_Graphic2
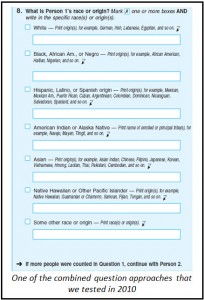
  • Combining race and ethnicity into one question did not reduce the proportion of Hispanics, Blacks, Asians, American Indians and Alaska Natives, or Native Hawaiians and Other Pacific Islanders.
  • The combined question yielded higher response rates.
  • The combined question increased reporting of detailed responses for most groups, but decreased reporting for others.
  • The combined question more accurately reflects self-identity.


You can check out the AQE website for more information on our findings, and to see what the AQE questions look like.

The AQE’s results led to some promising strategies to address the challenges and complexities of race and Hispanic origin measurement and reporting. We have a lot to consider as we make decisions for the 2020 Census. In order to make the best decisions possible, we are embarking on mid-decade research with both the combined question and separate questions approach. We’re also engaging in an ongoing discussion about race and ethnicity among statistical agencies and various population stakeholder groups. Together, these discussions and research will enable us to provide the most accurate, reliable, and relevant data possible about our changing and diversifying nation.

Over the next few weeks, I’ll blog about additional topics that we addressed at that event.

Posted in Uncategorized | Leave a comment

Happy Manufacturing Day!

Bookmark and Share

By John H. Thompson

Did you know that October 3 is Manufacturing Day? Today’s observance recognizes the major role that manufacturing plays in our economy – and the world’s economy. U.S. manufacturers produce nearly $6 trillion in shipments a year and employ Americans across the nation. A major source of statistics on manufacturing is the Industry Reports, based on the 2012 Economic Census. These reports on 364 manufacturing industries show statistics on employment, payroll, receipts, value of shipments, expenses, assets, and a host of other topics.

Manufacturing as a Share of Employment of the Civilian Employed

So, what does the 2012 Economic Census tell us about manufacturing?

  • The total value of shipments for the automobile manufacturing industry was $108.8 billion in 2012, up 28.4 percent from $84.7 billion in 2007.
  • The nation employed 49,208 people in 456 soft drink manufacturing establishments. Over $22.1 billion in shipments of carbonated drinks and $13.9 billion of noncarbonated drinks were manufactured in the U.S.
  • Electric household ranges, ovens and surface cooking units comprised 57.2 percent ($2.5 billion) of the total value of household cooking appliance shipments in 2012; 26.3 percent of units ($1.1 billion) were fueled by gas.
  • Guided missiles and space vehicle manufacturers had 46,012 employees and shipments of $19.3 billion.
  • The total value of shipments of semiconductors and related device manufacturing was $70.7 billion. Of this total, microprocessors made up 58.6 percent ($41.4 billion).

Detailed statistics from the Economic Census will provide every state and community with an economic profile to assist planners, businesses and entrepreneurs create new jobs across the nation. The U.S. Census Bureau collects statistics year-round on the manufacturing sector of our economy; these statistics help manufacturers learn about their industries and communities and help them grow their businesses.

You can check out the Census Bureau’s monthly manufacturing indicator – and a host of other measures of economic activity – by downloading our America’s Economymobile app to your Apple or Android device. You can also visit our Economy topic page to learn more about the 2012 Economic Census and many other economic statistics – and be sure to check out our infographic on U.S. manufacturing.

Posted in Uncategorized | 1 Comment

The Survey of Business Owners and Self-Employed Persons Is Key to Explaining America’s Economy

Bookmark and Share

By John H. Thompson

Did you know that there are 27.1 million non-farm businesses in America? The U.S. Census Bureau’s Survey of Business Owners and Self-Employed Persons  provides the only comprehensive source of statistics about business ownership in the U.S. The Census Bureau conducts the SBO every five years.  This is the first time the SBO is being conducted primarily online.

If you own a business, such as a salon or a landscaping company, you may be one of the one million Americans selected to participate in the Survey of Business Owners. Even if you do not have employees other than yourself, we want to hear from you. By participating online now, you can help provide consistent, comparable, and comprehensive statistics on U.S. business performance. For example, the 2007 SBO showed us that 5.9 percent of responding firms reported income from e-commerce – an important insight into how the Internet is shaping our economy.

Right now we are in the process of asking respondents to fill out the Survey of Business Owners,  which is part of, and benchmarked to, the 2012 Economic Census. We begin the Survey of Business Owners after the data collection phase of the Economic Census is complete. It provides information every five years on business characteristics (e.g., if a business is home-based, or how much start-up capital it received) and owner characteristics (such as gender, race and ethnicity, and veteran status) for businesses of all sizes across America.

Businesses of all sizes are crucial to the U.S. economy and having quality statistics on businesses is critical. Some of the ways that government leaders and others use SBO statistics include:

  • Business owners are able to analyze their operations in comparison to similar firms, compute their market share, and assess their growth prospects.
  • Entrepreneurs can make informed decisions about what types of products and services to sell, and where to sell them. They can also use SBO data in business plans and loan applications.
  • The Small Business Administration can assess business assistance needs and allocate available resources.
  • Local government commissions are able to establish and evaluate contract procurement practices.
  • Federal, state, and local government agencies have a framework for planning, directing, and assessing programs that promote veteran-, women-, and minority-owned businesses.
  • Researchers can analyze long-term economic and demographic shifts, and differences in ownership and performance among geographic areas.

Although some Census Bureau surveys have given respondents the option to reply via the Internet, the 2012 SBO is the first to utilize the Internet as the primary form of response. I’m pleased that the Census Bureau has embraced the use of technology to make responding to surveys, like the SBO, easier for you.

If you received a letter about Survey of Business Owners and Self-Employed Persons, it included instructions for filling it out online. If you have questions, I encourage you to call 1-888-824-9954, Monday – Friday, 8 a.m. to 6 p.m. Eastern Time, for more information. Our staff can answer any questions about the survey you may have. Visit our website to learn more:https://econhelp.census.gov/sbo.

Posted in Uncategorized | 1 Comment

Back to School – Introducing the Statistics in Schools Program

Bookmark and Share

By John H. Thompson

A lot of our work at the Census Bureau looks toward the future – next year’s American Community Survey, or the decennial Census in 2020, for example. One exciting forward-looking initiative is our Statistics in Schools (SIS) program.  Research shows that jobs related to statistics are expected to increase by more than 25 percent over the next decade, and SIS is part of our efforts to help make sure students are prepared for them.

Statistics in Schools supports statistics education by providing grade-appropriate classroom activities in math and history, and many resources – such as maps, news articles, videos, infographics, and games – for K-12 teachers to use. Staff from all areas of the Census Bureau worked together to create these activities, which are available online at no charge.  Some examples of the activities teachers can find are:

  • Tools for identifying the demographics of specific states and metro areas.
  • Activities to analyze information correlating income to educational attainment.
  • Specific data, such as the number of single-father households, vehicles per household, and salary based on industry sector.
  • Worksheets to graph state population demographics.
  • Activities for estimating how many people in the U.S. walk to work.

DirBlog_SIS

The activities are aligned to national standards, including Common Core State Standards and the UCLA National Standards for History. They aren’t intended to replace existing curricula, but rather complement existing lesson plans.

We have teamed up with subject matter experts from the American Statistical Association, the National Geographic Society, the National Council of Supervisors of Mathematics, the National Council of Teachers of Mathematics, and many others to vet and evaluate SIS materials.

This summer, we are receiving feedback on the SIS website and activities from 350 teachers nationwide. Starting this fall, more than 135 teachers have volunteered to participate in the SIS Early Adopter program; they will use SIS activities in their classrooms in their upcoming school year to collect feedback and improve the program. Early adopters will report on how they used SIS materials and which materials were effective.  Based on what we learn from early adopters and their students, we’ll make improvements before we introduce the program nationwide.

Thank you to these forward-thinking educators and partners, as well as the Census Bureau staff who made Statistics in Schools possible. They are committed to making sure that students master the skills required to thrive in an increasingly data-driven world, and we are thrilled to support them.

Posted in Uncategorized | 1 Comment

Measuring Health Insurance Coverage

Bookmark and Share

Written By John H. Thompson

Yesterday, I participated in an event hosted by the Census Bureau and the National Center for Health Statistics on federal statistics on health insurance coverage. One of the key topics we discussed at the event was methodological changes to the 2014 Current Population Survey (CPS) Annual Social and Economic Supplement (ASEC) and the statistics from that survey, which will be released in September.

I am committed to engaging the public on the methodology and the results of our surveys, so I’m glad we had the opportunity to co-host yesterday’s discussion and answer questions on our health insurance coverage statistics. If you weren’t able to attend the event in person or via live streaming, let me update you on what we discussed.

At the Census Bureau, we are constantly working to ensure our data are relevant, and accurately measure major changes in society. With this in mind, we designed the recent changes to the CPS to better measure health insurance coverage. The changes will provide a good baseline for coverage before the Affordable Care Act (ACA) went into effect, so that we can assess the impact of the law after it is in effect. Research shows that some CPS respondents who had health insurance coverage did not report it during the survey interview. This resulted in higher estimates of uninsured than from other sources. I believe the new questions will improve our measurement of health insurance coverage.

We administer the CPS every year in the early spring, and ask respondents about the prior calendar year. The new questions provide more accurate, precise, and detailed measurement by asking the questions in a manner that is easier for the respondents to answer. We begin by asking respondents about their current coverage, and whether it started before or after January of the prior year. Follow-up questions determine if the coverage was continuous; if not, whether there was any other kind of coverage during the gaps; and whether there was any additional coverage during that time. The CPS now includes additional questions to provide information on health insurance exchanges and marketplaces.

By instituting these changes now, the Census Bureau will have one year of data (2013) as a baseline. Next year, we can compare this baseline with the data about coverage in 2014, the first year of implementation of the ACA, to see what effects the Act has had.

The Census Bureau implements changes in questions to improve accuracy, and we base all changes on research, testing, and peer review. The Census Bureau implemented these changes based on more than a decade of research, which indicated that respondents often had difficulty recalling whether they had health insurance coverage and the type of coverage for a calendar-year period.

There is rarely an ideal time to make changes in the CPS, because they usually result in difficulties with year-to-year comparisons. We timed these changes to provide an accurate baseline of coverage before the effective date of key provisions of ACA. If we had waited another year – collecting this data for the first time in 2014 – the data would not show the effect of the ACA. Next year, once we have collected the CPS data about 2014, we will be able to provide estimates of year-to-year change in coverage using a consistent methodology.

Posted in Measuring America | Tagged , , | 1 Comment