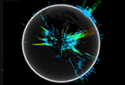
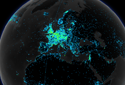
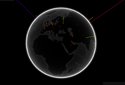
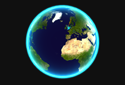
The WebGL Globe
The WebGL Globe is an open platform for geographic data visualization. We encourage you to copy the code, add your own data, and create your own.
If you do create your own globe, please share it with us. We will post our favorite links below.
Features:
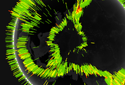
- Latitude / longitude data spikes
- Color gradients, based on data value or type
- Mouse wheel to zoom
- More features are under development...
Not working? This is a WebGL experiment,
so try running it with Google Chrome.
Created by the Google Data Arts Team.
-
Global Sentiment Analysis
Harrison Kinsley
-
Meteorite Landings
Maulik Kamdar
-
GitHub User Locations
Lane Aasen
-
World's Busiest Airports
Milomir
-
Global Terrorism
Stephanie Kao
-
2012 US presidential election across social media
Tom Maiaroto
-
World Elevation
Wang Zhifang
-
Workouts from Endomondo's activity feed
Vojtech Kral
-
Geotagged Wikipedia Articles
Denny Vrandecic
-
China population & US population
Wang Zhifang
-
St. Lawrence Observations
Daniel Léonard
-
World Poverty Index
Javier de la Rosa
-
Last day, week or month earthquakes
Simon Gruau
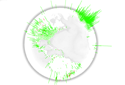
-
World Tree Cover
Christina Bergey
-
International Students in the USA
Danny Newman
-
Earthquakes by Magnitude
Jaime Guaman
-
20 Economic Data Sets
Guillermo Presti
-
Reddit Traffic to 3rd Neil deGrasse Tyson AMA
Darien Acosta
-
Google+ User Location
Pierrick Caen
-
CO2 Emissions
Jonathan Alpers
-
Lovefre.sh Check-ins
James Wigger
-
Global Internet Application Throttling
Tony Blank
-
1.USA.gov URL Shortener Traffic
Shreyas Karnik
-
Twitter Emotion Globe
Makis Tracend
-
Hello World
Scott Frankel
-
ShopSavvy Scans
ShopSavvy
-
Twitter Korean Index
DongWoo Lee
-
Latest Earthquakes, with Auto-Updating
Gustavo Tandeciarz
-
Global Incomes
Osvaldo Mena
-
Spanish Election Results (May 2011)
javisantana
-
Emotional States of Aging Bloggers
Scott Murray
-
Distribution of T-Coffee Web Server Users
Paolo Di Tommaso
-
Google Technology User Groups: Meeting Locations
Luis Montes