


Climate change
Australian climate change monitoring and projections


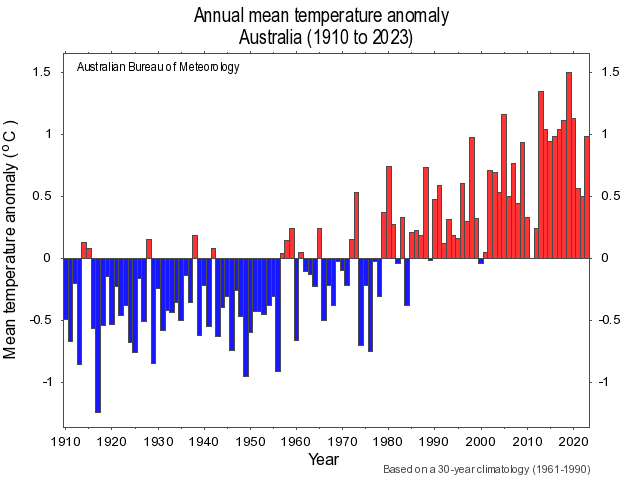
Australian trends


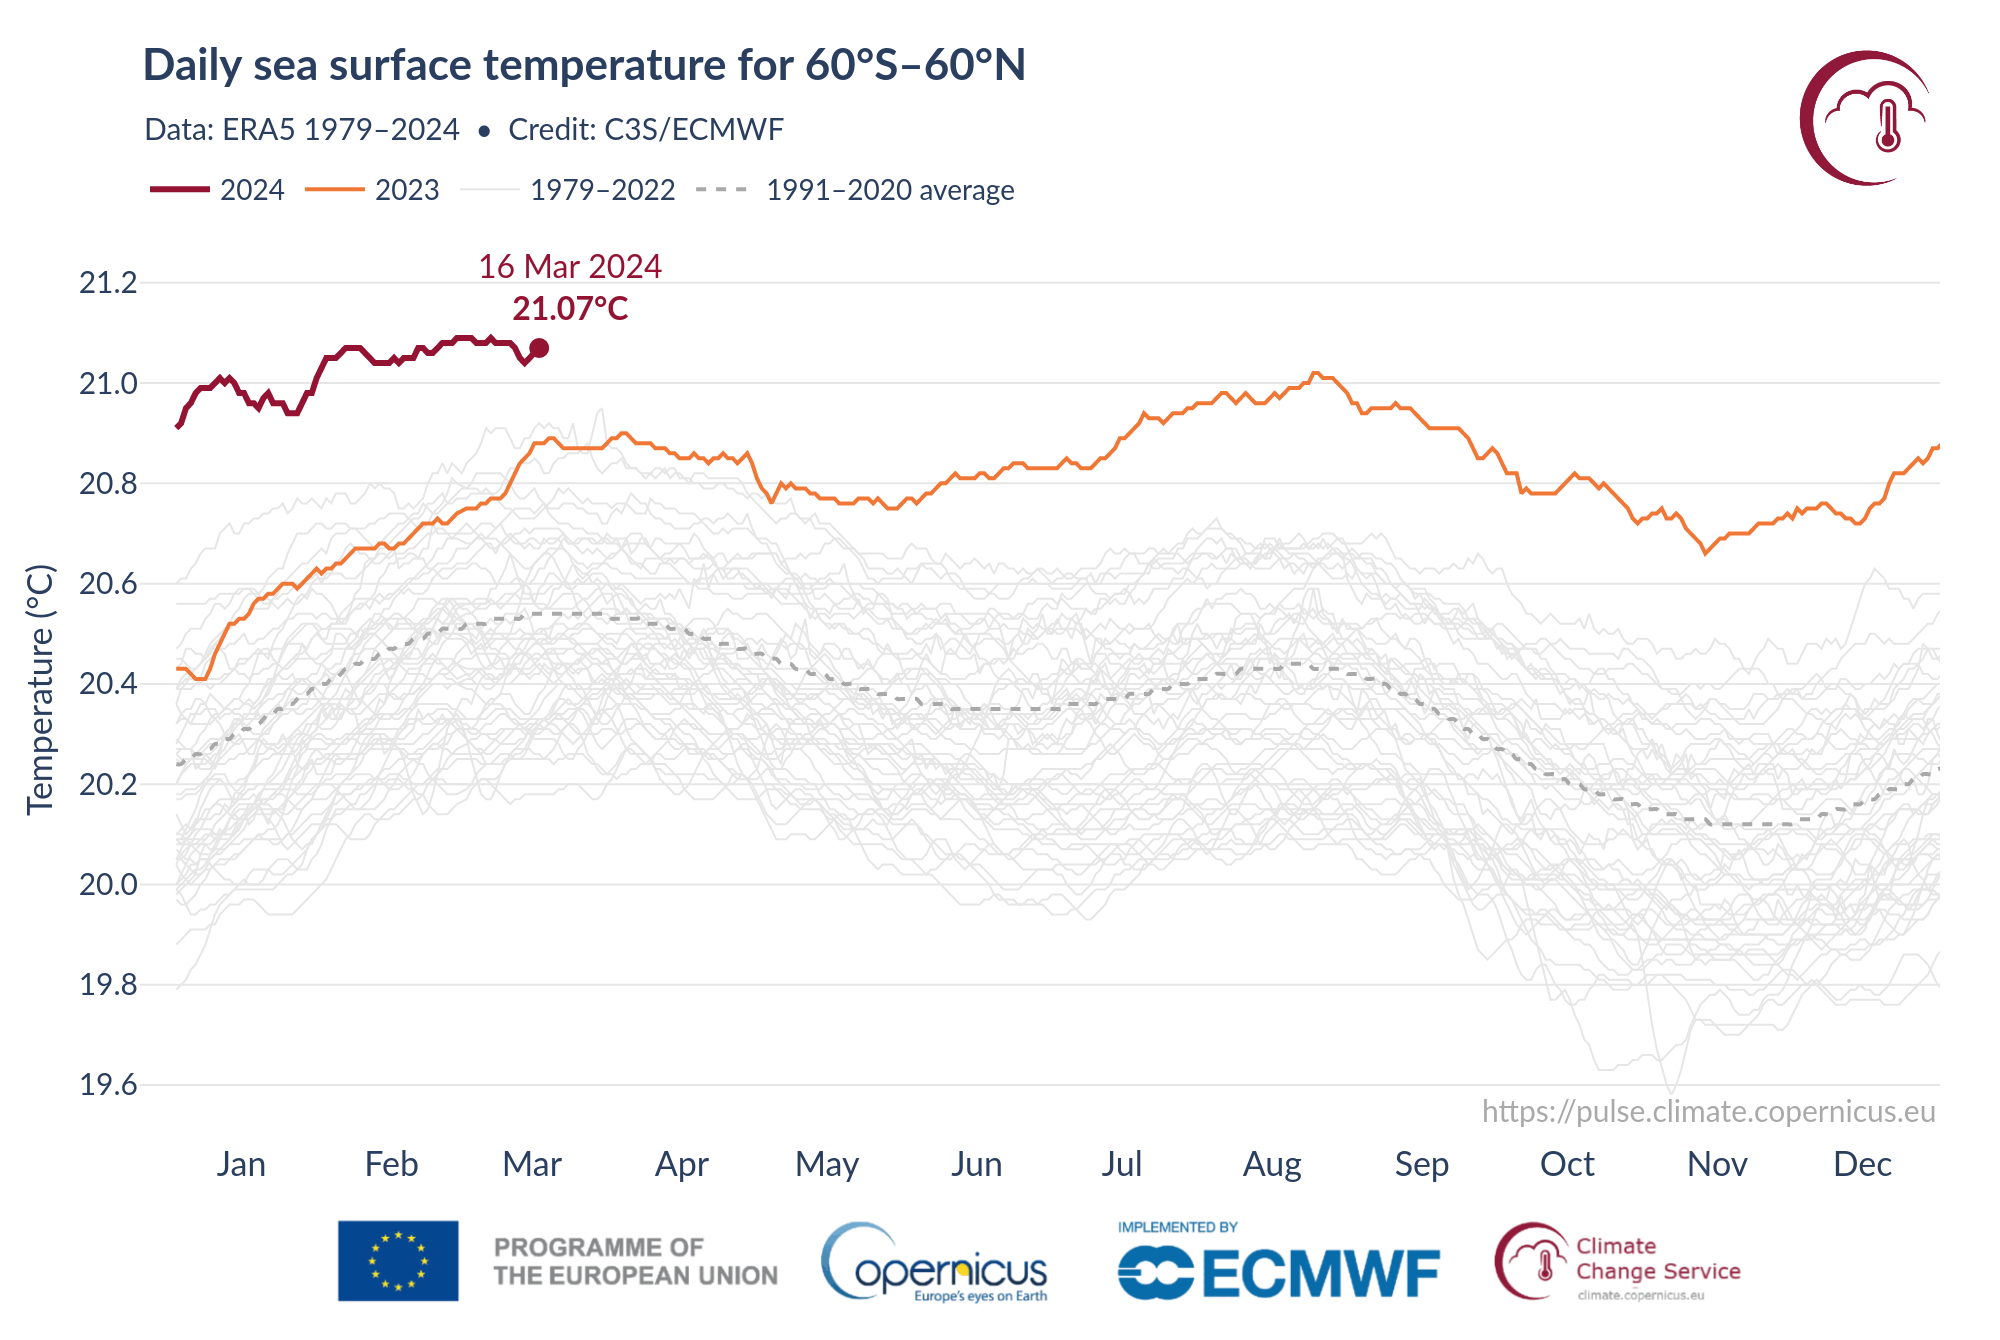
Global trends

 Climate change analysis requires datasets that not only cover a long span of time, but are also homogeneous through time. A homogeneous climate record is one in which all observed climate variations are due to the behaviour of the atmosphere, not other influences, such as changes in location, exposure of the observation site, instrumentation type or measuring procedure.
Dedicated datasets, carefully curated from weather station sites with long-records and subjected to complex quality control to address inconsistencies and errors, have been developed for this purpose.
Climate change tracker uses the Australian Climate Observations Reference Network – Surface Air Temperature (ACORN-SAT) dataset (temperature) and other high-quality datasets (rainfall, cloud amount and pan evaporation).
| Temperature | Rainfall | Pan evaporation | Cloud amount |
|---|---|---|---|
ACORN-SAT employs sophisticated analysis techniques and takes advantage of newly digitised observational data to provide a temporally homogenised daily temperature record. This dataset consists of a network of over 100 stations, with data for more than half of these stations starting in 1910. Daily, monthly, seasonal and annual data are available. |
Daily and monthly rainfall datasets are available, with data from 1900. The daily rainfall network is a subset of the monthly rainfall network and includes merged series (using combined observations from more than one station) and some shorter series. Consequently, monthly, seasonal and annual rainfall data are available for many more sites than for daily rainfall. |
The pan evaporation dataset contains homogenised observations from a network of 60 stations. Data are available at a monthly timescale, commencing from 1970. |
Homogenised total cloud amount data are available at a monthly timescale for a network of 165 stations. The dataset is based on observations of 9am and 3pm total cloud amount, with data at most sites available from 1957. |
Australia
Climate Change In Australia
Department of Environment: Climate change
Climate change and the Australian coast
Global
World Meteorological Organization
Intergovernmental Panel on Climate Change (IPCC)
- Global climate observing system
- Intergovernmental Panel on Climate Change (IPCC) IPCC Sixth Assessment Report
Related data


![]() Unless otherwise noted, all maps, graphs and diagrams in this page are licensed under the Creative Commons Attribution 4.0 International Licence
Unless otherwise noted, all maps, graphs and diagrams in this page are licensed under the Creative Commons Attribution 4.0 International Licence
