
Fresh audio product: Israel expands its war, Zionists appropriate “safety” discourse, the shipping industry and the Baltimore bridge disaster
Just added to my radio archive (click on date for link):
April 4, 2024 Trita Parsi explains why Israel is trying to expand its war to Iran and Hezbollah • Natasha Lennard analyzes the Zionist appropriation of leftish “safe space” discourse • Stefan Yong explores the structure of the global shipping industry in light of the Baltimore bridge disaster
Fresh audio product: Shoah after Gaza, valuing care work
Just added to my radio archive (click on date for link):
March 28, 2024 Pankaj Mishra, author of this article, on the propaganda-induced debasement of the Holocaust • Nancy Folbre, one of four authors of this report, on assigning a monetary value to care work
Fresh audio product: AIPAC, Schumer and ICJ in Israel, why are the youth troubled?
Just added to my radio archive (click on date for link):
March 21, 2024 David Moore on how AIPAC is using GOP contributors’ money to go after progressive Dems • Meron Rapoport on how Schumer and the ICJ are being received in Israel • Jamieson Webster on the social aspects of mental disorder among the young
NYC is not a killing field
I have a weakness for the New York Post. Their politics are odious, but damn, they’re very skilled practitioners of the tabloid arts. Right now, though, they’re trying to convince New Yorkers—with some success, alas—that we’re in the midst of a horrid crime wave. Just as I was typing that, I got a notification from the Post on my phone reporting that four students were slashed in a fight inside a high school. The paper is tireless in its fearmongering.
In this campaign, they’re assisted by Donald Trump, who bellowed on his Truth Social platform a few months ago that “MURDERS & VIOLENT CRIME HIT UNIMAGINABLE RECORDS!” (caps in original, of course) in the city.
Fact-checking Trump and the Post are thankless tasks, but it seems worth setting the record straight. Crime is not at record levels—nowhere near it.
Let’s look at murders, the best measure to look at according to criminal justice connoisseurs for getting a sense of overall trends. Murder isn’t only the most serious crime around, the stats on homicide are also the most reliable of all, because few murders are missed and other types of crime are subject to reporting and classification errors. Here’s the history in a graph:

Last year, there were 391 murders in the city, down 11% from 2022, 20% from 2021, and 83% from the all-time peak in 1990. So far this year, murders are down 25% from the same period last year. If that rate is sustained through 2024, we’ll be back to the pre-covid lows. There is just no crime wave, but reactionaries like Trump and the Post want you to think so.
Since the city’s population has changed over the years (though not by as much as you might think), it’s worth looking at the murder rate, the number of homicides per 100,000 people. Here’s what that looks like. At just under 5 per 100,000, it’s down by 85% since the 1990 peak. It’s exceeded by cities that Trump and the Post editorialists no doubt imagine are safer, like Miami (11 per 100,000), Dallas (12), and Houston (also 12). Sad to say, NYC’s peak rate of 31 per 100,000.

Our terrible mayor, Eric Adams, could be making these points, but he doesn’t want to—he’d rather blame migrants for our problems. Besides, doing something about important things like the cost of housing or adapting to climate change might annoy the landlord class that runs the city. Better to stoke fears of our neighbors and of refugees.
Fresh audio product: chaos in Haiti, death of the future
Just added to my radio archive (click on date for link):
March 14, 2024 Robert Fatton explains Haiti’s further descent into poverty and chaos • Steve Fraser, author of this article, analyzes and mourns the death of any sense of a better future
Fresh audio product: empty Northern elites, Ukraine during and after the USSR
Just added to my radio archive (click on date for link):
March 7, 2024 Vijay Prashad on how the North American and European bourgeoisies are a spent force, with nothing to offer the world (article here) • Volodymyr Ishchenko, author of Toward the Abyss, on Ukraine during and after the USSR
Fresh audio product: Black Panthers, Pakistan
Just added to my radio archive (click on date for link):
February 29, 2024 historian Donna Murch, author of Living for the City, takes on some myths about the Black Panther Party • Saadia Toor and Rabia Mehmood on Pakistan
Fresh audio product: the Desi diaspora, finance capital today
Just added to my radio archive (click on date for link):
February 22, 2024 Jeet Heer on Indian Americans in politics and society (article here) • Stephen Maher and Scott Aquanno, authors of The Fall and Rise of American Finance, on the new finance capital
Fitch lecture: 13th annual edition, with Robin D.G. Kelley
 on Monday, March 18, at LaGuardia Community College in Long Island City, Queens. Kelley, a distinguished professor of history at UCLA, is calling his talk “From the Waterfront to the Sea: Working Class Democracy and the Question of Palestine.” I’ll be doing the intro.
More info here.
on Monday, March 18, at LaGuardia Community College in Long Island City, Queens. Kelley, a distinguished professor of history at UCLA, is calling his talk “From the Waterfront to the Sea: Working Class Democracy and the Question of Palestine.” I’ll be doing the intro.
More info here.
Fresh audio product: the bankers’ club and how to bust it, the problem with immediacy
Just added to my radio archive (click on date for link):
February 15, 2024 Gerald Epstein, author of Busting the Bankers’ Club, on the finance racket and how to transform it • Anna Kornbluh, author of Immediacy, on our sped-up, unmediated cultural eternal present
Vibecession over
Though I’m certainly not the first to make this observation, it looks like the “vibecession” is over. The term was coined in June 2022 by multimedia economic analyst Kyla Scanlon (drawing on Keynes but also the poetry of Charles Bukowski), who defined it as “a disconnect between consumer sentiment and economic data. So basically, the economy is doing fine, but people are absolutely not feeling fine.” By recent measures, people are starting to feel somewhat finer, if not bounce-off-the-walls fine.
The Conference Board’s consumer confidence index rose 6.8 points in January to its highest level since December 2021. The index is the summary of a monthly survey the organization has conducted since 1967 that asks people questions about the state of the economy, the job market, and their personal finances, both in the present and their expectations for the future. Separate indexes for the present and expectations questions are computed, and then averaged into a composite. The history is graphed below.

January’s rise in the composite was led by its “present conditions” component, up 14.1 points to the highest level since March 2020. Driving the rise were improving evaluations of the job market, as the gap between those reporting “job plentiful” and those reporting them “hard to get” expanded 8.4 points to 35.7 in favor of plentiful—very high by historical standards (higher than 94% of all the months in its 57-year history). Expectations, alas, are more muted.
Gallup agrees on the improvement, though not on its degree. The present component of their economic confidence index rose to its highest level since November 2021 in January, but it’s still negative on balance. (It’s computed as the difference between the share of respondents calling the economy excellent or good and the share calling it poor. Just 5% of respondents in the January survey called it “excellent,” and 22% “good.” Far more, 45%, called it poor. for a net of -18%.) The expectations side, while also net negative, is at its least negative level since September 2021. There’s no graph of these because there are often long stretches between surveys and such a graph would be ugly.
And another: the University of Michigan’s consumer sentiment measure (graph below) was up 9.1 from December on its preliminary January reading, reaching its highest level since July 2021. It was also led by evaluations of the present, though expectations were somewhat loftier than the Conference Board’s counterpart. Sentiment had really been plumbing the depths: in June 2022, the month Scanlon coined the term, the index hit 50.0, its all-time low in over seven decades of history—below the depths of the Great Recession. Not coincidentally, it was also the month of peak inflation.* The sentiment index’s full-year 2023 average was 8 points below the long-term recession average. January’s improved reading was nonetheless still almost 10 points below the average of all business cycle expansions since 1952.

inflation down
Much of this improvement in outlook is the result of the decline in inflation, from 8.9% in June 2022 to 3.3% in December 2023, a fall of almost two-thirds. We hadn’t seen 8.9% in 42 years. December’s 3.3% is above the 1990–2019 average of 2.5%, but not profoundly so.
Along with the decline in actual inflation has come a decline in expected inflation. I’ve long thought that instruments that measure “expectations” are mostly about the present and recent past and have little or no prognostic content. (As the graph below shows, expectations for price increases over the next twelve months generally track the experience of the previous twelve.) Instead, expectations can be read as a measure of a subjective state—in this case, how established inflation feels as a part of life, what the current norm is.

By this measure, inflation’s psychological grasp looks to be slipping. As the graph shows, expectations for the next year have come down along with actual inflation, from over 5% in mid-2022 to 2.9% in January.
That matters a lot—people hate inflation! Liberals and leftists tend to dismiss inflation as a concern of anal-retentive reactionaries, but that badly misreads popular opinion. I made this argument at some length in my long Jacobin article on inflation, but here’s another piece of evidence to add to that: Scanlon cites a Morning Consult poll that found 63% of consumers prefer prices going down to their income going up. Economists natter on about “real” (inflation-adjusted) income, but they may not be giving enough weight to the price part.
partisan coda
Speaking of the Michigan sentiment numbers, the improvement in outlook over the last couple of months crosses partisan lines, but the gap between Democrats and Republicans widened. Partisan gaps have long been visible in the survey, but they were much less dramatic than they’ve been since January 21, 2017. During the Obama years, Dems’ consumer sentiment ratings were about 18 points higher than Republicans’. During the Trump years, the gap more than doubled to 39 points, though it switched parties to favor Republicans. For first three of the Biden years, the parties flipped again, as Dems’ evaluations exceeded Reps’ by 35 points, even though nothing had changed by conventional economic measures. Independents, not surprisingly, split these differences.

Between November 2023 and January 2024, both parties saw strong increases in their evaluations of the economy, but Dems, up 17 points, were more enthusiastic than Reps, up just 15. So the gap widened to 44 points.
Much of the lift to the overall sentiment measure for Republicans—over three-quarters of it—came from expectations, not evaluations of the present; perhaps they’re hopeful about November’s election results.
Otherwise, the end of the vibecession might be good news for the hapless warmonger Biden, who needs some.
* In June 2022, when the sentiment measure was at its record low of 50.0, the unemployment rate was 3.6%. It was also the high for the recent inflation surge: 8.6%. In October 2009, when the unemployment rate was 10.0%, the worst reading of the Great Recession, the sentiment index was 70.6. But there was literally no inflation: for the year ending October 2009, the consumer price index was down 0.2%.
Fresh audio product: why did SA bring case against Israel, organizing amidst sprawl, the widening war in the Middle East
Just added to my radio archive (click on date for link):
February 1, 2024 Sean Jacobs explores why South Africa brought the genocide case against Israel • Eric Blanc (Substack post here) on organizing in a scattered and atomized society • Hassan El-Tayyab on the widening war in the Middle East
Fresh audio product: Houthis, Hezbollah
Just added to my radio archive (click on date for link):
January 25, 2024 Shireen Al-Adeimi of Michigan State and the Quincy Institute, on the Houthis • political scientist Aurélie Daher with another view of Hezbollah
Unions had a flat 2023
Despite an apparent upsurge in labor militancy, unions made no gains in their share of the workforce last year. According to newly released figures from the Bureau of Labor Statistics, in 2023, 10.1% of the workforce belonged to a union, unchanged from the previous year and down 0.2 from 2019. There was a spike in union density in 2020, as more nonunion workers left the workforce than their organized counterparts in the early covid days, but that was quickly reversed in 2021.
Since 1965, union density has risen only four times from one year to the next; it’s fallen in 45. Although long-term comparisons are dangerous—definitions, coverage, and methods can change radically over time—it looks like the private sector union share today is lower than it was in 1900.
The public sector, once the brighter spot in the union picture, has lately been leading the way down. Since 2011, the decline in public sector density is four times that of the private sector’s. The right’s war on public sector unions has taken a serious toll. The grim story is graphed below.

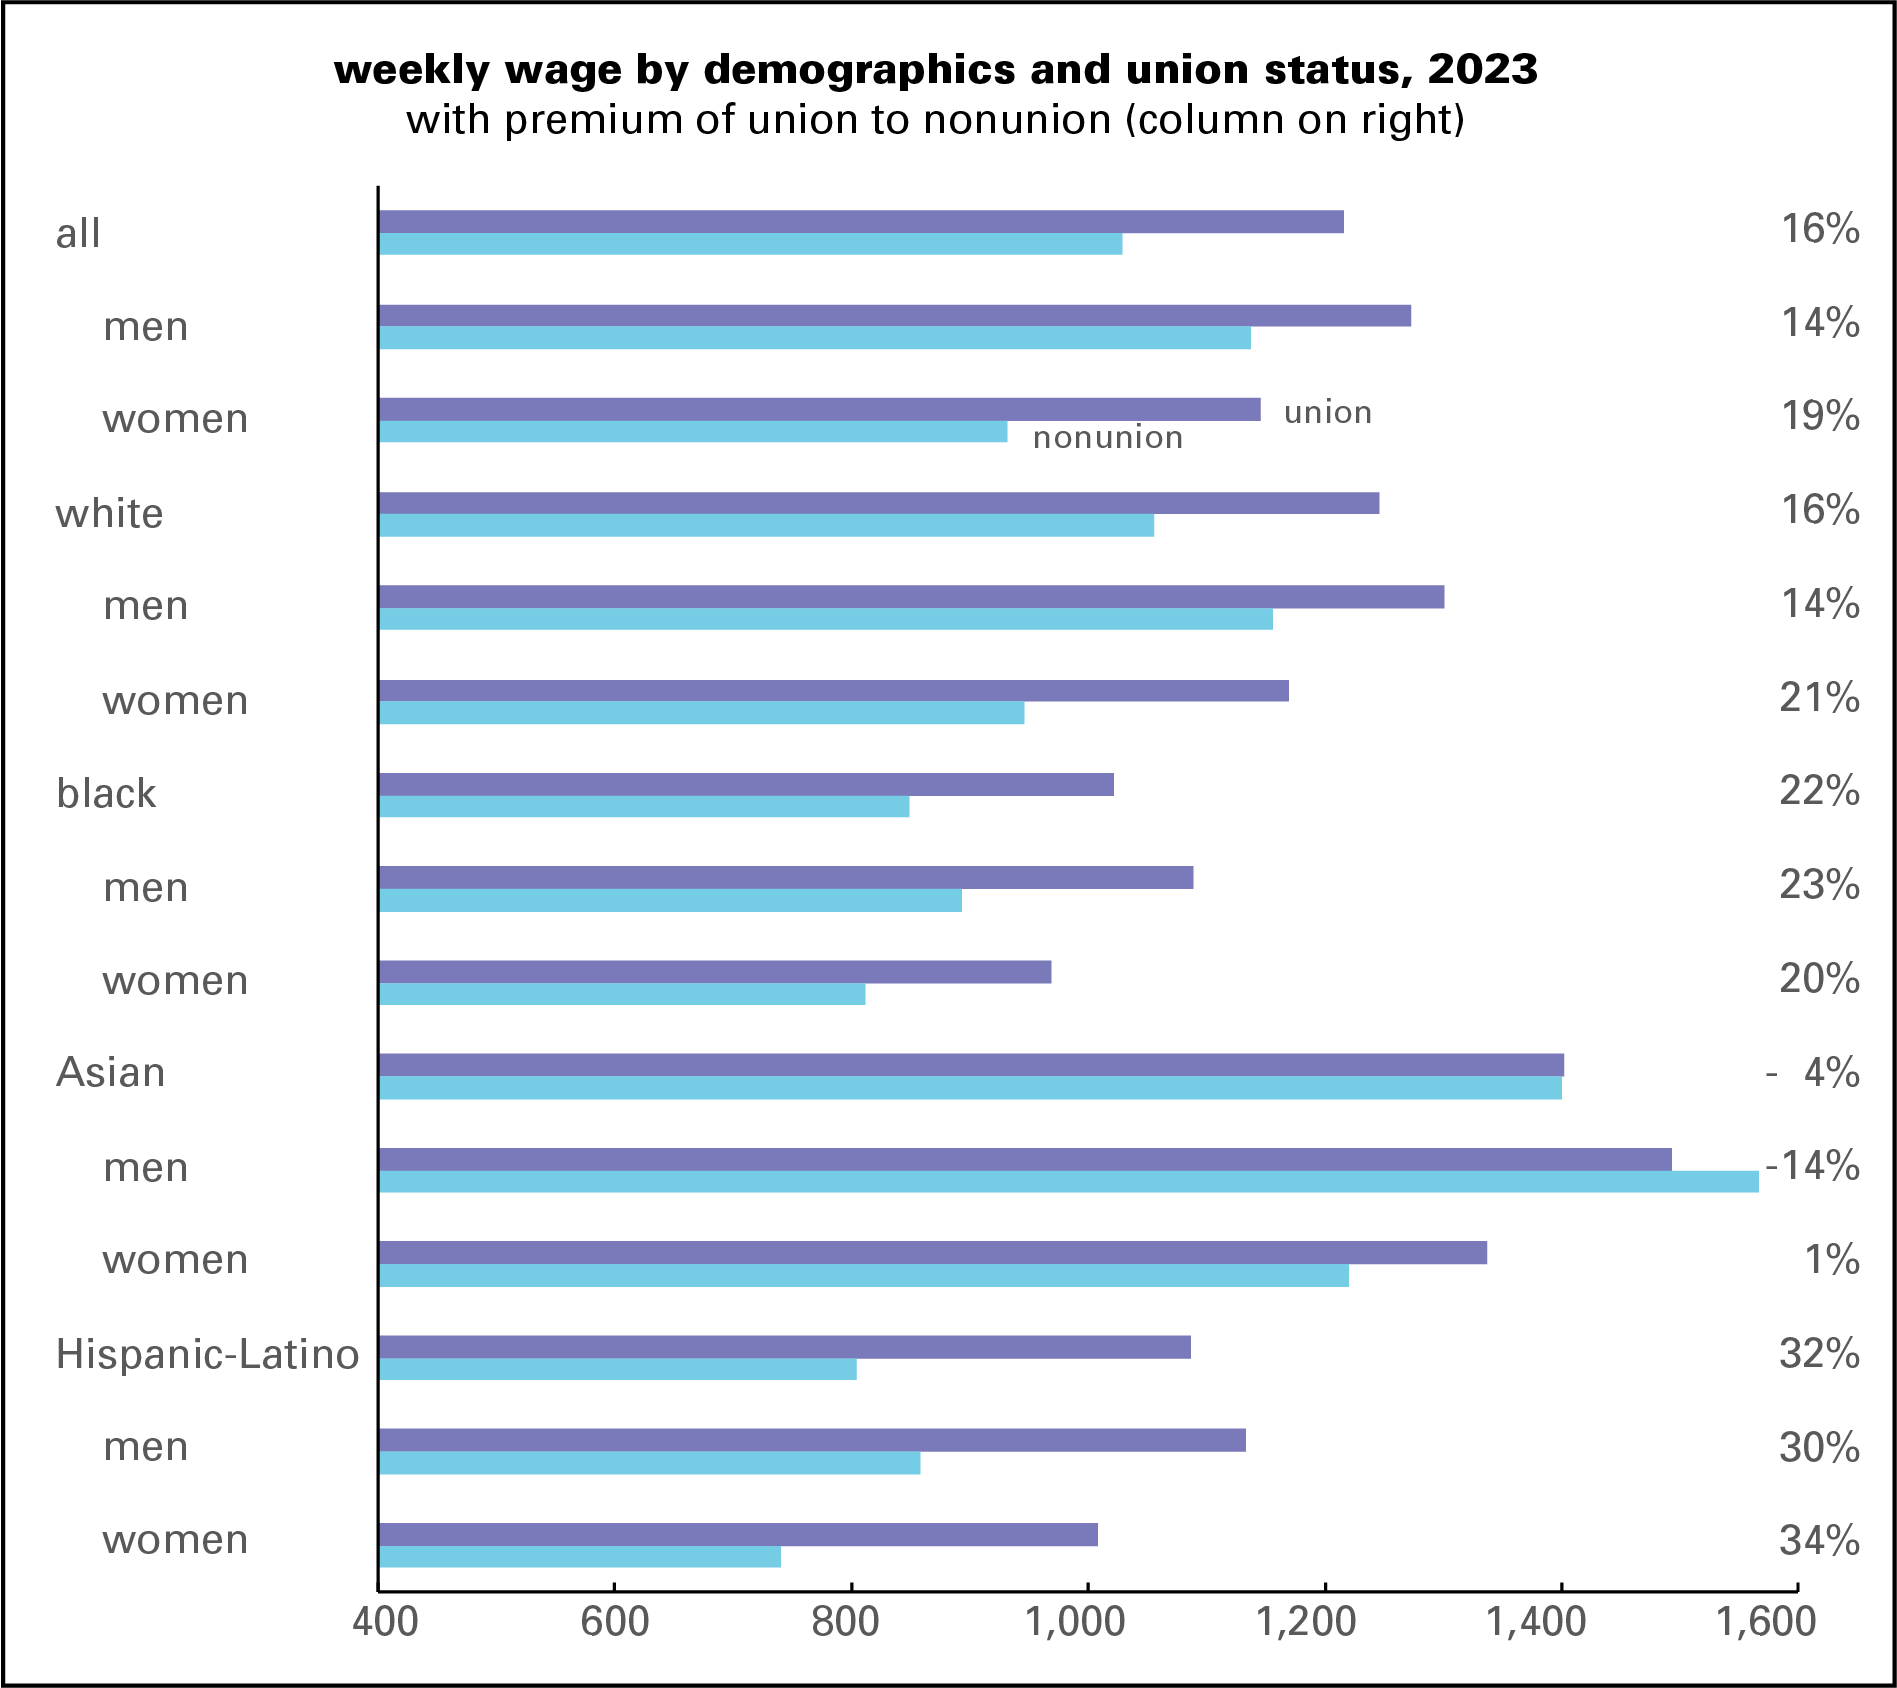
pay
Much of the material difficulties experience by the working class over the last few decades can be traced the shrinkage of unions—lower wages, stingier benefits, less job security. Pay is the most obvious measure. As the graph below shows, union members have weekly paychecks 16% larger than nonunion workers. The union premium is larger for groups that are the victims of discrimination—women and non-whites. Women enjoy a 19% union premium overall; black women, 20%; and Hispanic (as the government calls them) women, 32%. Nonwhite men also enjoy bigger union premiums than white men. The only exception is workers of Asian origin; it’s likely that the high share employed in tech (a sector where unions are rare) is responsible.
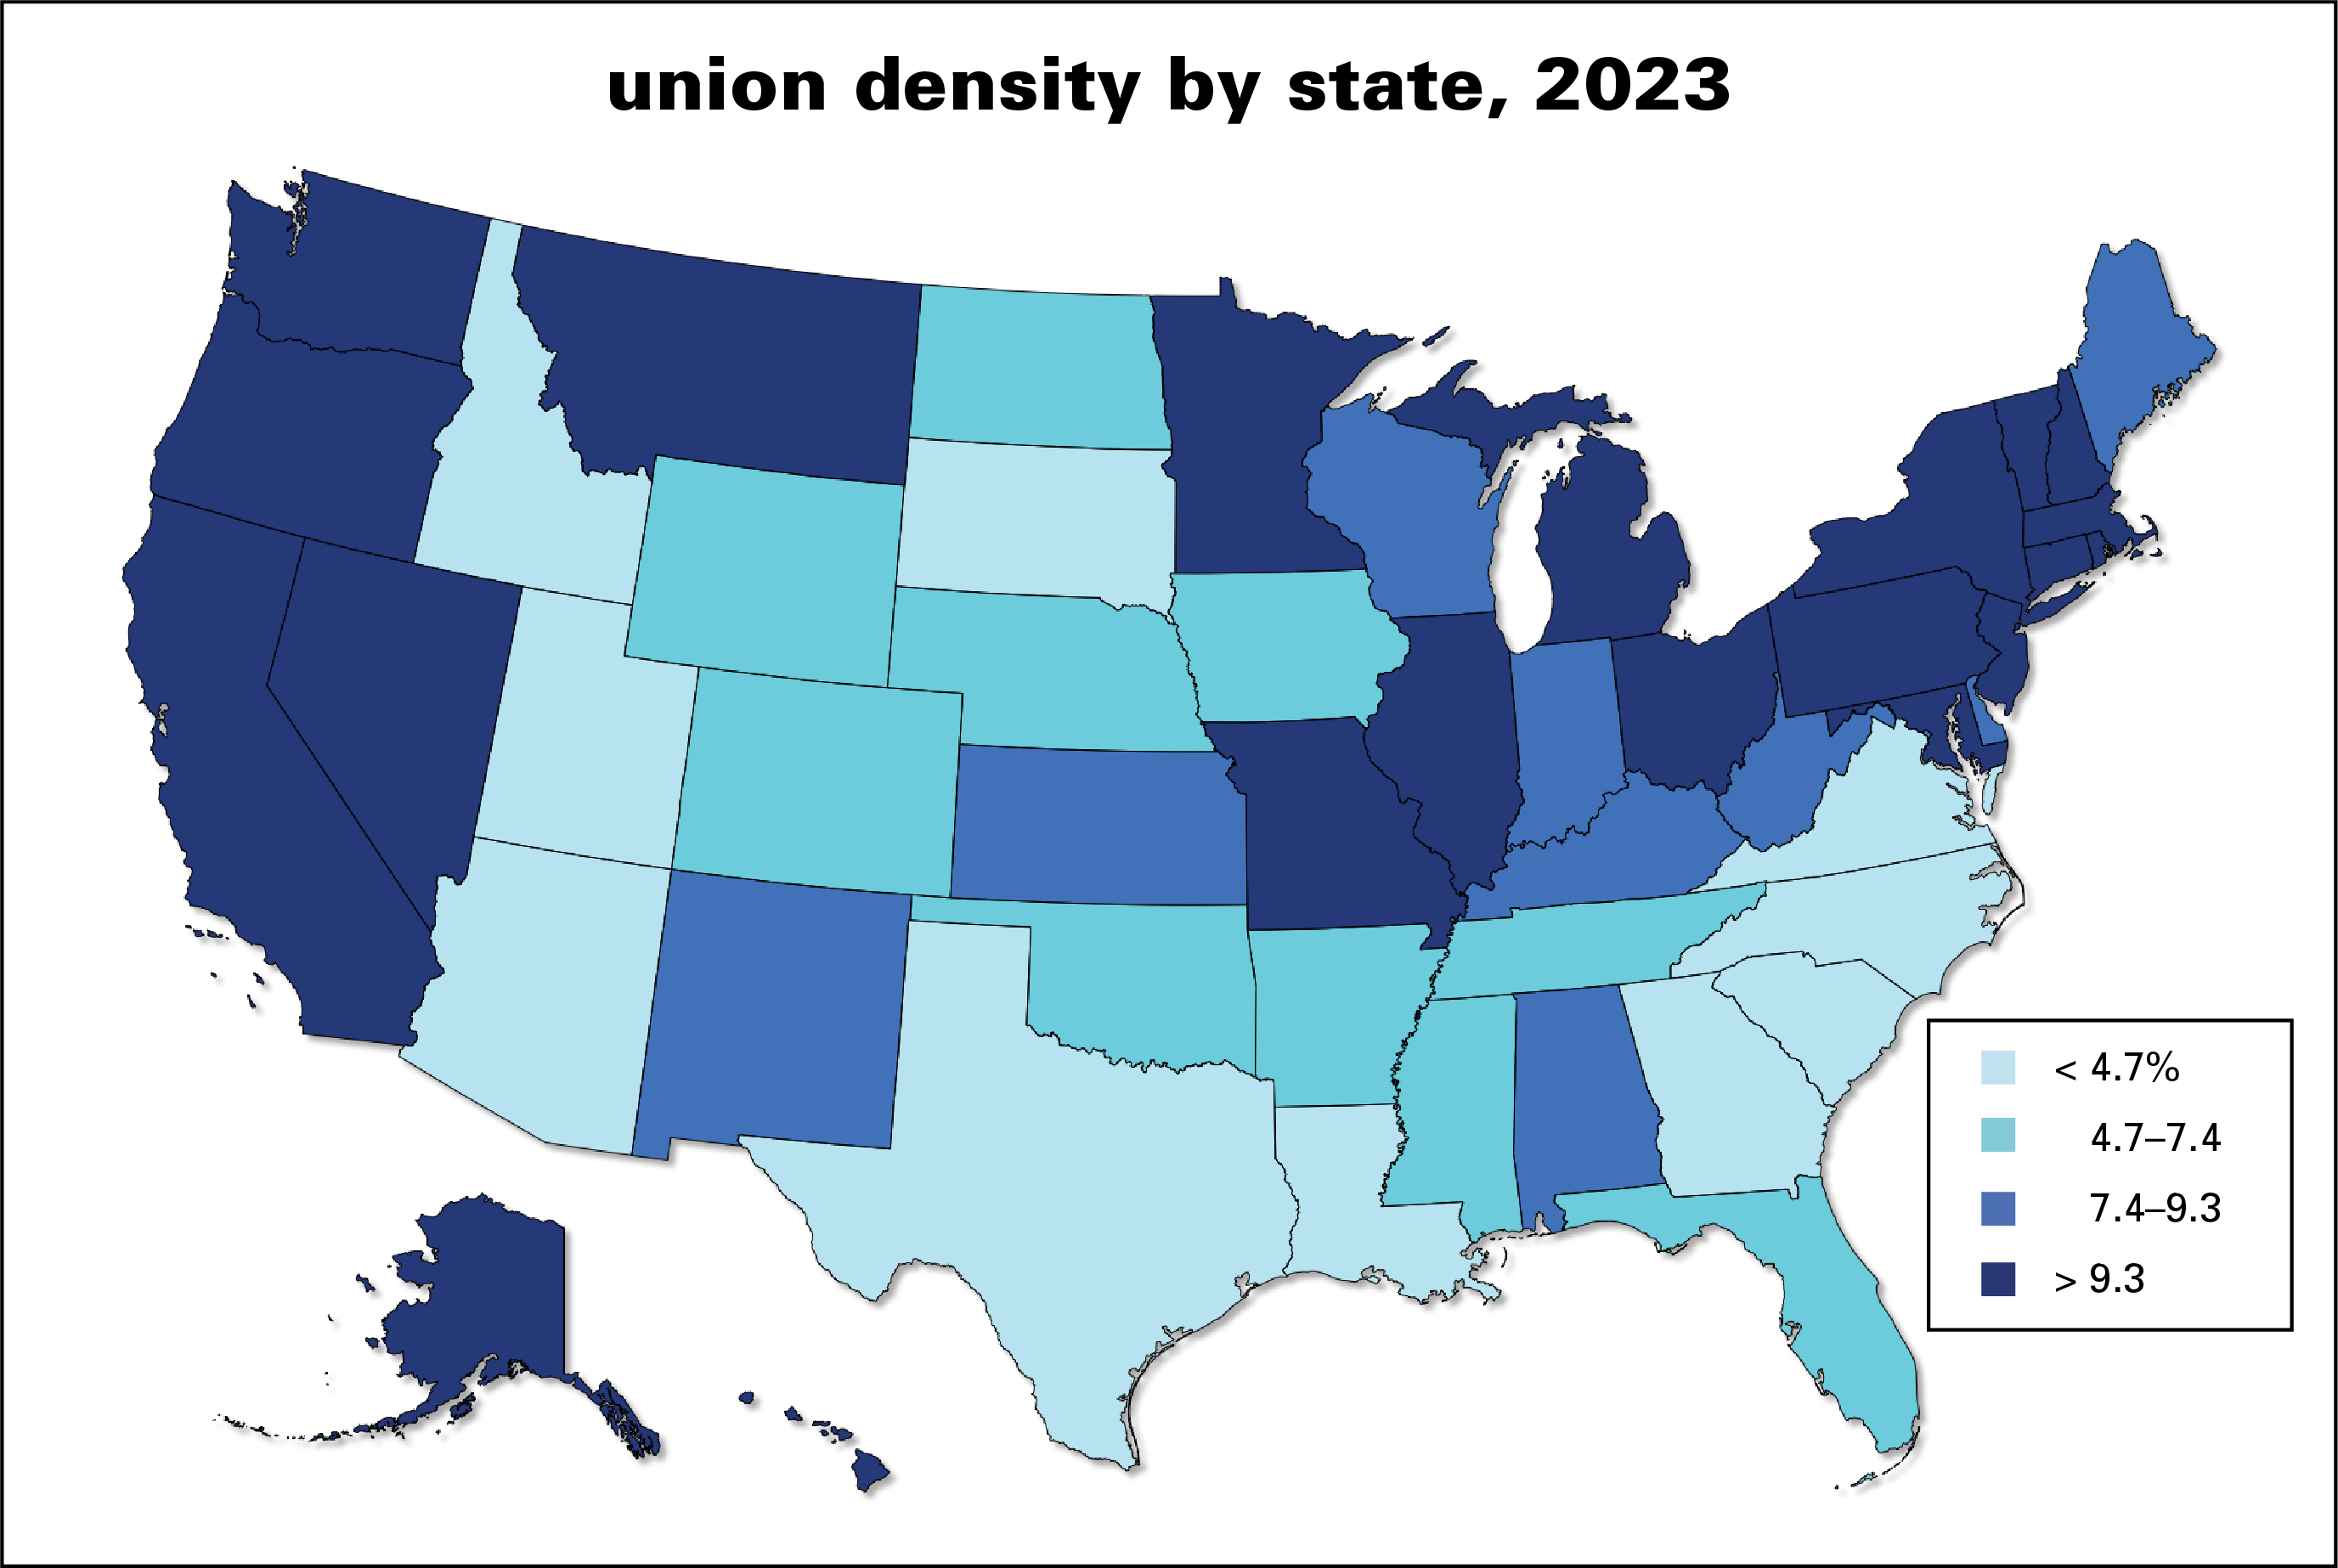
geography
Union density varies widely by state, from Hawaii’s 24.1% to South Carolina’s 2.3%. The map below shows some clear regional patterns, with the Northeast, upper Midwest, and West showing the highest densities and the South the lowest. The ten states that gave Donald Trump the highest share of their 2020 vote have an average density of 6.3%; the ten lowest, 15.2%. The states of the old Confederacy have an average density of 4.8%; the rest, 10.7%. Curiously, the state with the lowest density, South Carolina, had the largest share of its population enslaved before the Civil War.
shrinking premium
That union premium has been shrinking over time, as unions have weakened more generally. Here’s a history showing the ratio of the weekly pay of all union workers to nonunion since 1994. (Figures for 2000 are unavailable. There’s no simple source of the historical data—you have to enter it by hand from annual releases.) The premium has declined steadily for three decades, from 37% in 1994 to 16% in 2023. While 16% isn’t nothing, the premium is less than half what it was back in the early Clinton era.

This graph is based on weekly wages, which are a half-decent proxy for workers’ “normal” wage (though people do cycle in and out of work, and sometimes hours can be hard to come by). But since workweeks can vary by time, industry, region, and worker characteristics (as economists say) it’s also worth looking at hourly pay.
That too is in decline, as the chart below (from UnionStats data) shows. The “unadjusted” line has fallen from a high of 31% in 1977 to 6% in 2023, a decline of 80%. But the unadjusted average, like the BLS averages above, mixes together workers of varying demographics (like age, sex, region, and race) from a variety of industrial sectors, with wide differences in pay and unionization rates. As those mixes change over time, the averages change, which obscures the pure union effect.
The line marked “adjusted” is an attempt to control for those compositional changes and compare workers who are similar except for their union status. That too has declined, though not as much—from 21% in 1977 to 10% last year, or just over 50%. That’s a lot but it’s less than the 80% decline in the unadjusted numbers.

coda
Of course, any premium >0% will inspire bosses to hate unions and want to destroy them—and not just for the higher pay. Unions are a constraint on boss behavior; they can force them to be less racist, less abusive, and less able to fire. But clearly they’ve lost a lot of their bite over time.
As I say every time I do these reviews:
There are a lot of things wrong with American unions. Most organize poorly, if at all. Politically they function mainly as ATMs and free labor pools for the Democratic party without getting much in return. But there’s no way to end the 40-year war on the US working class without getting union membership up….
It’s still true, though I should probably add a few years to that “40” timespan.


Posted on February 8, 2024 by Doug Henwood
fresh audio product: exhausted humanity faces climate crisis, recessions raise lifespans
Just added to my radio archive (click on date for link):
February 8, 2024 Ajay Singh Chaudhary talks about his new book, The Exhausted of the Earth: Politics in a Burning World • Matt Notowidigdo, co-author of this paper, on how recessions increase life expectancy
Share this: