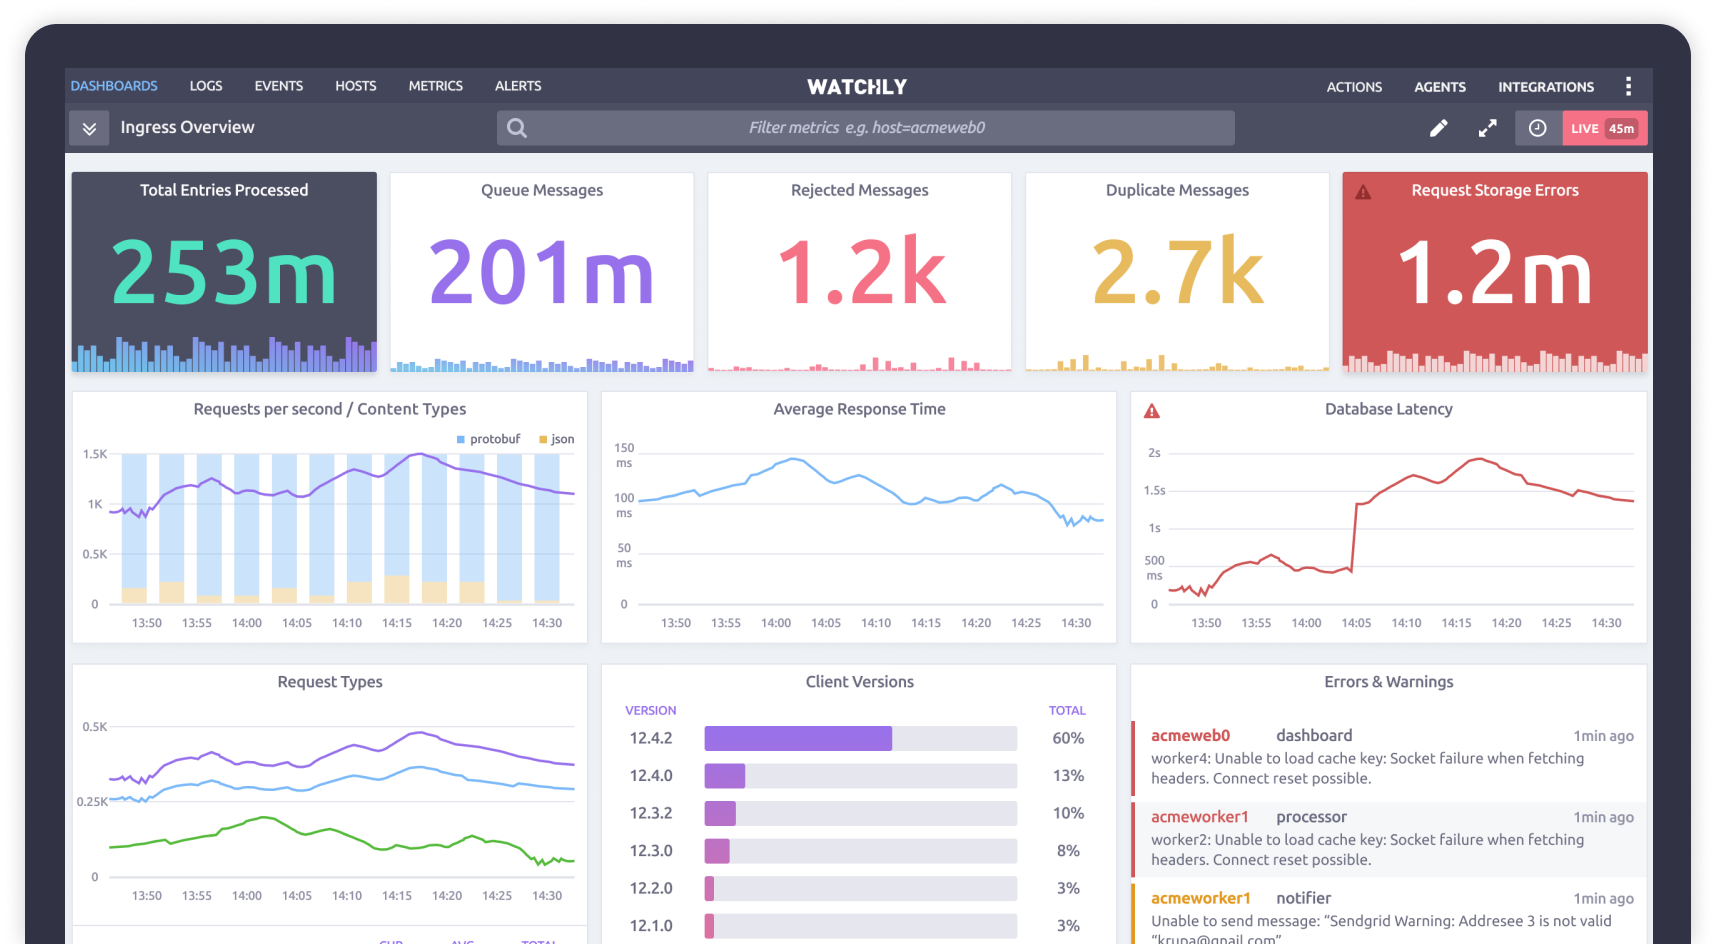
Unified Metrics, Logging, and Alerting, entirely inside your infrastructure
- Metrics
- Logging
- Alerting
Everything In One Place
Super-charge your DevOps experience with Watchly
Currently
Multiple external services each with their own ideas, concepts, setup procedures and maintenance. Endless individual logins to track.
Zero cohesion and awkward connectors between each service to enable basic functionality.
Multiple agents to deploy and configure, agents that take significant amounts of system resources
One simple system provides your entire monitoring needs.
Built from the ground up for a unified experience Login via google/github/azure SSO.
Single centrally configured, high performance agent.
Safely Inside Your Infrastructure
Keep control of your business data
Currently
Sending information between multiple services leaves your data vulnerable to hackers, outages, & corruption.
All data is kept securely inside your infrastructure, never residing on third party servers and is never leaked out to the wider internet.
We Play Nicely With Others
Our unique approach simplifies monitoring the services you rely on
Everything You’re Used To, And So Much More...
Supercharged Monitoring with no punches pulled
Metrics
Push/Pull metrics via StatsD & Prometheus
Query with PromQL
Powerful Dashboards with simple customization
Zero limitations on hosts, metrics, and tags
Logging
Push logs via Syslog (UDP/TCP/TLS) with full JSON support
Automatic log detection and parsing
Group and search from unlimited sources in real-time
Customize log stream views to your liking
Alerting
Email, Voice, and SMS alerting included out of the box
Configure simple or complex Monitors that alert based on metrics, or logs, or both
Unified Incident view reduces Alert Fatigue and time to resolution
Easy Deployment & Management
Simple deployment into public and private clouds, or directly onto metal
Our GUI Installer takes you from deployment to monitoring within 5 minutes
Fully automatic updates
SSO by default, to enable safe & secure access for you and your co-workers
Watchly Agent
A single agent to handle all your needs
Centralized configuration management from the Dashboard, no config files!
Low resource usage
Fully automatic updates
Easily deployable via curl, or any existing orchestration software
Integrations
Configure access to services once for both metrics & logs support
Centralized configuration from the Dashboard
Access tokens and passwords remain safely inside your infrastructure
