Debugging Extensions
Extensions are able to leverage the same debugging benifits Chrome DevTools provides for web pages, but they carry unique behavior properties. Becoming a master extension debugger requires an understanding of these behaviors, how extension components work with each other, and where to corner bugs. This tutorial gives developers a basic understanding of debugging extensions.
Locate the Logs
Extensions are made of many different components, and these components have individual responsibilities. Download a broken extension here to begin locating error logs for different extension components.
Background Script
Navigate to the chrome extensions management page at
chrome://extensions and
ensure developer mode is on.
Click the Load Unpacked button
and select the broken extension directory.
After the extension is loaded,
it should have three buttons:
Details, Remove and Errors in red letters.
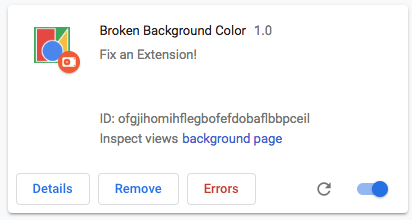
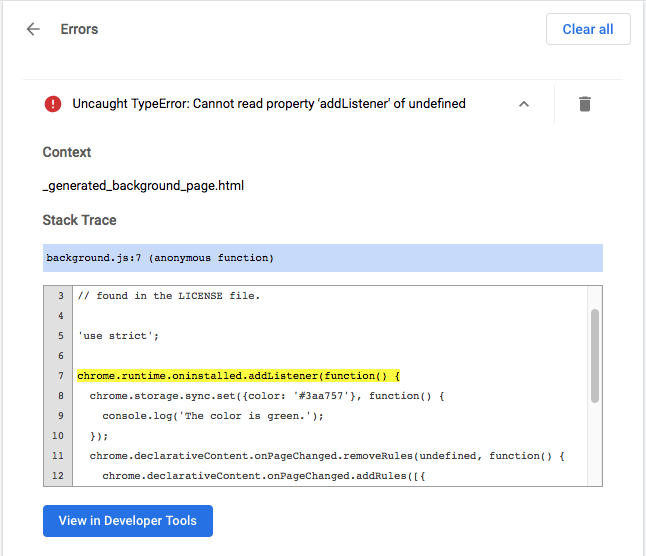
Click the Errors button to view the error log. The extensions system has found an issue in the background script.
Uncaught TypeError: Cannot read property ‘addListener’ of undefined
Additionally, the Chrome DevTools panel can be opened for the background script by selecting the blue link next to Inspect views.

Return to the code.
  chrome.runtime.oninstalled.addListener(function() {
    chrome.storage.sync.set({color: '#3aa757'}, function() {
      console.log('The color is green.');
    });
    chrome.declarativeContent.onPageChanged.removeRules(undefined, function() {
      chrome.declarativeContent.onPageChanged.addRules([{
        conditions: [new chrome.declarativeContent.PageStateMatcher({
          pageUrl: {hostEquals: 'developer.chrome.com'},
        })],
        actions: [new chrome.declarativeContent.ShowPageAction()]
      }]);
    });
  });
The background script is attempting to listen for the
onInstalled
event,
but the property name requires an upper case "I".
Update the code to reflect the correct call,
click the Clear all button in the upper right hand corner,
then reload the extension.
Popup
Now that the extension initializes correctly, other components can be tested. Refresh this page, or open a new tab and naigate to any page on developer.chrome.com, open the popup and click the green square. And... nothing happens.
Navigate back to the Extensions Management Page, the Errors button has reappeared. Click it to view the new log.
Uncaught ReferenceError: tabs is not defined
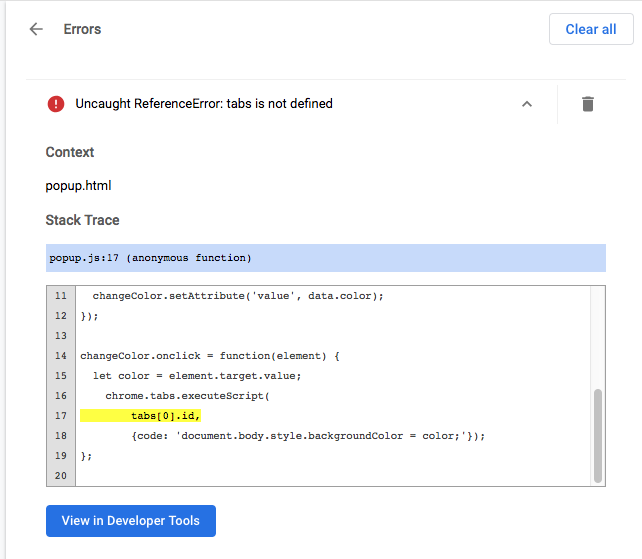
Popup errors can also be viewed by inspecting the popup.

The error, tabs is undefined,
says the extension doesn’t know where to inject the content script.
This can be corrected by calling the
tabs.query()
method,
then selecting the active tab.
  let changeColor = document.getElementById('changeColor');

  chrome.storage.sync.get('color', function(data) {
    changeColor.style.backgroundColor = data.color;
    changeColor.setAttribute('value', data.color);
  });

  changeColor.onclick = function(element) {
    let color = element.target.value;
    chrome.tabs.query({active: true, currentWindow: true}, function(tabs) {
      chrome.tabs.executeScript(
          tabs[0].id,
          {code: 'document.body.style.backgroundColor = color;'});
    });
  };
Update the code, click the Clear all button in the upper right hand corner, and then reload the extension.
Content Script
Refresh the page, open the popup and click the green box. And... nope, the background still hasn’t changed colors! Navigate back to the Extensions Management Page and... there is no Errors button. The likely culprite is the content script, which runs inside the web page.
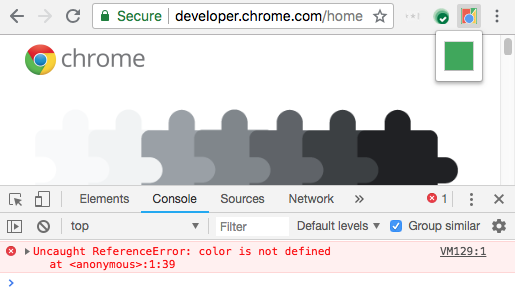
Open the DevTools pannel of the web page the extension is trying to alter.
Only runtime errors, console.warning
and console.error will be recorded on the
Extensions Management Page.
To use DevTools from within the content script, click the dropdown arrow next to top and select the extension.
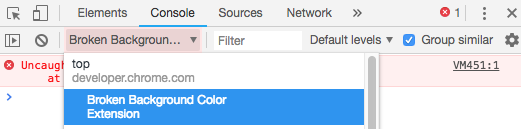
The error says color is not defined.
The extension must not be passing the variable correctly.
Correct the injected script to pass the color variable into the code.
{code: 'document.body.style.backgroundColor = "' + color + '";'});
Extension Tabs
Logs for extension pages displayed as a tab, such as override pages and full-page options, can be found in the web page console and on the extensions management page.
Monitor Network Requests
The popup will often make all of the required network requests before even the speediest of developers can open DevTools. To view these requests, refresh from inside the network pannel. It will reload the popup without closing the DevTools panel.

Declare Permissions
While extensions have similar capabilities as web pages they often need permission to use certain features, such as cookies, storage and Cross-Origin XMLHttpRequsts. Refer to the permissions article and the availabe Chrome APIs to ensure an extension is requesting the correct permissions in its manifest.
  {
    "name": "Broken Background Color",
    "version": "1.0",
    "description": "Fix an Extension!",
    "permissions": [
      "activeTab",
      "declarativeContent",
      "storage"
    ],
    "options_page": "options.html",
    "background": {
      "scripts": ["background.js"],
      "persistent": false
    },
    "page_action": {
      "default_popup": "popup.html",
      "default_icon": {
        "16": "images/get_started16.png",
        "32": "images/get_started32.png",
        "48": "images/get_started48.png",
        "128": "images/get_started128.png"
      }
    },
    "icons": {
      "16": "images/get_started16.png",
      "32": "images/get_started32.png",
      "48": "images/get_started48.png",
      "128": "images/get_started128.png"
    },
    "manifest_version": 2
  }
Next Steps
For further information on debugging extensions, watch Developing and Debugging. Learn more about Chrome Devtools by reading the documentation.