Inside a Tornado


Get all the excitement and thrill of chasing by reading this book.

Tornado Chase Photos

Tornado Education

2001-Pics

History

Storm Chaser Glossary


Where is Tornado Alley                 http://godknowsthefuture.info
Tornado Chase Photos   Tornado Education  StormChaser Glossary   History   Home   Contact us
You will find Tornado Alley maps will vary from source to source. So this is only one opinion of many. Here is what Tornado Tim Baker thinks.

Are traditional tornado alley maps wrong? 
Some consider tornado alley as the area where only the most intense killer tornadoes are likely to occur, looking where F4 and F5 tornadoes have struck in history multiple times. Others draw tornado alley only where tornado frequency is the highest, looking at areas that have recorded multiple tornado touchdowns consistently year after year. Some years certain states seem to get enough tornadoes to qualify as part of tornado alley but, when looking at tornadoes over many years in that state you see that it was just an unusual period for them.  With many areas experiencing warmer than normal temperatures,  traditional tornado alley maps don't seem to represent those climate changes accurately.  I believe we need to rethink where tornado alley is with these climate changes. A warm January will lead to a shift in tornadoes to more north and eastern states than traditional tornado alley maps represent.

Many arguments over what states are in tornado alley take place, so to be fair qualify what criteria you are using in determining tornado alley.  In 2004 people in Illinois were at greater risk than most of the areas people think of as tornado alley.

If you were to be exact about tornado alley, it would really be made up of hundreds of little strips, and never one large alley.  Tornado alley maps are all made up of a general area from data taken over a long period of time. Tornado alley should be thought of on a more yearly basis also, since weather patterns can change, making some states harder hit one year versus others, like Illinois in 1925, 1974 and 2004. 

Some people have asked if tornadoes appear everywhere in tornado alley. The fact is on all tornado alley maps there are areas that have never had a tornado hit there.  Remember, not every city in tornado alley has been struck by a tornado while others have had many tornadoes hit them.
        Heavy winds from tornadoes and other storms can cause widespread damage to the local trees. Those affected by storms in the eastern states should consider this tree removal Raleigh based company to clear any debris left by storms. I would also suggest you remove any dead limbs before storm season starts.  I have seen many houses and cars with an old limb crashed through their roof. Why not be proactive.  Give them a call today.

Think About This
The 1974 super tornado outbreak took place in Georgia, Illinois, Indiana, Kentucky, Michigan, Mississippi, North Carolina, Ohio, South Carolina, Tennessee, Virginia, and West Virginia. How many maps include these states in Tornado Alley? Not very many, some don’t include any of them; even I don’t include all of them. States such as Florida also have many small tornadoes but because the intensity of most of them is low, it is seldom considered as part of Tornado Alley by anyone. In 1925 the Tri-State tornado killed 695 people in Missouri, Illinois and Indiana, yet many don’t include these in Tornado Alley, I do. In November 2002 a tornado outbreak took place in Alabama, Tennessee and Ohio, Killing at least 36 people. Friday, September 20th 2002 a tornado outbreak hit Indiana, I include these states in Tornado Alley, others don't. History tells me Indiana, Ohio, Illinois, Kentucky and Tennessee are dangerous tornado states.(cont. top)
Learn how to chase tornadoes
Chaser School  - What is CAPE

Upper air - Jet streams and chasing

 Historical Tornado Photos

 Meteorology Programs

 Degree Programs

 Storm Chasers

Tornado Tim Safety Photos and posters


Below is a Map of Tornado Alley Tornado Alley Map - General area where tornadoes occur
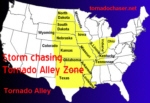
The area I have marked covers the states that have recorded an F5 tornado touchdown, except Colorado and Arkansas. Colorado and Arkansas are still included because they record many smaller tornadoes each year and have had significant tornadoes in their history.   So the area marked on this map as tornado alley is based on where dangerous tornadoes and tornadoes in general are most likely going to take place in a given year.  This area averages 3 tornadoes or more per year per 10,000 square miles in general.

Tornado Frequency

The dark green areas on the map below could be considered the heart of tornado alley, especially in Nebraska, Kansas, Oklahoma and Texas. Notice how not all dark green areas are in Kansas, Oklahoma and Texas, the area many limit tornado alley to. Look at both maps to get a better idea.
Tornado Frequency

fast.jpg (7291 bytes)
Kansas - Highest number of F5 tornadoes since 1880
Iowa Greatest number of F5's  per square mile
AlabamaHighest percentage of tornadoes rated as of significant intensity
Kentucky - Highest percentage of all tornadoes ranked as violent (F4 or F5)

After seeing this information do you think these states should be included in Tornado Alley?
 Historical Tornado Photos

Monthly Tornado Stats (PDF file)


Tornado frequency and Location
  Where and when tornadoes are most likely

 Story - Son of a Tornado Chaser


News Report December 2004 by Tornado Tim
Continuing research helps shed light on the idea of multiple tornado alleys in the US rather than one general area. Reading the research paper  "EVIDENCE OF SMALLER TORNADO ALLEYS ACROSS THE UNITED STATES BASED ON A LONG TRACK F3 TO F5 TORNADO CLIMATOLOGY STUDY FROM 1880 TO 2003" by  Chris Broyles and Casey Crosbie of the Storm Prediction Center in Norman, Oklahoma; data has been analyzed to show a historical representation of several smaller apparent tornado alleys across the United States as determined by a long track F3 to F5 tornadoes. A map of the United States from 1880 to 2003 was constructed showing normalized frequencies of F3 to F5 tornadoes with path lengths of at least 25 miles.  This research gives a well needed upgrade to how we look at tornado prone areas in the US and I believe helps give a more accurate representation of areas not always known as tornado alley. I continue to believe most tornado alley maps do not represent the most dangerous areas in the US correctly, and have been vague in defining them to the public which may become a serious safety issue in the future.  I continue to believe we need to go to maps showing multiple tornado alleys in the US and not ignore overwhelming evidence that many of the most violent tornado areas in the US have been left off tornado alley maps for too long. While it may be true that tornado frequency may be highest in a small area in the US on a yearly basis, dangerous and violent tornadoes happen over many tornado alley sections within the US that may have prolonged droughts of tornadoes before being annihilated by large, long lived tornadoes again and again. These small tornado alleys are seen when looking at the US by a county to county assessment. Below are the most dangerous counties in the US for F3 to F5 tornadoes with path lengths longer than 25 miles. Most of these dangerous counties are not listed on most tornado alley maps. Maps based on this county by county look is far more accurate than today's maps.
(To find the number of long path F3 to F5 tornadoes affecting a county from 1880 to 2003, multiply the frequency by the square miles and divide by 1,000).
Below are the top nine areas.

Frequency County State Square Miles
19.28 Union MS 415
18.68 Simpson MS 589
17.30 Chester TN 289
15.63 Fillmore NE 576
15.46 Morgan AL 582
14.79 Jasper MS 676
13.91 Thayer NE 575
13.07 Bartow GA 459
12.62 Jackson AR 634

     Notice the two counties listed above from Nebraska.  These two counties border each other in southeast Nebraska.  Fillmore and Thayer Counties, had the highest frequencies in the Great Plains with 15.63 and 13.91 long path F3 to F5 tornadoes per 1,000 square miles, respectively. Nine long path F3 to F5 tornadoes affected Fillmore County and eight affected Thayer County during the 124 year period. In the great plains Nebraska comes above any listing for Kansas, Texas or Oklahoma which none of those 3 made the top 9 list.

      In 2004 Lancaster county in Southeast Nebraska had a long lived tornado that had a peak width of around 2 1/2 miles wide destroying the city of Hallam Nebraska proving the area to be one of the most dangerous in the US. The tornado event started 2 miles north of Daykin Nebraska, which is less than 5 miles from both Fillmore and Thayer Counties. In summary. f-scale rating was a maximim of f4 with a   maximum path length of 52 miles.

Also according to this research paper it says that the: "area with very high frequency of long path F3 to F5 tornadoes includes northern Mississippi, northern Alabama and western Tennessee. This vicinity includes the largest continuous area with six or greater long track F3 to F5 tornadoes per 1,000 square miles in the United States which is across northern Alabama extending to the northwest into western Tennessee. Union County in northeast Mississippi had the highest frequency in the United States with 19.28 long track F3 to F5 tornadoes per 1,000 square miles. The relatively small county had eight long track F3 to F5 tornadoes during the 124 year period."

Under their summary of this informative research paper they state the following information:
"The four most prominent tornado alleys that were identified in the United States include south-central Mississippi, east-central to northeast Oklahoma, southeast Nebraska and the area from western Tennessee to northeast Mississippi and northern Alabama. Other prominent alleys include northeast Kansas to central Iowa, northeast Arkansas, northwest Georgia, central Illinois to northwest Ohio, northwest Louisiana, northeast Nebraska, southeast Missouri to southwest Ohio and east to southeast North Carolina."

Most people would not be surprised to find that Oklahoma has one of the most dangerous cities in the US using this data, but look at the list of other cities toping the list. Below are the top 9 Cities for Long Track F3 to F5 Tornadoes in the United States from 1880 to 2003. The frequency of long track F3 to F5 tornadoes per 1,000 square miles is given for each city as a value.  The higher the value the more dangerous.

Value City State
10.2 Tulsa OK
9.3 Shreveport LA
8.8 South Bend IN
7.6 Indianapolis IN
7.5 Huntsville AL
7.3 Topeka KS
6.9 Springfield IL
6.2 Jackson MS
6.0 Nashville TN

Thanks again to the following research paper as much of this information came from it.  Credit to: "EVIDENCE OF SMALLER TORNADO ALLEYS ACROSS THE UNITED STATES BASED ON A LONG TRACK F3 TO F5 TORNADO CLIMATOLOGY STUDY FROM 1880 TO 2003" by  Chris Broyles and Casey Crosbie of the Storm Prediction Center in Norman, Oklahoma.
NOTE:Many of the opinions in this article are the ideas and opinions of Tornado Tim.

TORNADOCHASER.NET

Tornadochaser.net  home of Tornado Tim