Organize. Visualize. Evaluate.
With real-time analytics from New Relic Insights, you can better understand the end-to-end business impact of your software performance.
New All your data in one place with the Metric Explorer and Add-to-Insights. Learn More
Be a data-driven team
Building great software requires strong collaboration between development, operations, and product. Insights empowers each team with the information and answers they need to act quickly and uniformly.

Question:
How do you decide what to invest in during your Sprint planning?
Answer:
Insights lets you understand how and who is getting affected by bugs and performance issues. For example, a bug that affects your most popular feature amongst paying customers can be prioritized.

Question:
How do you make sure you’re looking at the same information across both development and operations?
Answer:
Insights provides a single pane of glass for both development and operations teams to work from.

Question:
What does front-end performance look like for our most popular features in the U.S.?
Answer:
Facet page load times of your most commonly used pages by geographic attributes.
Knowledge is power
Insights collects event and metric data from other New Relic products and allows you to pin nearly any chart from across New Relic to Insights with a single click, enabling you to organize, query, and visualize your data to answer key questions about application performance and customer experience—all in real-time.
Data is collected automatically from New Relic’s products.
Default attributes are added to event data. You can also add your own custom attributes!
Data is queried in real-time using NRQL, our SQL-like query language or via a point-and-click Data Explorer.
Custom, interactive dashboards can be created and shared with your team.

All your data in one place
Now you can explore your data with the Metric Explorer and add nearly any chart from other New Relic products to Insights.
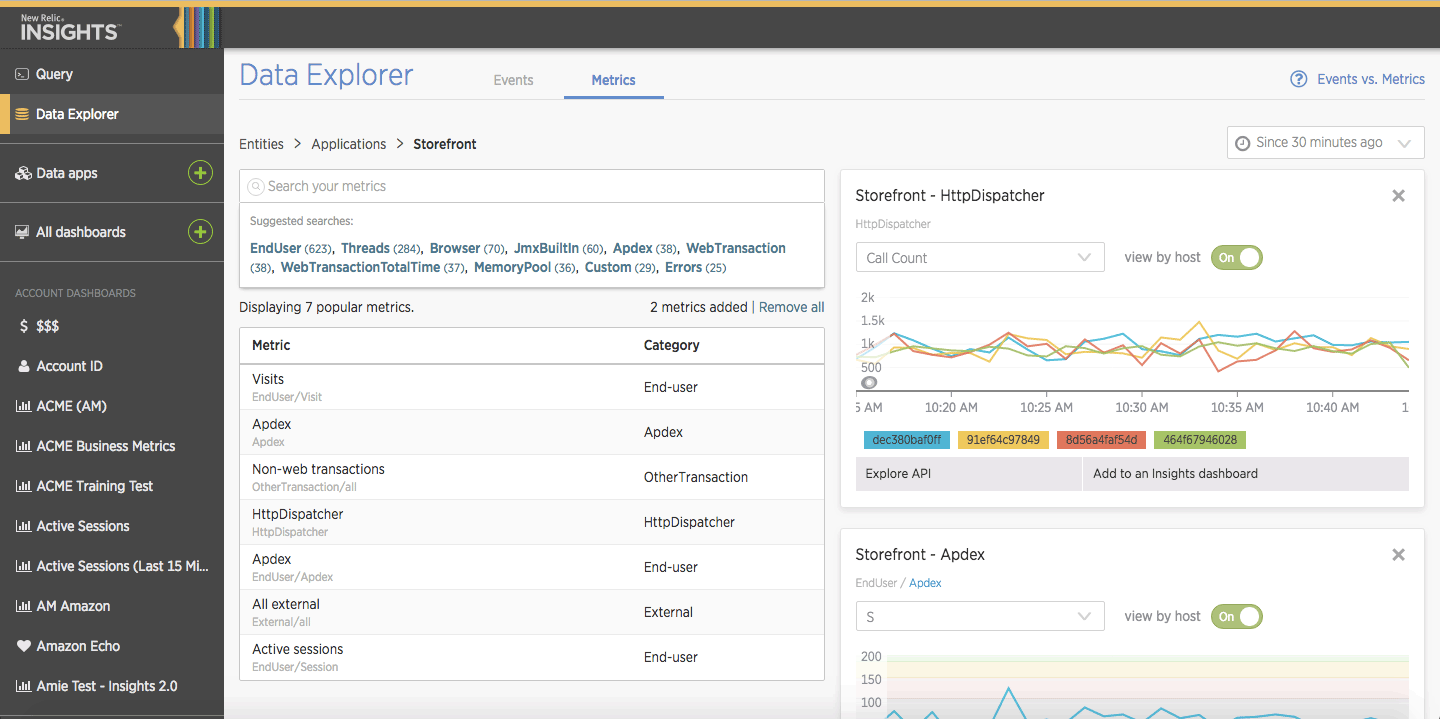
Explore your metric data.
Dig into the variety of metric data that New Relic agents automatically collect about your software, including any custom metrics that you’ve defined.
Metric and event charts together.
Add event charts and metric charts to a single Dashboard. Edit any of these charts directly in Insights.
Add-to-Insights.
Add nearly any out-of-the-box chart that you view in other New Relic products to an Insights dashboard.

“With Insights, we can see exactly how our systems are running and determine if there’s a problem worth pursuing. We’ve already realized $300,000 in savings this year and we’re not done yet.”
See Insights in action
Getting started is simple
Because New Relic Insights automatically receives event data and attributes from most New Relic products, it’s easy to start using Insights without further instrumentation.
Get the guided tour. Request a demo
Existing customer? Log in to Insights
Take a closer look
Choose a product combination below to get a closer look at how you can leverage the event data and attributes available in Insights.