Advertisements
Posted by: Doug Henwood | June 29, 2017

Fresh audio product

Just added to my radio archive (click on date for link):

June 29, 2017 Robert Pollin works out the economics of single-payer in California (paper here) • Michael McCarthy, author of Dismantling Solidarity, on the history of pension funds in the U.S.

Advertisements
Posted by: Doug Henwood | June 23, 2017

Fresh audio product

Just added to my radio archive (click on date for link):

June 22, 2017 Kate Gordon of the Paulson Institute on climate, the Paris Accords, and China • Nancy MacLean, author of Democracy in Chains, on right-wing scheming, particularly James Bucahan and Charles Koch

Posted by: Doug Henwood | June 15, 2017

Fresh audio product

Just added to my radio archive:

June 15, 2017 Tim Shorrock (his Nation articles are listed here) on the two Koreas, North and South • Margaret Corvid on the aftermath of the surprise British election results

Posted by: Doug Henwood | June 9, 2017

Hahaha

Great moments in political analysis:

Bill Clinton, November 2016:

Bill Clinton branded Labour’s Jeremy Corbyn the “maddest person in the room” in a speech he gave explaining the resurgence of left-wing politics in Europe and America.

Documents released by Wikileaks show the former President joked that when Mr Corbyn won his leadership contest, it appeared Labour had just “got a guy off the street” to run the party.

Barack Obama, December 2016:

President Barack Obama has suggested that Jeremy Corbyn’s Labour Party is “disintegrating” because it has lost touch with “fact and reality”.

Mr Obama said that the Democrats are not at risk of “Corbynisation” and that even the party’s more left-wing figures like Bernie Sanders are more moderate than Jeremy Corbyn.

In an interview with David Axelrod, who advised the former Labour leader Ed Miliband, Mr Obama was asked if he feared that the democrats could fall apart like Labour.

He replied:  “I don’t worry about that, partly because I think the Democratic Party has stayed pretty grounded in fact and reality.”

Washington Post, April 2017:

After hard-left turn under Jeremy Corbyn, Britain’s Labour Party on course for historic defeat

[W]ith less than six weeks to go before Britain votes once more, the Corbyn-led Labour Party is on course for an electoral beatdown so broad and deep it would make the drubbing the party took in 2015 look like a triumph.

Posted by: Doug Henwood | June 8, 2017

Fresh audio product

Just added to my radio archive:

June 8, 2017 Yasha Levine, author of the forthcoming Surveillance Valley, on Russia, the NSA, and the Intercept election hacking leak • Angela Nagle, author of Kill All Normies, on the alt-right

Posted by: Doug Henwood | June 5, 2017

Jobs nonsense from ZeroHedge

ZeroHedge is ridiculous and terrible, a fever swamp of conspiracism, far-right paranoia, and permabearishness. Spreading disinformation about the employment statistics might not be their worst sin, but decent naïfs often fall for this sort of thing, so it’s worth a refutation.

The Bureau of Labor Statistics applies a statistical model, known as the birth/death model, to its monthly survey of employers—the source of “the U.S. economy created x thousand jobs last month” headline. The survey covers over 600,000 employing establishments, but misses new business formations at first. The b/d model is an attempt to account for those overlooked jobs created by new businesses. (As its name suggests, the model also tries to account for business failures, but in normal times, those are far outweighed by new establishments.)

Ever on the lookout for a gloomy conspiracy, ZH found an advisory firm that says that this b/d model is responsible for almost all the job growth since 2008—93%, to be precise. What ZH doesn’t tell you is that the BLS cross-checks its monthly establishment survey once a quarter with the near-complete coverage of the U.S. formal employment universe provided by the unemployment insurance system, and releases a set of revisions to the employment data every year benchmarked to that UI count. With those benchmark revisions, the BLS retunes the b/d model based on the previous year’s results. Since 2000, the benchmark revisions have averaged 0.1% of total employment; since 2009, 0.0%. Disregarding signs and just averaging the absolute values of the revisions yields 0.2% since 2000, and 0.1% since 2009. (The fact that the averages of the absolute values are slightly larger than the averages of the signed revisions suggests that the monthly measures are not biased in one direction or other.)

What this shows is not that the BLS numbers are fake but, quite to the contrary, that its models are actually very good. And it shows that ZH and its source have no idea what they’re talking about.

Tyler Durden must have gotten punched in the head too many times.

Posted by: Doug Henwood | May 25, 2017

Fresh audio product

Just added to my radio archive:

May 25, 2017 James Whitman, author of Hitler’s American Model, on the U.S. origins of Nazi race law • Alex Gourevitch, contributor to this Boston Review roundtable, on strikes and their challenge to bourgeois law

Posted by: Doug Henwood | May 20, 2017

Fresh audio product

Just added to my radio archive (click on date for link):

May 18, 2017 Anne Elizabeth Moore, author of Body Horror, on homeownership, chronic illness, getting revenge on rapists, and the working conditions of models • Greg Kaplan, co-author of this paper, on the (stagnating) course of lifetime incomes

Posted by: Doug Henwood | May 17, 2017

The post-Trump era?

How much longer can this go on? As I write this, PredictIt gives 71/29 odds that Trump will last the year, but it’s mighty tempting to buy the “no”—especially after the revelation that he asked Comey to shut down the Flynn investigation. (Disclosure alert: I bought 100 shares of “no” at $0.28.)

What is the endgame of the people, mostly Democrats, pounding the drums most heavily? Do they want to impeach Trump, which seems a long shot given Republican control of Congress? Do they want to bruise his weak ego so badly that he resigns? Clearly the job is much harder than he ever imagined—and, by the way, what reasonably sentient person over the age of 8 ever thought the presidency wasn’t grindingly hard? But he also wants adulation, not the relentless volleys of shit he’s gotten. It’s not impossible to imagine him just walking offstage, especially if his legal situation gets seriously dicey.

What then? President Pence? If Pence were president, the entire Republican dream agenda would sail through Congress in like three weeks. Pence spent a dozen years in Congress (Tea Party branch) and four years as governor of Indiana; he’s an appalling figure but he knows how things work. He might not be able to overcome his party’s internal divisions, but he probably could do a better job than Trump, and every day would not be a circus as it is now.

DonnyMike

Pence is a horror—fiscal sadist, misogynist, homophobe, lover of the carceral state. He’s repeatedly described himself as “a Christian, a conservative, and a Republican, in that order,” though given today’s modern GOP, it’s not clear there’s much of a difference among these features. (He should have said he’s a reactionary Christian; there are plenty of other kinds.) He’s a creationist who rejects climate change, thinks stem cell research is “obsolete,” and once actually said that “smoking doesn’t kill.” His anti-abortion law was the most extreme in the country. His cuts to Planned Parenthood led to a rural HIV epidemic. Like Sessions, Pence is a maximalist on drugs, including weed. He’s hot to privatize Social Security. He likened the Supreme Court’s upholding of Obamacare to 9/11.

Should Trump get pushed out, the orchestrated campaign of healing would be painful. It’s not far-fetched to imagine leading Democrats channelling Gerald Ford’s “our long national nightmare is over.” There would be something of what Wall Street calls a “relief rally” on the transition, and it would perversely grease the way for Pence to make the U.S. more like the Indiana he left behind. We should be fighting to keep him in office, as fatally damaged goods.

Several things seem to be driving this campaign to squeeze Trump out, aside from the obvious fact he’s an unstable ignoramus. Dems still can’t get over the fact that they lost to the most unpopular candidate in the history of polling, but instead of blaming their own terrible candidate (the second-most unpopular candidate in the history of polling) and the slavers’ legacy, the Electoral College, they want to blame Russia. (Time was they blamed Comey too—remember when Paul Krugman said that “Comey and Putin installed a crazy, vindictive can’t-handle-the-truth person in the White House”? But he’s since been rehabilitated.)

But that’s not all: a large part of the political class (Hillary prominent among them, along with John McCain), the security establishment, and their contract-hungry patrons in the military–industrial complex all want desperately to make Russia the enemy, and are reviving zombie tropes from the Cold War to promote their cause. Trump may well have friends in the Russian mob, but his resistance to elite hostility towards the country is one of the few non-awful things about him.

It’s been stunning to watch liberals cheering on the security state’s war-by-leak against Trump. He’s odious, but he is the legally elected president—under an absurd electoral system, but that’s the one we’ve got. (Makes you wonder what they would have done to Sanders, if by some unimaginable fluke he’d won.) And yet we’ve seen months of praise for the CIA and the FBI as the magic bullets who could deliver us from the short-fingered vulgarian.

The defenses of the CIA began with Trump’s disparaging remarks about the Agency before taking office, which were taken as near-blasphemous. For an amateur like Trump, such attacks were extremely risky. In early January, Chuck Schumer presciently warned (on the Maddow Show, of course): “Let me tell you: You take on the intelligence community—they have six ways from Sunday of getting back at you.” You’d almost think that he knew what would come next: an endless series of leaks portraying Trump as Putin’s towel boy and, as an extra-special bonus, a pervert (the piss tape)—all applauded by liberals, with little regard for the CIA’s 70-year history of lying, assassination, and coups.

Then came the Comey firing, and suddenly the FBI was a noble organization as well. It’s far from that, and has always been. As Mark Ames reports in his little history of the Bureau, it has no legal charter; Congress didn’t want to authorize a secret police so Teddy Roosevelt created it by executive fiat. Much of the Bureau’s history was been about persecuting communists—and gay people—and smearing its enemies. It spent the 1960s and early 1970s trying to ruin Martin Luther King, the Black Panthers, and and the New Left. In other words, it’s been political from the very first, and all these current worries about “politicizing” the FBI are Grade A bullshit.

Which brings us back to the endgame issue. Democrats look to be extending the strategy of their failed 2016 campaign by being the not-Trump and nothing more—it’s all they’ve got. They are making no visible effort to come up with an appealing agenda as an alternative to the deeply unpopular one the GOP has on offer. In fact, they’re annoyed at Bernie Sanders for trying to get the party to talk about policy, which is somehow seen as an act of narcissism in the Beltway worldview:

But the senator, who’ll be 79 the next time the New Hampshire primary rolls around, is continuing to put himself at the center of the conversation. He’s introduced a Medicare-for-all bill this week that he hopes will force others to sign on.

Imagine that! Pushing a bill to expand health insurance coverage at a moment when Republicans are trying to take it away. The ego of that man.

The party’s strategy can’t be counted a success on conventional measures; Gallup reports that the Dems have lost 5 approval points since November, leaving the two parties with near-identical approval ratings (D: 40%, R: 39%).

Party popularity


During the early days of the Trump administration, it seemed like a serious left opposition might take form. That‘s a hazy memory now that so many liberals and even leftists are taking dictation from the security state and throwing around words like “treason.” We can do better than this, can’t we?

Posted by: Doug Henwood | May 4, 2017

Fresh audio product

Just uploaded to my radio archive (click the date to get there):

May 4, 2017 Margaret Corvid on the British election, the Labour Party—and sex work • Emre Öngün on Turkey’s deeper slide into authoritarianism

Posted by: Doug Henwood | April 27, 2017

Fresh audio product

Just added to my radio archive:

April 27, 2017 Sebastian Budgen on the French election: the neoliberal vs. the neofascist • Sofia Japaridze on how foreign NGOs turned Georgia (the country) into a broke libertarian paradise

Posted by: Doug Henwood | April 21, 2017

Fresh audio product

Just added to my radio archive (click on date to get there):

April 20, 2017 Thea Riofrancos on Ecuador, where the pink tide has not gone out • Harrison Fluss and Landon Flim (authors of this and this) on the philosophy of the alt-right

Posted by: Doug Henwood | April 18, 2017

How employed are we?

A few weeks ago, I made fun of Sean Spicer for this word salad:

I think there’s a question between the total number of people that are employed, and the President’s comments in the past have reflected that his big concern was getting to the bottom of how many people are working in this country, and that the denominator—meaning the percentage rate of the total number of people—is not the most accurate reflection of how many people are employed in this country.

And, God knows, he deserves a strong dose of mockery. But he seemed to be staggering around a serious point: the unemployment rate tells only a partial story about the job market. If that rate is low because a lot of people have given up on the job search as hopeless, and are therefore not counted as unemployed, then a low unemployment rate would be telling a misleading story. (For more on that, see the post linked to above.) So does Spicer—channeling Trump—have an actual point here, even if he’s incapable of expressing it?

Yes he does. Despite years of recovery from the depths of the Great Recession (GR), the so-called employment/population ratio (EPOP)—the share of the noninstitutional population over the age of 16 working for pay—remains below earlier cyclical peaks. (“Noninstitutional” means not in a prison, mental hospital, or a nursing home. Given the vast size of the U.S. prison population, this is not a small consideration—but it’s one for another post.) If the same share of the population were employed today as was in December 2007, just as the GR was taking hold, 4.3 million more people would have jobs. If it were the same share as the all-time high in April 2000, 7.3 million more people would be working for pay. Either one is a big number, even in a country where 153 million people are employed.

Here are some graphs to make the point. First, the broad EPOP since the modern monthly numbers—computed from a very large survey of households—began in 1948.

EPOP all

Several things stand out from this graph. First, compared to those for men and women, the “all” line looks rather flat. It began at 56.6% in 1948, and was at 60.1% in March 2017—down from a peak of 64.7% in April 2000. But the gendered lines take very different trajectories. The male EPOP has been in a steady downtrend, intensified during the GR—for most of the past seven decades, from 83.8% in January 1948 to 66.0% in March 2017. At the overall peak in 2000, 72.1% of adult men were working. In contrast, the women’s line rose more steadily than men’s fell, from 30.9% to a peak of 58.0% in 2000, a near-doubling; it’s since drifted lower, to 54.7% last month. To return to the peak 2000 EPOPs, 4.9 million more men and 2.8 million more women would need to find work. Though women suffer plenty of discrimination in the labor market, and more men are employed than women, the GR was a lot harder on men (though the recovery from those lows has been kinder to them).

Why has the U.S. economy failed to generate enough jobs to return to pre-2007 levels of employment? (I’ll bracket the gender angle for now, except to say that long-term structural changes have taken a toll on male-heavy industries like manufacturing while they’ve boosted female-heavy ones like retail and health care.) It’s not that robots are taking our jobs. Productivity growth is close to zero now—a sharp contrast with the years leading up to the 2000 employment peak, when it was very strong, as was employment growth. (More on this in another future post.)

An explanation favored by Democrats during the Obama years was the aging of the population; older cohorts are employed at a lower rate than younger ones. But that’s only a partial explanation. Economic growth has been very slow in this expansion, the slowest of any since the end of World War II. Strange as it may seem, employment growth has actually been stronger than GDP growth would suggest, based on their tight historical correlation. If robots really were the culprit, the reverse would be true.

Let’s look more closely at the aging issue. Here are some graphs showing the EPOP by age cohort. First, so-called prime-age workers, those aged 25 to 54.

EPOP prime

The long-term decline in male employment is softer, and the rise in female, stronger, but the story is not profoundly different from the overall graph above.

Next, younger workers.

EPOP younger

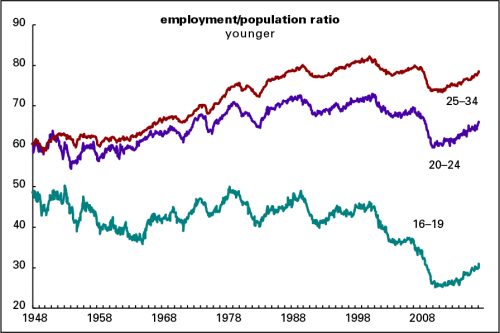
Teen employment is sharply below where it was in 2000, though it’s recovered some since the depths of 2009–2010. These trends are milder for the 20–24 set, and milder still for the 25–34 group. One reason for the weakness among the younger is that more people in their late teens and early 20s are going to school. This will presumably lead to improved job prospects in the future, contrary to some of the fashionable clichés to the contrary floating around now. (More on this too in a future post.) But even those aged 25–34, who are getting established in the job market rather than just setting out, are employed at lower levels than in 2000 or 2007. Some of this may be lingering damage to their careers inflicted during the GR, but we don’t know for sure yet.

And now older workers.

EPOP older

Those aged 35–44 and 45–54 have yet to return to their 2000 and 2007 peaks—but those aged 55–64 have, and those over 65 have surpassed them (though obviously a much smaller share of the 65+ population is working than the rest). One can only surmise that a weakening pension system is at least partly responsible: many older people just can’t afford to retire as they once did.

Here’s a summary graph of the change in EPOPs since 2000.

EPOP change since 2000

On this evidence, the aging population theory doesn’t hold much water, since EPOPs for the five youngest cohorts have fallen, and those for the oldest have risen.

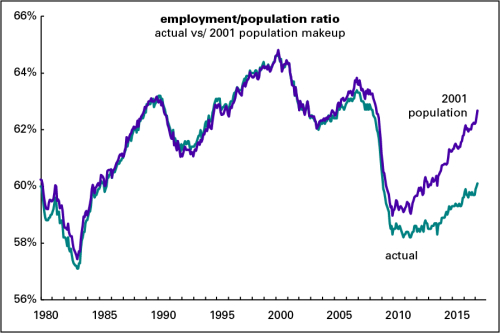
Another approach would be to do a statistical simulation of what the EPOP would look like were the population’s age structure like it was back in the early days of the millennium. That’s what I did here: the simulation is done by taking the EPOPs of each cohort and creating a weighted average using 2001 population shares. (I used 2001 because that’s when the business cycle peak happened, even though EPOP peaked a year ahead of the broad economy. The difference between using 2000 and 2001 shares is trivial.) These calculations are rough. I used only broad age ranges for the cohorts; doing it more precisely would use much narrower age ranges. But that wouldn’t change the broad conclusion: an aging population explains about half the shortfall in the EPOP.

EPOP - actual vs 2001 pop

What else is responsible for EPOP’s sluggish behavior? The prime culprit is slow GDP growth, which is running at less than half the post-World War II average for a business cycle expansion (2.1% vs. 4.4%). Growth rates have been declining with each successive upswing since 1991, but this one is the weakest by a fairly wide margin.

Business cycle averages

Why has growth been so slow? This too is a topic in itself but there are several reasons. One, popular among mainstream economists, is that very deep recessions, like the 2008–2009 affair, have historically left deep scars that make recovery slow and difficult. Another, less orthodox, way of interpreting those “scars” is that a very deep recession is itself a sign of serious structural problems beyond the normal ups and downs of capitalist economies. In the U.S. case, the long-term problem is that the squeeze on wages and living standards that began in the early 1980s succeeded in raising corporate profitability (and in making the rich very much richer), but at the expense of undermining the foundations of an economy dependent on high levels of mass consumption. That contradiction was resolved for a while by rampant levels of borrowing, which compensated for stagnant wage and salary income. But with the financial crisis of 2007–2008, that aggressive borrowing was thrown into reverse, and households began to reduce their debts—which made sense at the level of the individual household, but put a lid on consumer demand. That problem could be mitigated by policies to shift income downward, through higher wages and more generous spending on social programs and infrastructure, but those routes look politically impossible. In other words, the neoliberal model has run out of steam, but there’s nothing to take its place.

And yet another explanation is that despite copious profits, firms are shoveling vast pots of cash to their executives and shareholders rather than investing in capital equipment and hiring workers. From 1952 to 1982, nonfinancial corporations distributed 17% of their internal cash flow (profits plus depreciation allowances) to shareholders; that rose to about 30% in the 1980s and 1990s, and to 48% since 2000. (In 2016, the average was an incredible 64%.) This is one result of the shareholder revolution that began in the early 1980s: the whole point of corporations’ existence is to raise the stock price and make their shareholders, who contribute literally nothing for all their taking, richer. More on all that in a future post too.

Posted by: Doug Henwood | April 17, 2017

Job demographics

Paul Krugman asks plaintively “why don’t all jobs matter?” To answer, he enlists the help of Slate’s Jamelle Bouie:

Finally, it’s hard to escape the sense that manufacturing and especially mining get special consideration because, as Slate’s Jamelle Bouie points out, their workers are a lot more likely to be male and significantly whiter than the work force as a whole…. Laid-off retail workers and local reporters are just as much victims of economic change as laid-off coal miners.

The loss of newspaper jobs, a trend of many years, has been very bad news for society as well as reporters—and the damage speaks to all of us in journalism, no matter how marginal. (See here for more on the grim employment picture.) The loss of retail jobs is a phenomenon of the last two months—employment in the sector was down 61,000 in February and March, but it was up 198,000 in the year ending in January. This shrinkage may be a new trend, as online shopping displaces the mall, but we’d need some more data before we can be sure this isn’t just statistical noise.

Unlike retail, the loss of manufacturing and mining jobs is a long-standing trend. Manufacturing accounted for 30% of total employment in 1950; that was down to 21% in 1980, and 8% in March 2017. Since 1980, overall employment is up by 55 million jobs—but manufacturing is down by almost 7 million. Over the same period, retail rose by almost 6 million; health care, 16 million; and bars and restaurants, 12 million.

Detailed data for the mining sector doesn’t go as far back as manufacturing, but it’s a similar story of relentless decline, though from a much smaller starting point. The entire mining and logging sector was 1.5% of total employment in 1958 (when the numbers begin); that was down to 1.1% in 1980, and 0.4% in March 2017. The sector includes oil and gas, which started losing share in the mid-1980s, with the collapse in oil prices; it went from 0.3% of total employment in 1982 to 0.1% in 2005. Then fracking kicked in, taking the share up a few hundredths of a percentage point over the last decade. Coal mining has long been a tiny sector, accounting for just 0.2% of total employment when the stats begin in 1985 (or 0.18%, to be more precise), to just 0.03% last month. That’s just 50,000 jobs in coal mining, which is about a week’s worth of employment growth at current rates. That’s 120,000 fewer than in 1985, but 170,000 jobs wasn’t all that much even 32 years ago.

What about the Krugman/Bouie explanation for why these sectors matter? Yes, mining is very heavily white and especially male. (See table 9 here for the raw data.) Almost 80% of the sector’s workers are white and male, nearly twice their share of the overall workforce. (The culture of mining is also deeply macho.) But there’s another reason coal miners get attention: because of our crazy system of voting, coal mining states like West Virginia are disproportionately important in the electoral map.

Manufacturing is another story. Almost 70% of the sector’s workforce is male—though 30% is female, not a trivial share. But it’s not a “white” sector: just over 6% of its workers are black men, compared with their 5% share of the overall workforce. Another 11% of factory employment is accounted for by Latino men, a point above their share of the workforce. Asian men are also overrepresented in manufacturing (4% in the sector, 3% overall). Just ask your average resident of Detroit or Gary whether they feel like the decline of manufacturing is a white issue.

There’s another reason for the attention paid to the loss of mining and manufacturing job: pay. In March 2017, average hourly earnings in the service sector were $25.86 (not including fringe benefits). They were $32.54 in mining and logging, 26% higher. Manufacturing paid on average $26.37 an hour, 2% above the service sector average—down from an almost 10% premium in 1980. Average earnings in retail were $18.01 an hour, 30% below the service sector average. And workweeks in retail are short—just over 30 hours, compared to almost 41 in manufacturing. So the average weekly wage in retail is $554; in manufacturing, $1,071, nearly twice as high. Almost 9% of manufacturing workers are unionized, compared with 4% in retail. And 92% of manufacturing workers have access to health insurance benefits, compared with 56% in retail.

Yes, mining and manufacturing jobs are often dirty, dull, and dangerous. But there are some good reasons other than bigotry why their loss is widely mourned. The 2008 winner of the Bank of Sweden Prize in Economic Sciences in Memory of Alfred Nobel should know this. Krugman is right that we could do much more to “limit the human damage” when jobs disappear. But it just doesn’t look good when urban elites are so out of touch with life in less favored zones.

Posted by: Doug Henwood | April 13, 2017

Fresh audio product

Just added to my radio archive. Click on the date for the link.

April 13, 2017 Max Sawicky on Republican tax schemes • Vijay Prashad on Syria


Older Posts »

Categories

%d bloggers like this: