About

Ian Ozsvald picture

This is Ian Ozsvald's blog (@IanOzsvald), I'm an entrepreneurial geek, a Data Science/ML/NLP/AI consultant, author of O'Reilly's High Performance Python book, co-organiser of PyDataLondon, a Pythonista, co-founder of ShowMeDo and also a Londoner. Here's a little more about me.

High Performance Python book with O'Reilly

View Ian Ozsvald's profile on LinkedIn

ModelInsight Data Science Consultancy London Protecting your bits. Open Rights Group

1 July 2017 - 17:38Kaggle’s Mercedes-Benz Greener Manufacturing

Kaggle are running a regression machine learning competition with Mercedes-Benz right now, it closes in a week and runs for about 6 weeks overall. I’ve managed to squeeze in 5 days to have a play (I managed about 10 days on the previous Quora competition). My goal this time was to focus on new tools that make it faster to get to ‘pretty good’ ML solutions. Specifically I wanted to play with:

Most of the 5 days were spent either learning the above tools or making some suggestions for YellowBrick, I didn’t get as far as creative feature engineering. Currently I’m in the top 50th percentile on the leaderboard using raw features, some dimensionality reduction and various estimators.

TPOT is rather interesting – it uses a genetic algorithm approach to evolve the hyperparameters of one or more (Stacked) estimators. One interesting outcome is that TPOT was presenting good models that I’d never have used – e.g. an AdaBoostRegressor & LassoLars or GradientBoostingRegressor & ElasticNet.

TPOT works with all sklearn-compatible classifiers including XGBoost (examples) but recently there’s been a bug with n_jobs and multiple processes. Due to this the current version had XGBoost disabled, it looks now like that bug has been fixed. As a result I didn’t get to use XGBoost inside TPOT, I did play with it separately but the stacked estimators from TPOT were superior. Getting up and running with TPOT took all of 30 minutes, after that I’d leave it to run overnight on my laptop. It definitely wants lots of CPU time. It is worth noting that auto-sklearn has a similar n_jobs bug and the issue is known in sklearn.

It does occur to me that almost all of the models developed by TPOT are subsequently discarded (you can get a list of configurations and scores). There’s almost certainly value to be had in building averaged models of combinations of these, I didn’t get to experiment with this.

Having developed several different stacks of estimators my final combination involved averaging these predictions with the trustable-model provided by another Kaggler. The mean of these three pushed me up to 0.55508. My only feature engineering involved various FeatureUnions with the FunctionTransformer based on dimensionality reduction.

YellowBrick was presented at our PyDataLondon 2017 conference (write-up) this year by Rebecca (we also did a book signing). I was able to make some suggestions for improvements on the RegressionPlot and PredictionError along with sharing some notes on visualising tree-based feature importances (along with noting a demo bug in sklearn). Having more visualisation tools can only help, I hope to develop some intuition about model failures from these sorts of diagrams.

Here’s a ResidualPlot with my added inset prediction errors distribution, I think that this should be useful when comparing plots between classifiers to see how they’re failing:


Ian applies Data Science as an AI/Data Scientist for companies in ModelInsight, sign-up for Data Science tutorials in London. Historically Ian ran Mor Consulting. He also founded the image and text annotation API Annotate.io, co-authored SocialTies, programs Python, authored The Screencasting Handbook, lives in London and is a consumer of fine coffees.

No Comments | Tags: Data science, pydata, Python

7 June 2017 - 18:10Kaggle’s Quora Question Pairs Competition

Kaggle‘s Quora Question Pairs competition has just closed, I’m pleased to say that with 10 days effort I ranked in the top 39th percentile (rank 1346 of 3396 in the private leaderboard). Having just run and spoken at PyDataLondon 2017, taught ML in Romania and worked on several client projects I only freed up time right at the end of this competition. Despite joining at the end I had immense fun – this was my first ‘proper’ Kaggle competition.

I figured a short retrospective here might be a useful reminder to myself in the future. Things that worked well:

  • Use of github, Jupyter Notebooks, my research module template
  • Python 3.6, scikit-learn, pandas
  • RandomForests (some XGBoost but ultimately just RFs)
  • Dask (great for using all cores when feature engineering with Pandas apply)
  • Lots of text similarity measures, word2vec, some Part of Speech tagging
  • Some light text clean-up (punctuation, whitespace, some mixed case normalisation)
  • Spacy for PoS noun extraction, some NLTK
  • Splitting feature generation and ML exploitation into different Notebooks
  • Lots of visualisation of each distance measure by class (mainly matplotlib histograms on single features)
  • Fully reproducible Notebooks with fixed seeds
  • Debugging code to diagnose the most-wrong guesses from the model (pulling out features and the raw questions was often enough to get a feel for “what it missed” which lead to thoughts on new features that might help)

Things that I didn’t get around to trying due to lack of time:

  • PoS named entities in Spacy, my own entity recogniser
  • GloVe, wordrank, fasttext
  • Clustering around topics
  • Text clean-up (synonyms, weights & measures normalisation)
  • Use of external corpus (e.g. Stackoverflow) for TF-IDF counts
  • Dask on EC2

Things that didn’t work so well:

  • Fully reproducible Notebooks (great!) to generate features with no caching of no-need-to-rebuild-yet-again features, so I did a lot of recalculating features (which really hurt in the last 2 days) – possible solution below with named columns
  • Notebooks are still a PITA for debugging, attaching a console with –existing works ok until things start to crash and then it gets sticky
  • Running out of 32GB of RAM several times on my laptop and having a semi-broken system whilst trying to persist partial models to disk – I should have started with an AWS deployment earlier so I could easily turn on more cores+RAM as needed
  • I barely checked the Kaggle forums (only reading the Notebooks concerning the negative resampling requirement) so I missed a whole pile of tricks shared by others, some I folded in on the last day but there’s a huge pile that I missed – I think I might have snuck into the top 20% of rankings if I’d have used this public information
  • Calibrating RandomForests (I’m pretty convinced I did this correctly but it didn’t improve things, I’m not sure why)

Dask definitely made parallelisation easier with only a few lines of overhead in a function beyond a normal call to apply. The caching, if using something like luigi, would add a lot of extra engineered overhead – not so useful in a rapidly iterating 10 day competition.

I think next time I’ll try using version-named columns in my DataFrames. Rather than having e.g. “unigram_distance_raw_sentences” I might add “_v0”, if that calculation process is never updated then I can just use a pre-built version of the column. This is a poor-mans caching strategy. If any dependencies existed then I guess luigi/airflow would be the next step. For now at least I think a version number will solve my most immediate time-sink in recent days.

I hope to enter another competition soon. I’m also hoping to attend the London Kaggle meetup at some point to learn from others.


Ian applies Data Science as an AI/Data Scientist for companies in ModelInsight, sign-up for Data Science tutorials in London. Historically Ian ran Mor Consulting. He also founded the image and text annotation API Annotate.io, co-authored SocialTies, programs Python, authored The Screencasting Handbook, lives in London and is a consumer of fine coffees.

1 Comment | Tags: ArtificialIntelligence, Python

1 June 2017 - 15:30PyDataLondon 2017 Conference write-up

Several weeks back we ran our 4th PyDataLondon (2017) conference – it was another smashing success! This builds on our previous 3 years of effort (2016, 2015, 2014) building both the conference and our over-subscribed monthly meetup. We’re grateful to our host Bloomberg for providing the lovely staff, venue and catering.

Really got inspired by @genekogan’s great talk on AI & the visual arts at @pydatalondon @annabellerol

Each year we try some new ideas – this year we tried:

pros: Great selection of talks for all levels and pub quiz cons: on a weekend, pub quiz (was hard). Overall would recommend 9/10 @harpal_sahota

We’re very thankful to all our sponsors for their financial support and to all our speakers for donating their time to share their knowledge. Personally I say a big thank-you to Ruby (co-chair) and Linda (review committee lead) – I resigned both of these roles this year after 3 years and I’m very happy to have been replaced so effectively (ahem – Linda – you really have shown how much better the review committee could be run!). Ruby joined Emlyn as co-chair for the conference, I took a back-seat on both roles and supported where I could. Our volunteer team great again – thanks Agata for pulling this together.

I believe we had 20% female attendees – up from 15% or so last year. Here’s a write-up from Srjdan and another from FullFact (and one from Vincent as chair at PyDataAmsterdam earlier this year) – thanks!

#PyDataLdn thank you for organising a great conference. My first one & hope to attend more. Will recommend it to my fellow humanists! @1208DL

For this year I’ve been collaborating with two colleagues – Dr Gusztav Belteki and Giles Weaver – to automate the analysis of baby ventilator data with the NHS. I was very happy to have the 3 of us present to speak on our progress, we’ve been using RandomForests to segment time-series breath data to (mostly) correctly identify the start of baby breaths on 100Hz single-channel air-flow data. This is the precursor step to starting our automated summarisation of a baby’s breathing quality.

Slides here and video below:

This updates our talk at the January PyDataLondon meetup. This collaboration came about after I heard of Dr. Belteki’s talk at PyConUK last year, whilst I was there to introduce RandomForests to Python engineers. You’re most welcome to come and join our monthly meetup if you’d like.

Many thanks to all of our sponsors again including Bloomberg for the excellent hosting and Continuum for backing the series from the start and NumFOCUS for bringing things together behind the scenes (and for supporting lots of open source projects – that’s where the money we raise goes to!).

There are plenty of other PyData and related conferences and meetups listed on the PyData website – if you’re interested in data then you really should get along. If you don’t yet contribute back to open source (and really – you should!) then do consider getting involved as a local volunteer. These events only work because of the volunteered effort of the core organising committees and extra hands (especially new members to the community) are very welcome indeed.

I’ll also note – if you’re in London or the south-east of the UK and you want to get a job in data science you should join my data scientist jobs email list, a set of companies who attended the conference have added their jobs for the next posting. Around 600 people are on this list and around 7 jobs are posted out every 2 weeks. Your email is always kept private.


Ian applies Data Science as an AI/Data Scientist for companies in ModelInsight, sign-up for Data Science tutorials in London. Historically Ian ran Mor Consulting. He also founded the image and text annotation API Annotate.io, co-authored SocialTies, programs Python, authored The Screencasting Handbook, lives in London and is a consumer of fine coffees.

No Comments | Tags: Data science, Life, pydata, Python

27 January 2017 - 13:06Introduction to Random Forests for Machine Learning at the London Python Meetup

Last night I had the pleasure of returning to London Python to introduce Random Forests (this builds on my PyConUK 2016 talk from September). My goal was to give a pragmatic introduction to solving a binary classification problem (Kaggle’s Titanic) using scikit-learn. The talk (slides here) covers:

  • Organising your data with Pandas
  • Exploratory Data Visualisation with Seaborn
  • Creating a train/test set and using a Dummy Classifier
  • Adding a Random Forest
  • Moving towards Cross Validation for higher trust
  • Ways to debug the model (from the point of view of a non-ML engineer)
  • Deployment
  • Code for the talk is a rendered Notebook on github

I finished with a slide on Community (are you contributing? do you fulfill your part of the social contract to give back when you consume from the ecosystem?) and another pitching PyDataLondon 2017 (May 5-7th). My colleague Vincent is over from Amsterdam – he pitched PyDataAmsterdam (April 8-9th). The Call for Proposals is open for both, get your talk ideas in quickly please.

I’m really happy to see the continued growth of the London Python meetup, this was one of the earliest meetups I ever spoke at. The organisers are looking for speakers – do get in touch with them via meetup to tell them what you’d like to talk on.


Ian applies Data Science as an AI/Data Scientist for companies in ModelInsight, sign-up for Data Science tutorials in London. Historically Ian ran Mor Consulting. He also founded the image and text annotation API Annotate.io, co-authored SocialTies, programs Python, authored The Screencasting Handbook, lives in London and is a consumer of fine coffees.

No Comments | Tags: Data science, Python

20 January 2017 - 18:54PyDataLondon 2017 Conference Call for Proposals Now Open

This year we’ll hold our 4th PyDataLondon conference during May 5th-7th at Bloomberg (thanks Bloomberg!). Our Call for Proposals is open and will run during February (closing date to be confirmed so don’t just forget about it! – get on with making a draft submission soon).

We want talks at all levels (first timers especially welcome) from beginner to advanced, we want both regular talks and tutorials. We’ll be experimenting with the overflow room just as we did last year (possibly including Office Hours and ‘how to contribute to open source’ workshops).

Take a look at the 2016 Schedule to see the range of talks we had – engineering, machine learning, deep learning, visualisation, medical, finance, NLP, Big Data – all the usual suspects. We want all of these and more.

Personally I’m especially interested in:

  • talks that cover the communication of complex data (think – bad Daily Mail Brexit graphics and how we might help people communicate complex ideas more clearly)
  • encouraging collaborations between sub-groups.
  • building on last year’s medical track with more medical topics
  • getting journalists involved and sharing their challenges and triumphs
  • and I’d love to be surprised – if you think it’ll fit – put in a submission!

The process of submitting is very easy:

  • Go to the website and sign-up to make an account (you’ll need a new one even if you submitted last year)
  • Post a first-draft title and abstract (just a one-liner will do if you’re pressed for time)
  • Give it a day, log back in and iterate to expand on this
  • If your submission is too short then the Review Committee will tell you that you don’t meet the minimum criteria, so you’ll get nagged – but only if you’ve made an attempt first!
  • Iterate, integrating feedback from the Committee, to improve your proposal
  • Keep your fingers crossed that you get selected

We’re also accepting Sponsorship requests, take a look on the main site and get in contact. We’ve already closed some of the options so if you’d like the price list – get in contact via the website right away.

I’d like to extend a Thank You to the new and larger Review Committee. I’ve handed over the reigns on this, many thanks to the new committee for their efforts.


Ian applies Data Science as an AI/Data Scientist for companies in ModelInsight, sign-up for Data Science tutorials in London. Historically Ian ran Mor Consulting. He also founded the image and text annotation API Annotate.io, co-authored SocialTies, programs Python, authored The Screencasting Handbook, lives in London and is a consumer of fine coffees.

No Comments | Tags: Data science, pydata, Python

23 September 2016 - 12:28Practical ML for Engineers talk at #pyconuk last weekend

Last weekend I had the pleasure of introducing Machine Learning for Engineers (a practical walk-through, no maths) [YouTube video] at PyConUK 2016. Each year the conference grows and maintains a lovely vibe, this year it was up to 600 people! My talk covered a practical guide to a 2 class classification challenge (Kaggle’s Titanic) with scikit-learn, backed by a longer Jupyter Notebook (github) and further backed by Ezzeri’s 2 hour tutorial from PyConUK 2014.

Debugging slide from my talk (thanks Olivia)

Debugging slide from my talk (thanks Olivia)

Topics covered include:

  • Going from raw data to a DataFrame (notable tip – read Katharine’s book on Data Wrangling)
  • Starting with a DummyClassifier to get a baseline result (everything you do from here should give a better classification score than this!)
  • Switching to a RandomForestClassifier, adding Features
  • Switching from a train/test set to a cross validation methodology
  • Dealing with NaN values using a sentinel value (robust for RandomForests, doesn’t require scaling, doesn’t require you to impute your own creative values)
  • Diagnosing quality and mistakes using a Confusion Matrix and looking at very-wrong classifications to give you insight back to the raw feature data
  • Notes on deployment

I had to cover the above in 20 minutes, obviously that was a bit of a push! I plan to cover this talk again at regional meetups, probably with 30-40 minutes. As it stands the talk (github) should lead you into the Notebook and that’ll lead you to Ezzeri’s 2 hour tutorial. This should be enough to help you start on your own 2 class classification challenge, if your data looks ‘somewhat like’ the Titanic data.

I’m generally interested in the idea of helping more engineers get into data science and machine learning. If you’re curious – I have a longer set of notes called Data Science Delivered and some vague plans to maybe write a book (maybe) – for the book join the mailing list here if you’d like to hear more (no hard sell, almost no emails at the moment, I’m still figuring out if I should do this).

You might also want to follow-up on Katharine Jarmul’s data wrangling talk and tutorial, Nick Radcliffe’s Test Driven Data Analysis (with new automated TDD-for-data tool to come in a few months), Tim Vivian-Griffiths’ SVM Diagnostics, Dr. Gusztav Belteki’s Ventilator medical talk, Geoff French’s Deep Learning tutorial and Marco Bonzanini and Miguel ‘s Intro to ML tutorial. The videos are probably in this list.

If you like the above then do think on coming to our monthly PyDataLondon data science meetups near London Bridge.

PyConUK itself has grown amazingly – the core team put in a huge amount of effort. It was very cool to see the growth of the kids sessions, the trans track, all the tutorials and the general growth in the diversity of our community’s membership. I was quite sad to leave at lunch on the Sunday – next year I plan to stay longer, this community deserves more investment. If you’ve yet to attend a PyConUK then I strongly urge you to think on submitting a talk for next year and definitely suggest that you attend.

The organisers were kind enough to let Kat and myself do a book signing, I suggest other authors think on joining us next year. Attendees love meeting authors and it is yet another activity that helps bind the community together.

Book signing at PyConUK

Book signing at PyConUK


Ian applies Data Science as an AI/Data Scientist for companies in ModelInsight, sign-up for Data Science tutorials in London. Historically Ian ran Mor Consulting. He also founded the image and text annotation API Annotate.io, co-authored SocialTies, programs Python, authored The Screencasting Handbook, lives in London and is a consumer of fine coffees.

9 Comments | Tags: Data science, pydata, Python

19 August 2016 - 18:47Some notes on building a conda recipe

I’ve spent the day building a conda recipe, the process wasn’t super-smooth, hopefully these notes will help others and/or maybe you can leave me a comment to improve my flow. The goal was to learn how to use conda to distribute a package that ordinarily I’d put on PyPI.

I’m using Linux 64bit (Mint 18 on an XPS 9550), conda 4.1 and conda build 1.21.14 (up to date as of today). My goal was to build a recipe (python_template_with_config_recipe) to install my python_template_with_config (a bit of boilerplate code I use sometimes when making a new project). That template has two modules, a test, a setup.py and it depends on numpy.

The short story:

  1. git clone https://github.com/ianozsvald/python_template_with_config_recipe.git
  2. cd inside, run “conda build –debug .”
  3. # note the period means “current directory” and that’s two dashes debug
  4. a local bzip will be built and  you’ll see that the 1 test ran ok

On my machine the built code ends up in “~/anaconda3/pkgs/python_template_with_config-0.1-py35_0/lib/python3.5/site-packages/python_template_with_config” and the building takes place in “~/anaconda3/conda-bld/linux-64”.

In a new conda environment I can use “conda install –use-local python_template_with_config” and it’ll install the built recipe into the new environment.

To get started with this I first made a fresh empty conda environment (note that anaconda isn’t my default Python, hence the long-form access to `conda`):

  1. $ ~/anaconda3/bin/conda create -n new_recipe_env python=3.5
  2. $ . ~/anaconda3/bin/activate new_recipe_env

To check that my existing “setup.py” runs I use pip to install from git, we’ll need the setup.py in the conda recipe later so we want to confirm that it works:

  • $ pip install git+https://github.com/ianozsvald/python_template_with_config.git # runs setup.py
  • # $ pip uninstall python_template_with_config # use this if you need to uninstall whilst developing

I can check that this has installed as a module using:

In [1]: from python_template_with_config import another_module
In [2]: another_module.a_math_function() 
# silly function just to check that numpy is installed
Out[2]: -2.4492935982947064e-16

Now I’ll make a second conda environment to develop the recipe:

  1. $ ~/anaconda3/bin/conda create -n new_recipe_env2 python=3.5 # vanilla environment, no numpy
  2. $ . ~/anaconda3/bin/activate new_recipe_env2
  3. git clone https://github.com/ianozsvald/python_template_with_config_recipe.git
  4. cd inside, run "conda build --debug ."

The recipe (meta.yaml) will look at the git repo for python_template_with_config, pull down a copy, build using build.sh and the store a bzip2 archive locally. The build step also notes that I can upload this to Anaconda using `$ anaconda upload /home/ian/anaconda3/conda-bld/linux-64/python_template_with_config-0.1-py35_0.tar.bz2`.

A few caveats occurred whilst creating the recipe:

  • You need a bld.bat, build.sh, meta.yaml, at first I created bld.sh and meta.yml (both typos) and there were no complaints…just frustration on my part – the first clue was seeing “source tree  in: /home/ian/anaconda3/conda-bld/work \n number of files: 0” in the build output
  • When running conda build it seems to not overwrite the version in ~/anaconda3/pkgs/ – I ended up deleting “python_template_with_config-0.1-py35_0/” and “python_template_with_config-0.1-py35_0.tar.bz2” by hand just to make sure on each build iteration – I must be missing something here, please enlighten me (see note from Marco below)
  • Having deleted the cached versions and fixed the typos I’d later see “number of files: 14”
  • Later I added “run_tests.py” rather than “run_test.py”, I knew it wasn’t running as I’d added a “1/0” line inside run_tests.py that obviously wasn’t running (it should raise a ZeroDivisionError even if the tests did run ok). Again this was a typo on my part
  • The above is tested on Linux, it ought to work on Windows but I’ve not tested it
  • This meta.yaml installs from github, there’s a commented out line in there showing how to access the local source files instead

Marco Bonzanini has noted that “conda clean“, “conda clean -t” (tarballs) and “conda clean -p” (packages) can help with the caching issue mentioned above. He also notes “conda skeleton <pypi package url>” takes care of the boilerplate if you have a published version on PyPI, so that avoids the silly mistakes I made by hand. Cheers!

I didn’t get as far as uploading this to Anaconda to make it ‘public’ (as I don’t think that’s so useful) but I believe that final step is easy enough.

Useful docs:


Ian applies Data Science as an AI/Data Scientist for companies in ModelInsight, sign-up for Data Science tutorials in London. Historically Ian ran Mor Consulting. He also founded the image and text annotation API Annotate.io, co-authored SocialTies, programs Python, authored The Screencasting Handbook, lives in London and is a consumer of fine coffees.

13 Comments | Tags: Data science, Python

20 June 2016 - 8:56Results for “Which version of Python (2.x vs 3.x) do London Data Scientists use?”

Over the last week I’ve surveyed my PyDataLondon meetup community (3,400+ members) to ask “Which version of Python do you use at work and at home?”. The goal is to gain evidence about which versions of Python are used by Data Scientists. This will help tool developers so they can make evidence-based decisions (e.g. this Dask discussion and another for h5py) about which versions of Python need support now and in the future.

Below I also discuss some business risks of sticking with Python 2.7. Of 3,400+ members over 466 (13%) responded to the 4 emails I sent. By 2020 (3.5 years from now) Python 2.7’s support will end.

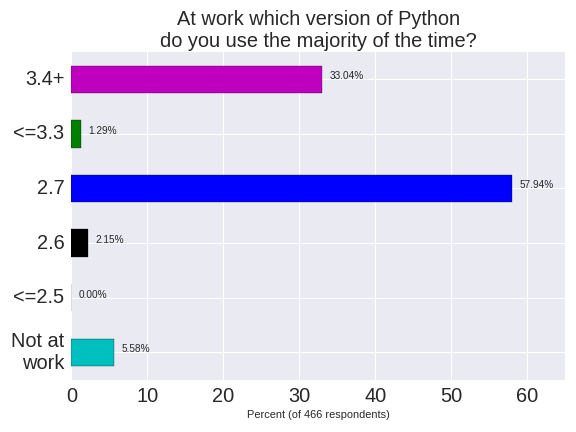
TL;DR Python 2.7 is still dominant for UK Data Scientists at work, Python 3.4 dominates outside of work, I hypothesise that 50% of London Data Scientists will be using Python 3.x by June 2017, business risks exist for companies who lack a 2.7->3.x migration plan.

Survey results:

At work Python 2.7 dominates (58%) for PyDataLondon members. Python 3.4+ is used by 33% of our respondents (including me).

Version of Python at work

Outside of work Python 3.4+ dominates 2.7 by a small margin (the majority of home users choose Python 3.5 (37%) over 3.4 (12%)). For work and home usage Python versions <=3.3 and 2.6 are used by approximately 2% of respondents each, nobody uses <= 2.5. Separately I know at least 2 members at our meetups who have noted that they use Python 2.4 (so that’s at least 2 in 3,400 members).

Version of Python at home


The more interesting outcome is “If you use Python 2.7 – do you expect to be using Python 3.x within a year?”. 25% of respondents are using Python 2.7 and do expect to upgrade. 36% are already on Python 3.x. 38% expect to still be using Python 2.7 in a year. Of the aspirational 25% who believe they’ll upgrade, I suspect that at least half of these will have upgraded within a year.

Hypothesis – if I survey again in June 2017 we’ll see Python 3.x usage at 50% of the PyDataLondon community.

Will I upgrade to Python 3.x

When asked about a choice of distribution it is clear that Continuum’s Anaconda is the clear choice. A significant number of users still use their Operating System’s default Python.

Which distribution at work

Edit – I did have a question about choice of Operating System but I’d left it as a multiple-choice not single choice question. Since the results were hard to interpret I’ve removed that result.

The above results mirror the finding in Randal Olson’s recent 2014 and 2013 surveys. There are a couple of related (early 2015 for scientific Python users) surveys (2013).

There’s a final question on “Anything else you’d like to add?”. Some users note that they are fixed to 2.7 for the time being due to a large legacy code-base. This sort of theme “Current python use at work is around 60% 2.7 and 40% 3.4 .. this ratio is continuously moving towards 3.4 as most new things are in 3.4+.” and “Just made jump to Py3, still have a body of legacy running under 2” occurred through-out the comments. Nobody commented that they’d moved backwards and nobody ruled-out upgrading (though some said that they were in no hurry).

Business risk: A few newer tools are only written for Python 3.4+ and are unlikely to be back-ported. Some established projects (e.g. IPython/Jupyter) are moving their next development versions to Python 3.4+ and keeping Python 2.7 for the current branch as a move towards discontinuing Python 2.7 support. There’s an increasing risk that Python 2.7-based Data Scientists will see newer tools occur around them for Python 3.4+ which won’t fit into their development chain. I’ve made notes on this before. For businesses using 2.7 you should at least have a plan for strong unit-test coverage and new code should be written as 3.4-compatible, to ease your journey into 3.x+.

Advice to developers of new packages in 2016: If you’re not worried about losing some of your potential users, you might focus just on Python 3.4+, you’ll lose around 60% of your potential userbase and this will move in your favour fairly quickly over the next 2 years. You might want to invest time in cross-compatibility using tools like __future__ and six if supporting Python 2.7 isn’t too complicated – the burden is heavier if you’re doing text processing and web-based data processing (as the bytes/str/unicode distinctions induce more pain). You probably shouldn’t focus solely on Python 2.7 as the trend is against you.


If you run a community group then maybe you’d like to make a survey like this?

I used SurveyMonkey, it is free if you have <100 respondents, I had buy a monthly plan to access these results. Here are some notes:

Community surveyed: London Python-using Data Scientists who are members of PyDataLondon, these are mainly industrial users (40% PdD, 40% MSc, the majority self-identify as being Practicing Data Scientists), some are academics. In the UK we’ve had various Python communities grow over the years including PyConUK (2007+), London Financial Python Usergroup (2009-2014), London Python Usergroup (2010+). Our PyDataLondon is 3 years old, it is also the largest active Python usergroup in Europe. The above results probably reflect (within a margin of error) the general state of Python-using Data Scientists in the UK.

Bias: Accepting the demographics of the audience noted above (i.e. self-selected professional and active individuals focused around London), I did observe an interesting bias in the distribution of results over time. I issued the survey 4 times over 1 week. At first I received clear evidence (approx 40 responses) that Python 3.4+ was used significantly at work. I wrote a second email to our meetup group strongly requesting more submissions and quickly this climbed to 200+. In this second tranche the dominance of Python 3.4 dropped and 2.7 edged forwards. After a 3rd and 4th email it was clear that Python 2.7 is dominant. Possibly the early responders are more vocal in their Python 3.4+ support?

Improving the questions: If I were to run the survey again (and if you want to run one like it) – I’d suggest changing the “Which distribution question do you use at work?” to “Which distribution do you use the majority of the time?” (removing ‘work’). I’d probably also add a new question with a short “Which industry do you primarily work in?” list of radio-boxes (e.g. Finance, Biotech, Gaming, Retail, Hardware, …). I think the break-down of Python 2.7 users against Industry might be interesting.


Ian applies Data Science as an AI/Data Scientist for companies in ModelInsight, sign-up for Data Science tutorials in London. Historically Ian ran Mor Consulting. He also founded the image and text annotation API Annotate.io, co-authored SocialTies, programs Python, authored The Screencasting Handbook, lives in London and is a consumer of fine coffees.

37 Comments | Tags: Data science, Life, pydata, Python

10 May 2016 - 22:43PyDataLondon 2016 Conference Write-up

We’ve just run our 3rd PyDataLondon Conference (2016) – 3 days, 4 tracks, 330 people.This builds on PyDataLondon 2015. It was ace! If you’d like to be notified about PyDataLondon 2017 then join this announce list (it’ll be super low volume like it has been for the last 2 years).

Big thanks to the organizers, sponsors and speakers, such a great conference it was. Being super tired going home on the train, but it was totally worth it. – Brigitta

We held it at Bloomberg UK again – many thanks to our hosts! I’d also like to thank my colleagues, review committee and all our volunteers for their hard work, the weekend went incredibly smoothly and that’s because our team is so on-top-of-everything – thanks!

Our keynote speakers were:

Our videos are being uploaded to YouTube. Slides will be linked against each author’s entry. There are an awful lot of happy comments on Twitter too. Our speakers covered Python, Julia, R, MCMC, clustering, geodata, financial modeling, visualisation, deployment, pipelines and a whole lot more. I spoke on Statistically Solving Sneezes and Sniffles (a citizen science project using ML to try to diagnose the causes of Rhinitis). Our Beginner Bootcamp (led by Conrad) had over 50 attendees!

…Let me second that. My first PyData also. It was incredible. Well organised – kudos to everyone who helped make it happen; you guys are pros. I found Friday useful as well, are the meetups like that? I’d love to be more involved in this community. –  lewis

We had two signing sessions for five authors with a ton of free books to give away:

  • Kyran Dale – Data Visualisation with Python and Javascript (these were the first copies in the UK!)
  • Amit Nandi – Spark for Python Developers
  • Malcolm Sherrington – Mastering Julia
  • Rui Miguel Forte – Mastering Predictive Analytics with R
  • Ian Ozsvald (me!) – High Performance Python (now in Italian, Polish and Japanese)


Some achievements

  • We used slack for all members at the conference – attendees started side-channels to share tutorial files, discuss the meets and recommend lunch venues (!)
  • We added an Unconference track (7 blank slots that anyone could sign-up for on the day), this brought us a nice random mix of new topics and round-table discussions
  • A new bioinformatics slack channel is likely to be formed due to collaborations at the conference
  • We signed up a ton of new volunteers to help us next year (thanks!)
  • An impromptu jobs board appeared on a notice board and was rapidly filled (if useful – also see my jobs list)

Thank you to all the organisers and speakers! It’s been my first PyData and it’s been great! – raffo

We had 15-20% female attendance this year, a slight drop on last year’s numbers (we’ll keep working to do better).

On a personal note it was great to see colleagues who I’ve coached in the past – especially as some were speaking or were a part of our organising committee.

With thanks to our sponsors and via ticket sales we raised more money this year for the NumFOCUS non-profit that backs the scientific Python stack (they give grants and stipends for contributors). We’d love to have more sponsors next year (this is especially useful if you’re hiring!). Thanks to:

Let me know if you do a write-up so I can link it here please:

If you’d like to hear about next year’s event then join this announce list (it’ll be super low volume). You probably also want to join our PyDataLondon meetup.

There are other upcoming PyData conferences including Berlin, Paris and Cologne. Take a look and get involved!

As an aside – if your data science team needs coaching, do drop me a line (and take a look at my coaching testimonials on LinkedIn). If you want a job in data science, take a look at my London Python data science jobs list.


Ian applies Data Science as an AI/Data Scientist for companies in ModelInsight, sign-up for Data Science tutorials in London. Historically Ian ran Mor Consulting. He also founded the image and text annotation API Annotate.io, co-authored SocialTies, programs Python, authored The Screencasting Handbook, lives in London and is a consumer of fine coffees.

31 Comments | Tags: Data science, Life, pydata, Python

7 May 2016 - 15:04Statistically Solving Sneezes and Sniffles – a Work in Progress Report at PyDataLondon 2016

This is a Work in Progress report, presented this morning at my PyDataLondon 2016 conference. A group of 4 of us are modelling a year’s worth of self-reported data from my wife around her allergies – we’re learning to model which environmental conditions cause her sneezes such that she might have more control over her antihistamine use. Join the email updates list for low-volume updates about this project.

I really should have warned my audience that I was about to photograph them (honest – they seemed to enjoy the talk!):

Emily created the Allergy Tracker (open src) iPhone app a year ago, she logs every sneeze, antihistamine, alcoholic drink, runny nose and more. She’s sneezed for 20 years and by heck, we wondered if we could apply some Data Science to the problem to see if her symptoms correlate with weather, food and pollution. I’m pleased to say we’ve made some progress – it looks like humidity is connected to her propensity to use an antihistamine.

This talk (co-presented with Giles Weaver) discusses the data, the app, our approach to analysis and our tools (including Jupyter, scikit-learn, R, Anaconda and Seaborn) to build a variety of machine learned models to try to model antihistamine usage against external factors. Here are the slides:

Now we’re moving forward to a couple of other participants (we’d like a few more to join us – if you’re on iOS and in London and can commit to 3 months consistent usage we’ll try to tell you what drives your sneezes). We also have academic introductions so we can validate our ideas (and/or kick them into the ground and try again!).

This is the second full day of the conference – we have 330 attendees and we’ve had 2 great keynote speakers and a host of wonderful talks and tutorials (yesterday). Tonight we have our conference party. I’m super happy with how things are progressing – many thanks to all of our speakers, volunteers, Bloomberg and our sponsors for making this work so well.

Update – featured in Mode Analytics #23.

Update – I did a follow-up talk at ODSC 2016 with notes on a new medication that we’ve tried.


Ian applies Data Science as an AI/Data Scientist for companies in ModelInsight, sign-up for Data Science tutorials in London. Historically Ian ran Mor Consulting. He also founded the image and text annotation API Annotate.io, co-authored SocialTies, programs Python, authored The Screencasting Handbook, lives in London and is a consumer of fine coffees.

17 Comments | Tags: Data science, pydata, Python