
Juvenile detention statistics
The AIC has maintained a data collection on the number of persons detained in juvenile detention centres since 1981, consisting of a count of persons detained in detention centres on the last day of each quarter of each year. Similar information is not available on the sentenced non-custodial juvenile population.
The long-term trend data shown in this section are based on the census of juvenile detention centres conducted on 30 June of each year.
Trend in juvenile detention centre population
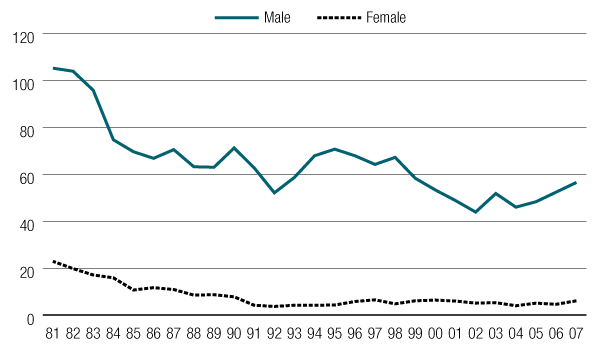
As there are differences between jurisdictions regarding the definition of a juvenile, statistics are shown for persons aged from 10 to 17. Figure 92 depicts the detention rate of male and female juveniles from 1981 to 2007, including those on remand and those sentenced.
Persons in juvenile detention centres, from 1981 to 2007, by sexa (per 100,000 of that sex per year)
a: Rates as at 30 June of each year
- From 1981 to 2007, the overall detention rate for juveniles fell by 51 percent, from 65 to 32 per 100,000.
- In 2007, the rate for male juveniles reached 57 per 100,000, a 24 percent rise since 2004 but a 46 percent fall from 105 in 1981.
- The rate for female juveniles has also fallen, from 23 to 6 per 100,000. The proportion of females in the total juvenile prison population was nine percent on 30 June 2007, down from 17 percent in 1981.
- The incarceration rate of male juveniles was nine times as high as the rate of females.
Indigenous status
Data on incarcerated juveniles by Indigenous status have been made available since 1994. This section shows the incarceration rate of Indigenous and non-Indigenous persons in juvenile corrective institutions, from 31 March 1994 to 30 June 2007, for each quarter.
Persons in juvenile detention centres, from 31 March 1994 to 30 June 2007a, by Indigenous status (per 100,000 of that status per year)

a: Rates from 30 September 1996 and 31 December 2002 have been calculated using detainee totals and population estimates and exclude Tasmania, because data on detainee Indigenous status in Tasmania are unavailable for this period
- The number of Indigenous persons in all juvenile detention centres (excluding Tasmania) on 30 June 2007 was 426. This represents 59 percent of the total number of persons detained in juvenile detention centres, a rise from 51 percent in the previous year.
- The detention rate per 100,000 of Indigenous juveniles was 397, more than 28 times as high as that of non-Indigenous juveniles (14).
- There has been a 15 percent decline in the rate per 100,000 of Indigenous juvenile detention since the high of 468 recorded in March 1997.
Recent publications
- Youth (in)justice: Oral language competence in early life and risk for engagement in antisocial behaviour in adolescence
12 April 2012 - Technical and background paper: Measuring juvenile recidivism in Australia
24 May 2011 - Trends in juvenile detention in Australia
12 May 2011 - What makes juvenile offenders different from adult offenders?
23 February 2011 - Juveniles in detention in Australia, 1981–2008
16 December 2010 - Police-referred restorative justice for juveniles in Australia
31 August 2010 - Police diversion of young offenders and Indigenous over-representation
23 March 2010 - Covert and cyber bullying
26 February 2010
Recent events
- Young people, risk and resilience: The challenges of alcohol, drugs and violence conference
07 March 2011 - Multi-problem risk profiles of youth in custody
15 February 2011 - Juvenile justice – a wicked problem. Reflections on a strategic review of the NSW Juvenile Justice System
19 August 2010 - Evaluating the Children’s Koori Court of Victoria
15 March 2010