Redistribution Archive

16

Map update – South Australia and Tasmanian upper house

I’ve recently completed two new maps for download and use: the (kind of) final boundaries for the 2018 South Australian state election, and draft boundaries for the Tasmanian upper house.

South Australia’s state redistribution was overshadowed by the federal election last year. A final set of boundaries was released late last year, with some significant changes to the draft boundaries in southern Adelaide, but these boundaries are stuck pending a lawsuit by the SA Labor Party. Both the first draft and final draft can be downloaded from the maps page, and the map is embedded here.

I’ve also completed the draft boundaries for the Tasmanian Legislative Council. The Tasmanian upper house consists of fifteen single-member electorates, but its members are elected in a very odd way: only 2-3 seats are elected each year, with members serving a six year term. Boundaries are redistributed roughly once a decade, with the sitting members assigned to finish their term representing a new seat.

There have been some major changes to the boundaries along the east coast of Tasmania. The three Launceston-area seats have remained largely the same, as have the four Hobart-area seats and the two rural seats to the west of Hobart. The west coast seat of Murchison has undergone minor changes.

The east coast seat of Apsley has been chopped up, while the seat of Rumney in the south-eastern corner of the state has been pulled in closer to Hobart, losing Sorell and the Tasman peninsula. A new seat of Prosser stretches halfway up the east coast from the Tasman peninsula to Swansea, while the remainder of Apsley has been moved into a new seat of McIntyre.

The seat of Western Tiers has been chopped up, with the north-western seats of Montgomery and Mersey expanding south and the south-western seat of Derwent expanding north. The remainder of Western Tiers has joined the remainder of Apsley as McIntyre, a strangely-shaped seat curving around Launceston, stretching from Cradle Mountain to Flinders Island.

I would expect the final boundaries for the Tasmanian upper house to be determined later this year, and the new boundaries will be used for the first time in 2018.

5

SA state redistribution – draft boundary analysis

screen-shot-2016-10-19-at-8-22-18-pmWhile we were all recovering from the federal election, South Australia was undergoing a redrawing of its state electoral map for the 2018 state election. The draft electoral map was released in mid-August, and I blogged about the underlying statistics driving the redistribution at the time.

It’s taken me some time to get back to this redistribution, what with the many territory elections, council elections and by-elections taking place following the federal election, but it’s now complete.

You can download the 2018 draft map here.

The last election produced a result of 23 Labor seats, 22 Liberal seats and two independents. One of those independents, Geoff Brock, sided with Labor to give them a governing majority, while the other independent, Bob Such, went on sick leave soon after the election and later died of cancer. During Such’s absence, former Liberal leader Martin Hamilton-Smith resigned from the party to join Labor’s cabinet. Labor subsequently won the Fisher by-election, giving them a majority in the House of Assembly.

The Electoral Districts Boundaries Commission is required by law to consider the party-political impact of the redistribution, with the aim of producing a result which will give a majority of seats to the party that wins a majority of the two-party-preferred vote. Despite this requirement, Labor won a majority in 2010 despite a Liberal vote majority after preferences, and achieved government again despite losing the vote in 2014.

In line with their mandate, the EDBC has redrawn the boundaries to boost the Liberal position. Assuming no change from the 2014 election vote which gave the Liberal Party 53% after preferences, the new electorates would give the Liberal Party 24 seats and Labor 22. The last seat, Frome, is drawn as notionally Liberal but is held by an independent. Theoretically this should mean that the Liberal Party should be able to win a majority with no change in their vote (assuming they can win back Hamilton-Smith’s seat), although this theory did not work at the last two elections.

45 electorates remain notionally held by the party that won them in 2014 (either at the general election or, in the case of Labor and the seat of Fisher, at the by-election). The other two seats are Elder, in southern Adelaide, and Mawson, which has moved from being a southern Adelaide seat into a regional electorate by stretching out to take in Kangaroo Island and the Fleurieu Peninsula. Both seats are held by Labor MPs but are now notional Liberal seats.

The following map shows the new electoral map. Click on each seat to see the post-redistribution margin, and who held the seat before the redistribution.

This map is only a draft – we should be expecting a final version of the map to be released in November.

1

What’s going on at the Tally Room

This blog has been pretty quiet since the conclusion of the NSW council elections. I’m working on a few different projects in the background and I just wanted to give a quick update.

Firstly, I’ve been working on a project to collect together all of the results of the NSW council elections to publish in an easy-to-use format for data analysis. This is part of a broader project to publish local and state election results in an easy-to-use format, since so many electoral commissions do not publish results (as well as candidate and booth lists) in accessible formats, unlike the AEC. Unfortunately I’ve hit a wall in scraping the data for the 2016 council elections, although the data for the 2011 and 2012 elections is ready. If you’re an expert on web scraping who can help me with this, drop me a line. Once this is done, I might do some high-level comparisons of the 2012 and 2016 election results.

The ACT election is due this Saturday, and I’ve got guides published for all five electorates which you can read here. I’ve got an article going up at the Guardian today about the election which is also worth a read. Unfortunately I won’t be around to do a liveblog on Saturday night, but I will return to do some overall analysis on the weekend.

Three by-elections are due in New South Wales in November and I’ve published guides for all three seats. This includes a guide to the Wollongong by-election, which was only recently written.

Beyond that, I’ve been making maps for a couple of recent redistributions. The Northern Territory is in the midst of a redistribution, whereby the urban seat of Solomon will lose some areas on the outskirts of Darwin and Palmerston to the seat of Lingiari. This is the first time since the territory was split into two electorates in 2001 that the boundaries will be changed. I’ve completed a map of the new boundaries which you can download from the maps page.

I am currently working on the new draft map for the South Australian state redistribution, and I’ll be publishing that probably next week, and once the draft boundaries are released for the Queensland state redistribution I will also make a map of those boundaries.

Then once all that’s done I plan to get into preparing the guide to the Western Australian state election, for early next year.

So I will pop up from time to time, but mostly I’ll be away in the background for the remainder of this year.

6

South Australian state redistribution update

This is a quick blog post about a story that I’ve missed up until now.

As they do every four years, the South Australian electoral boundaries are currently in the process of being redistributed. The draft boundaries are due to be released at 11am Adelaide time this morning. This follows a round of submissions earlier this year, which largely went under the radar due to the federal election.

South Australia conducts redistributions after every election. Unlike other jurisdictions around Australia, the boundaries commission is required to ensure that the result is “fair” – ie. that a majority of the two-party-preferred vote gives a majority of seats. I’m on the record as thinking that this is an impossible task. By definition a system of single-member electorates are not fair, it can’t handle multiparty politics, and is always undone by different swings across the state.

The 2010 election saw Labor hold on to its majority despite losing a majority of the two-party-preferred vote, despite the best efforts to draw boundaries which wouldn’t produce this result. After this election, the boundaries commission decided that the boundaries were not unfair and didn’t attempt to undertake major redrawing of the boundaries to undo Labor’s new advantage.

The following map shows how much each seat diverges from the average quota as of 2016. Seats marked in red are above average, those in blue below average. Those in pale yellow are within a range of 1% either above or below. Those in a darker colour are 5% above or below average.

Seats must fall within 10% of the average. Technically only two seats fall outside this band: Port Adelaide is over 10% above average, and the remote north-western seat of Giles is over 10% below average.

In practice a lot more seats will be redrawn. On a regional basis, seats in the northern suburbs of Adelaide are above average. There are four seats north of the Adelaide city centre which are more than 5% above quota. The nine seats at the northern end of Adelaide are collectively 17.6% above quota, while the fifteen seats in central Adelaide are 7.4% above quota, and the southern Adelaide seats are mostly sitting around the quota.

The five seats in northern South Australia are collectively 22.7% below their fifth quota. This suggests that we should expect one of these rural seats to be pulled further into the northern fringe of Adelaide, to absorb the surplus population in Adelaide. We’ll find out soon enough.

I should note that I’m not planning to immediately drop everything to construct a map of the new draft SA boundaries, as I am hoping to produce a guide to some of the biggest councils up for election in New South Wales in September. I’ll return to produce this map later in the year once other elections no longer monopolise my time.

20

QLD redistribution – the numbers

Screen Shot 2016-07-21 at 4.44.44 pmQueensland is about to dive into a redistribution of state electorates, to update the existing electoral map which was created in the lead up to the 2009 election.
Queensland currently has 89 electorates, but will be adding four additional seats for the next election, thanks to legislation passed earlier this year. For this reason, most existing electorates are above the required average for the new electoral map.

The electorates are required to be roughly in line with the average enrolment as of 2016, and the average projected enrolment as of 2022. The following table shows the quotas in each region of the state.

Seat Seats 2016 quotas 2022 quotas
Brisbane North 16 16.56 16.42
Brisbane South 20 20.12 19.53
Central QLD 11 11.32 11.09
Gold Coast 10 11.00 11.31
North QLD 11 11.42 11.38
SE QLD 10 10.84 11.60
Sunshine Coast 8 8.80 8.94
Western QLD 3 2.94 2.73

It appears that three of the four new seats will be added in the Sunshine Coast, Gold Coast, and in those parts of South-East Queensland outside of Brisbane (such as Ipswich, which is growing fast).

Below the fold I’ve posted a map and run through the likely impact on each region. Read the rest of this entry »

37

Queensland moves to compulsory preferences

In October 2015, I wrote about an attempt by the Liberal National Party and Katter’s Australian Party to pass legislation through the Queensland Parliament which would have increased malapportionment amongst Queensland electorates.

This legislation had a chance of passing despite Labor being in power due to Labor being a minority government. The LNP and KAP were hoping to win over ex-Labor independent Billy Gordon, whose seat of Cook was one of the large rural seats which would be allowed to have a smaller population under the changed rules.

The October legislation also included some changes to the redistribution committee and a proposal to add up to five more seats to the Parliament. Earlier this month, the LNP and KAP proposed another law which made the same changes to the committee, and increased the size of the Parliament from 89 seats to 93.

Labor still strongly opposed the proposed legislation – personally it seems a lot less objectionable than the original proposal. It’s hard for me to assess who would benefit more from adding four seats – it seems likely that the new seats will be distributed around between both major parties.

It became clear that Rob Pyne (another ex-Labor independent) would vote for the opposition legislation. When the legislation came up tonight, Labor wrong-footed the LNP by amending the legislation to change the voting system from optional preferential voting (OPV) to compulsory preferential voting. The legislation was passed with this dramatic change to the voting system included. KAP and the independents voted with the government, while the LNP were left voting against their own legislation.

While the winners and losers of OPV change over time (the Liberals and Nationals were hurt by OPV in the late 1990s), at the moment OPV hurts Labor, as many Greens votes exhaust rather than flowing to Labor. Antony Green estimates that Labor would have won nine more seats in 2015 if preferences were compulsory.

While the original legislation may have had some slight benefits for the LNP, the Labor amendment will have dramatic consequences, hurting the LNP in a bunch of marginal seats, at least until there is some major shift in partisan voting patterns.

The pros and cons of OPV and CPV, and how they effect how campaigns are run, is a story for another day.

I wanted to just sum up what the current enrolment figures suggest about the next redistribution.

Region # of seats Quota / 89 Quota / 93
Brisbane North 16 15.85 16.57
Brisbane South 20 19.23 20.09
Central QLD 11 10.81 11.30
Gold Coast 10 10.55 11.03
North QLD 11 10.91 11.40
South-East QLD 10 10.40 10.87
Sunshine Coast 8 8.45 8.83
Western QLD 3 2.78 2.91

The Gold Coast gains an entire new seat, with rural parts of south-east QLD and Sunshine Coast almost gaining enough population to each gain their own seats. In southern Brisbane, the increased seat number prevents the region from losing a seat, while northern Brisbane has a half-quota more than its current seats. Overall, the south-east QLD region should gain three of the four new seats – one definitely on the Gold Coast, and the other two likely on the outskirts of Brisbane and in the Sunshine Coast.

Seats on the north and central coast of Queensland are slightly over-quota, so expect to see the fourth new seat on the coast, with seats along the coast nudged along to absorb the extra population.

I’m finding it hard to see an overall trend towards the ALP or LNP in the redistribution changes. LNP seats are already half a quota over before the changes to the quota, with ALP seats collectively 0.4 quotas under. With the reduced quota adjusted for 93 seats, the 42 LNP seats are 2.46 quotas over, while the 44 ALP seats are 1.55 quotas over.

One final thing which remains unclear to me is how this affects the timing of the redistribution. The redistribution was due in this term of Parliament, and expected to commence shortly. Queensland’s Attorney-General, Yvette D’Ath, has claimed that passage of the legislation would delay the redistribution into the next term – I can’t find any confirmation of this claim, or an explanation of why a redistribution could not be completed in time for an election due in early 2018.

If you want to see more details, the following map shows seats in relation to the new quota (for 93 seats) passed tonight.

0

Queensland council election – ward map completed

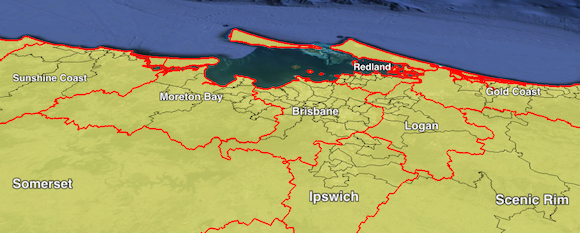
Screen Shot 2016-03-10 at 12.55.00 pmIt’s only nine days now until Queenslanders vote for their councils for the next four years (along with a referendum on fixed four-year terms for the state parliament), and I’ve finally finished my Google Earth map of the ward boundaries.

Sixteen councils have changed their divisional or ward boundaries since the 2012 election. Four of these are councils which have changed their external boundaries due to the reversal of a pre-2012 council amalgamation: Cairns, Tablelands, Sunshine Coast and Rockhampton. The restored councils which took in parts of those four, respectively Douglas, Mareeba, Noosa and Livingstone, will all elect their councillors at large without any wards.

The other twelve councils to change their wards are Banana, Brisbane, Bundaberg, Fraser Coast, Ipswich, Isaac, Logan, Moreton Bay, Redland, Scenic Rim, Townsville and Whitsunday.

You can download the map here.

I’m now focusing all of my attention on preparing my guide to the 2016 federal election, with seat guides due to start appearing in April. I’ll likely return with a small amount of analysis of the results of the QLD election and referendum after March 19, but apart from that I’ll be keeping my head down working on the federal election.

14

Federal electorate map of NSW finalised

The AEC has released the final maps for the NSW federal redistribution today, after the decisions were first announced in January.

I had made a Google Earth map of my best estimates of the electoral boundaries in January, and these are largely accurate.

The only spots where I was incorrect were:

  • Hume/Eden-Monaro border
  • Grayndler/Reid
  • Hume/Werriwa
  • Fowler/McMahon

You can download the final map here.

3

NSW and WA redistributions – updated maps

We are now nearing the end of the federal redistribution process which precedes the next federal election.

We had redistributions in New South Wales, Western Australia and the Australian Capital Territory.

The AEC has a curious process where they announce the final boundaries but do not provide the maps and data which allow people to see the precise boundaries. This extra information is usually provided about a month later.

In the ACT, the final boundaries were identical to the draft boundaries, so no further maps are necessary (although the final data is expected next week). In Western Australia, the final maps were released yesterday, and I’ll post them further down in this post.

In New South Wales, the final boundaries were announced last Friday, without any maps. In most places it’s reasonably clear what boundaries they were using (although a few were confusing). I’ve done my best to put together a new map – I think it’s likely to be accurate but there may be a few errors (in particular the Hume/Whitlam boundary and the Parkes/New England boundary) and I will update it when the official data is released in late February.

Download the NSW final-ish electoral map.

Download the WA final electoral map.

Download the ACT final electoral map.

Below the fold you can see interactive maps for NSW and WA, although I haven’t added any other data to the maps, just the boundaries.

Read the rest of this entry »

0

WA state redistribution – map finalised

It’s a couple of weeks late, but I’ve now completed my Google Earth boundary map of the new WA state electoral boundaries.

Download the map here.

You can also download the 2017 map for the Legislative Council.

If you want to understand more about the redistribution, you can see Antony Green’s estimates of the new seat margins at the ABC website.