New South Wales 2015 Archive

4

iVote – the other side of the story

Two weeks ago, I wrote a post explaining the problems that have cropped up around the NSW Electoral Commission’s iVote internet voting system, and the broader questions it raises about the future of electronic and internet voting.

After discussing the issue further with various experts, I thought it was worth putting some good arguments I have heard in favour of iVote as a way of enfranchising particular groups of voting.

iVote was originally proposed as a way to help blind and low vision (BLV) voters, and it’s easy to understand how iVote would help voters who otherwise require assistance to cast a vote.

However, iVote has evolved to be much more helpful in ensuring an increased turnout amongst those who could be described as ‘geographically disadvantaged’ – those outside NSW or in a remote location.

This doesn’t mean that iVote is perfect, or that there aren’t risks involved, but there’s some groups for whom iVote makes it substantially easier to exercise their democratic rights.

Read the rest of this entry »

7

NSW 2015 – voters shift away from election day and postal voting

The recent NSW state election saw a continuation of the long-term trend of less and less people casting ordinary election-day votes. In addition, in 2015 we saw the trend of increasing numbers of voters casting absentee votes or postal votes reversed, with those categories of voting becoming less popular, as pre-poll voting and iVote continue to increase in popularity.

For this analysis, I’ve been able to collect the figures on how many people voted using each different type of voting at every election since 1999.

In 1999, 84.6% of votes were cast as ordinary election-day votes. In 2015, this number dropped to 67.2%. In raw numbers, there has been a drop of 168,282 ordinary votes cast, despite the total number of votes cast increasing by 742,743.

As you can see, there was a slight decline in the proportion of ordinary votes from 84.6% in 1999 to 81.1% in 2007, although the raw numbers increased during this time. This trend has accelerated significantly since 2007, dropping to 74.2% in 2011 and 67.2% in 2015.

Below the fold, I’ll show how those people who aren’t casting ordinary votes are now voting, and how that has shifted over time. We’ve seen the acceleration of a trend that has seen large numbers of people cast absentee, postal and pre-poll votes, and how big surges in absentee and postal votes in 2011 have ebbed away while pre-poll voting continues to increase in size.

Read the rest of this entry »

0

Post-election website update

Now that the NSW election is coming to a close, I wanted to give an update on how the website is going, and my plans for the coming months.

Yesterday I posted my guide for the Tasmanian Legislative Council elections on May 2nd. After this, there are no state or territory elections until the next Tasmanian Legislative Council elections in 2016.

In 2016 we’ll see Australian Capital Territory and Northern Territory elections, followed by the federal election in late 2016.

We’ll also see council elections in Australia’s four largest states: Western Australia in October 2015, Queensland in March 2016, New South Wales in September 2016 and Victoria in October 2016.

During this time, you’ll see less from this website up front, but a lot will be going on behind the scenes. I’m going to be looking to publish a lot of election data in a clean format to be used by analysts.

I’ll also be covering the many redistributions due over the next year, including various council ward redistributions, state and federal redistributions in ACT and WA and a federal redistribution in NSW, and then I’ll be preparing guides to the various elections due in 2016.

In the lead-up to the NSW election, this website underwent a shift to a new and improved server, in order to better cope with spikes in traffic on major election nights, in particular the large spike which saw the website out of action for the Queensland state election.

The upgrade seems to have worked very well – let me know in comments if you noticed an improvement, or if you noticed any of the problems experienced at other recent elections.

The new server is costing me a bit more money, and while I have made enough during the recent busy period to cover the server’s costs for the next few months, the (much appreciated) regular donations I’m currently receiving are only covering about 2/3s of the monthly cost of the new server, so if you’d like to help cover the costs of the website’s functioning, please consider donating.

4

NSW 2015 – Legislative Council count finalised

Earlier today the NSW Electoral Commission “pushed the button” for the Legislative Council election, and approximately half an hour we had a result in the Legislative Council.

As expected, the Coalition won nine seats, Labor won seven, the Greens won two and the Christian Democratic Party and the Shooters and Fishers each won one seat. But the last seat was not clear before the button was pushed, and ultimately the Animal Justice Party’s Mark Pearson, ahead of No Land Tax’s Peter Jones and Liberal Hollie Hughes.

At the beginning of the count, on primary votes, No Land Tax led Animal Justice by 5235 votes, and Animal Justice led the Liberal candidate by 3212 votes (adding up all Coalition votes and subtracting nine quotas for the first nine elected).

The following graph shows what happened in the last ten counts. The graph does not include Labor, the CDP or the Shooters, who were polling higher but still below quota.

In both the graph and the table below, I show the primary vote for each group at the beginning of the count (excluding full quotas for Labor, Coalition and Greens), and then the final ten counts at the end of the distribution of preferences as the key candidates were excluded and distributed preferences.

Read the rest of this entry »

52

NSW 2015 – Greens vote concentrated

One of the stories on election night was the mixed news for the Greens. On the one hand, the party had a tremendous result in the lower house, retaining Balmain and notionally retaining the new seat of Newtown, and surprising most pundits (including myself) by winning Ballina and coming close in Lismore. On the other hand, the Greens vote appeared to have dropped slightly in both houses.

Since election day, the picture has cleared up. The Greens have fallen out of contention to win three seats in the Legislative Council (which they achieved in 2011), and missed out on winning in Lismore. On the latest figures in the Legislative Council, the Greens vote appears to have dropped by 1.2% to 9.9%, and we’ll get the final figures later this morning when the button is pushed.

In the Legislative Assembly (the focus of most of this post), the Greens primary vote overall stayed steady, dropping by a miniscule 0.0002% of the statewide vote (approximately seven votes!), staying roughly on 10.29%.

In addition to increasing their vote in Balmain, Newtown, Ballina and Lismore, the Greens also gained votes in the neighbouring inner-city seats of Summer Hill and Heffron, possibly strengthening their launching pad for future gains in the inner city of Sydney.

So how did the Greens manage to triple their Legislative Assembly representation, and increase their vote in their next best prospects? In this post, I’ll run through where the Greens gained positive swings and suffered negative swings, and where the Greens vote is becoming more concentrated. This post includes two interactive maps showing the shape of the Greens vote.

Read the rest of this entry »

0

iVote – how did it go so wrong?

At the recent NSW state election, the iVote internet voting system was used for the second time. The internet voting system is one of the first in the world, and was used by a much larger number of voters in 2011, but not without significant problems during the process, involving breaches in security, errors on the ballot resulting in votes being possibly invalidated, and a big increase in donkey votes due to difficulty in reading the entire ballot.

iVote was first introduced for the 2011 election. Originally, iVote was entirely focused on voters who are blind or have low vision. When the legislation was brought to Parliament in December 2010, the scope of iVote was extended significantly, with the right to use iVote extended to voters who live more than 20km from a polling place, will be overseas or interstate on election day, or have other disabilities

At that election, 46,864 votes were cast using iVote, which made up 1.09% of all votes (formal and informal) cast at the election. Overall, iVote was equivalent to one whole electorate. Despite the original intention, most of those who used iVote were voters who were outside NSW on election day.


In the lead-up to the 2015 election, other options were closed down for voters eligible to use iVote.

In the past, overseas voters have been able to vote at a number of Australian embassies, high commissions and consulates in cities with a large Australian expat and tourist population – the most prominent example being Australia House in London. In 2015, these overseas booths were shut down. While overseas voters still had the option of using a postal vote, casting a postal vote from overseas requires substantial lead time, so for voters voting at the last minute or wanting to vote conveniently, iVote became the only option.

These factors saw iVote shoot up in popularity in 2015. On the final Legislative Assembly figures, 283,669 votes were cast through iVote, which made up 6.22% of all votes cast. This is more than the number of postal votes (4.46%) and almost as big as the number of absent votes (6.33%).

In western democracies, voting over the internet is still very rare, and iVote remains the only case of voting over the internet being available in an Australian election.

The Australian Capital Territory has used electronic voting since 2001, but only within particular large polling places. This means that, unlike with iVote, the votes are cast on Electoral Commission machines in a controlled setting, not on your personal computer, and the votes are not transferred across the internet. Similar processes apply with electronic voting in New Zealand.

There have been a number of problems with iVote this year, some bad enough that they could possibly force NSW voters back to the polls.

Crikey‘s “tips and rumours” section ran with a story in March about people who had trouble with the iVote system calling the NSWEC hotline, with the person answering the phone suggesting they be removed from the electoral roll as a solution to the problem (which also overlaps with the ongoing problems that electoral commissions have in effectively selecting and training the armies of temporary staff employed at each election).

During the campaign, a security flaw in iVote was discovered by researchers outside the NSWEC, and the patch was closed. It’s not known whether this theoretical flaw resulted any votes being cast insecurely, or actually being tampered with.

The most obvious problem with iVote came 36 hours after voting started, when it emerged that the online ballot paper did not include above-the-line boxes for two groups: the Outdoor Recreation Party and the Animal Justice Party. This problem could potentially imperil the entire election, with Animal Justice in with a chance to win. If the party falls just short, it’s possible they could argue that they would have gained sufficient votes from the iVotes cast in those first 36 hours when they weren’t properly listed on the ballot, and this could invalidate the entire election.

There are also problems with how the iVote system looks on a computer when you are voting. You can see how it looks by trying out the iVote practice website.

When I use the website on my 13-inch screen, I can only see the first five columns on my screen without scrolling – a small proportion of the ballot. Considering that the Legislative Council paper ballot is much bigger than a regular laptop screen (let alone a smartphone screen), it’s not surprising that iVote is unable to show the whole ballot at the one time.

Antony Green demonstrated that the first four groups on the ballot, all minor parties or independents, had a massive increase in their vote on iVote compared to other vote types. For all four groups, their percentage of the iVote is at least twice as high as their percentage of the total vote, with the independent Group D polling 2.8 times as many votes proportionally on the iVote compared to the total statewide vote.

The major parties naturally experience variations in vote between different vote types (iVotes tend to be cast by younger people who move around more, which favours the Greens and is not favourable to the Coalition), so it’s not possible to say whether the ballot layout helped the Coalition, in Group E, but there is also a substantial uptick in the vote for the minor parties in Groups F and G.

Of course, there is an advantage for being on the left-hand side of a large paper ballot, but the effect is nowhere near as big as we are seeing for groups near the left in the iVote figures. It is conceivable you could reduce the effect by randomising the order of groups on the ballot, but it’s still concerning that iVote only shows you such a small part of the ballot.

Despite these problems, iVote has been popular with those who have used it, and if it continues to exist it’s likely that more people will wish to use it, and any potential or actual problems with the system will become more and more significant.

The concept of electronic voting in general, and even internet voting, is popular amongst the general public, while technology and electoral experts are sceptical, for cost, security and transparency reasons. This Youtube video explains much of the technological objections to internet voting.

Internet voting hasn’t been used anywhere else in Australia (although it will be trialled for New Zealand local elections in 2016), but electronic voting has been used at limited polling places, in particular in the ACT and Victoria, as well as for defence personnel and voters who are blind or have low vision at Commonwealth elections since 2007. This has not involved votes being transmitted across the internet, and has involved the use of consistent hardware owned by the electoral administration authority.

In addition to concerns about the system being secure, and the voting experience being consistent for different voters, there are also concerns about transparency in electronic systems used for the casting and counting of votes.

The iVote software is not open source, which makes it hard for outside security experts to the review the system and ensure there are no problems with it. There have also been complaints on the same basis with regard to the “EasyVote” software used by the Australian Electoral Commission to calculate the distribution of preferences (after data-entering votes cast on paper). The AEC has refused requests to release the source code, which would allow others to verify the accuracy of the counting system.

Similar counting systems are used for most multi-member elections around Australia, including the NSW Legislative Council, and NSW in 2015 is the first state to introduce the use of counting software and data entry for single-member electorates in the Legislative Assembly. There should be a shout-out to Elections ACT for using open source software for both their electronic voting system and their electronic counting system.

Overall, it seems inevitable that electronic software will become more and more common for counting ballots, electronic voting is likely to spread for major central polling places (although cost measures make it impractical for every booth), and demands for internet voting for convenience reasons are likely to persist. Despite this trend, it’s important that moves to introduce technology where we have perfectly good manual electoral processes should be looked on with caution.

6

NSW 2015 – another Legislative Council update

We’re now getting quite close to the end of the Legislative Council count, and the button is expected to be pushed at some point later this week.

The ‘initial count’ of above-the-line votes is almost complete – there are a small number of seats where absent and other special votes are still being counted, but most seats have concluded and it seems the figures are now close to final – only a few more votes have been counted since my last update on Friday.

The ‘check count’ – where below-the-line votes are counted, and all preferences are entered into the NSWEC’s computer – is approximately 85% complete.

Using the projection model which I explained in Friday’s post, this is my current projection, based on the final figures on Monday evening:

Candidate Party Votes Quotas Projected votes Projected quotas
Courtney Houssos Labor 139,358 0.8295 167,287 0.8584
Robert Borsak Shooters 142,484 0.8481 164,397 0.8435
Fred Nile Christian Dem 107,636 0.6407 121,487 0.6234
Peter Jones No Land Tax 69,730 0.4151 79,401 0.4074
Hollie Hughes Liberal 74,230 0.4419 75,748 0.3887
Mark Pearson Animal Justice 63,951 0.3807 75,161 0.3857
Shayne Higson Voluntary Euthanasia 34,594 0.2059 39,653 0.2035
Justin Field Greens 24,436 0.1455 34,985 0.1795

As projected last week, the Labor and Shooters vote has increased to a safe position, and the Coalition has vote has declined significantly, from 8.6 quotas to 8.44 quotas.

Comparing the approximately 85% of above-the-line votes counted in the check count to the 100% counted in the initial count, the count at the moment is still biased towards the Coalition by about 0.21%, and away from Labor by 0.15% and the Greens by 0.14%. It also appears to be biased slightly towards No Land Tax and away from Animal Justice, but the numbers get pretty small.

Because of this, the model is projecting a drop in the Liberal vote, a slight drop in the No Land Tax vote and a slight increase in the Animal Justice vote. The figures are very similar to the first projection, with No Land Tax leading by just under 4,000 votes (compared to 5,000 in the previous projection), and the Liberal and Animal Justice close behind. In the last projection, the AJP was ahead of the Liberal by 114 votes, now Liberal candidate Hughes leads the AJP by 587 votes.

At this point, you would have to say that No Land Tax remains slight favourites, considering the very light preference flows in the past, although it should be noted that the Greens’ Jeremy Buckingham and the Nationals’ Sarah Johnston gained over 20,000 and 15,000 votes respectively in preferences from other parties in their race to catch up with Pauline Hanson in 2011.

Considering that context, it is still entirely possible that Liberal candidate Hollie Hughes or Animal Justice candidate Mark Pearson could overtake No Land Tax candidate Peter Jones with preferences from other parties.

15

Do our state Electoral Commissions have enough to do the job?

Last week, while we were all distracted by the NSW election, the Tasmanian Electoral Commission (TEC) made a submission to a parliamentary inquiry warning that cuts to its funding may affect its ability to administer Tasmanian elections.

The TEC has been hit by funding cuts from the Tasmanian state government, down $35,000 in the last year. The organisation also relies on fees from local councils to fund its operations, and these fees have been reduced due to council terms being extended from three years to four.

Australian elections have genuinely been conducted to a very high standard, and a big part of this standard has been the administration of elections by independent, competent electoral commissions at a state and federal level. Yet government cost-cutting threatens this high-quality standard. Electoral commissions need to not only be independent, but have the resources to not just do the bare minimum when running an election, but to ensure that redundancies are built in to the system to catch problems, that staff are well-trained, that mistakes are not made, and that the entire process can be conducted in a way which is above reproach.

When you cut budgets, you threaten this capacity. Sure, electoral commissions will continue to do the basics – set up polling booths, take votes and count them – but the things that will take a hit will be the things you don’t always see, and they could well be the things that cause problems when everything doesn’t go to plan, which happens quite regularly in such a big operation as running a large election.

We’ve seen the problems with the NSW iVote system in recent weeks: errors on the ballot paper, security problems, and problems with small parts of the ballot paper being visible on the screen. I’ll return to iVote tomorrow, but it is part of the story of cost-cutting. iVote was in part very popular amongst overseas voters thanks to the closure of numerous overseas polling places in major cities.

While the standard of elections in Australia is still very good in most cases, there’s a bunch of small ways in which our state Electoral Commissions fall short of the Australian Electoral Commission that I certainly notice when attempting to use electoral data for this website.

Of course, it should be noted that in my experience most of the professional full-time staff at state Electoral Commissions are very professional, take their jobs very seriously and generally do good work, and from time to time you see some good innovations by state electoral commissions. The implementation of limited electronic voting in the ACT seems to have been handled well, and the ACT has also been successful in using optical character recognition (OCR) scanning of handwritten ballots to eliminate counting errors and speed up the counting process for large ballots of the type that take so long to count for the Senate and various Legislative Councils. Further down I’ll also discuss one new exciting innovation from the NSW Electoral Commission at this election.

If you’re someone looking to access electoral data at a federal level, it’s very easy. In addition to results data in a format easy for casual viewers to read, the AEC provides a ‘results downloads’ page (here is the page for the House of Representatives in 2013).

This data includes basically anything you might want to analyse the results. Full lists of candidates, full lists of polling places, including latitude and longitude for mapping purposes, enrolment statistics, and election results broken down in a bunch of ways – primary votes, two-candidate-preferred, two-party-preferred (there’s a difference), by booth, by vote type, by division, by state.

If only the same was available for each state election.

In most cases, it’s possible to get most of the same information, but there are usually gaps in the data. The most common problem is that data is only publicly available in an HTML format designed for casual readers – this includes keeping booth results on a separate page for each seat, so if you want the whole state’s data you need to use some kind of web-scraping tool or spend all day with copy and paste, and even then it’s a big hassle to combine data from different seats.

Quite often, data that is posted at the time of the election is taken down afterwards, making it hard to reconstruct results. In at least two jurisdictions (Victoria and South Australia) I had to email the electoral commission to get the full list of booths, and these didn’t include latitudes and longitudes, and in the Victorian case the data was organised in a way that required a lot of reorganisation before it was ready to be analysed. Other states do it better – the ECQ has their data on their website, and the NSW Electoral Commission always publishes a CSV file of all booths, including their estimates of how many voters are expected at each booth (here is the 2015 page, although who knows where this data will reside when the temporary 2015 election minisite is reorganised).

Even if booth lists are available, there’s often a problem matching lists of booths to the actual results. If you want to make a map, you need to match each individual booth on a list of booth addresses (and possibly geolocations) to the results of the election in each of those booths. Usually this is done by matching up a “unique name” – if there is more than one booth in a suburb, you add qualifying words, such as “Blacktown North” and “Blacktown South”, or sometimes the booths are named after the booth premises “Sackville Street Public School”, or the road the booth is on. The key is each booth has a unique name.

In the case of previous Tasmanian Electoral Commission booth lists, for both Legislative Council and House of Assembly elections, it has been difficult to find a booth list that actually matches the list of addresses to the results. Thankfully this seems to not always be the case – I have just downloaded the 2009 Legislative Council booth lists to prepare for May’s elections, and this list provides everything I need.

There are also big problems when it comes to actual vote figures.

Again, most state jurisdictions provide this data as a single HTML table on a separate page for each seat, which is accessible but time-consuming if you’re interested in numerous seats.

In Tasmania, this data is even less accessible. For statewide House of Assembly elections, the data is posted as large PDF files, which requires a substantial effort to clean up before you can begin analysing. For the Legislative Council it’s even worse: results are posted as PNG image files (such as this one). In order to use this data in a spreadsheet, to calculate percentages or add up votes for multiple booths, it’s necessary to painstakingly data-enter these results into a new spreadsheet, which is time-consuming and completey unnecessary.

In other states, there are various issues, many of which revolve around the provision of the appropriate two-candidate-preferred counts for each booth.

For federal elections, the Australian Electoral Commission provides accurate two-candidate-preferred (2CP) counts for every booth in every seat. Where the two-party-preferred count is different (where either of the top two candidates is not Labor or Coalition), they also provide the 2PP count by booth as well. Where the AEC wrongly guesses the top two candidates before election day, a fresh 2CP count is completed as soon as possible.

In various states, these counts aren’t as comprehensive. In Queensland, all two-candidate-preferred counts by booth are pulled down only a few days after the election and are not subsequently available. Even if you save this data before it’s taken down, in most seats the data does not exist for special votes, such as absentee, postal and pre-poll.

All electoral commissions need to guess which two candidates they think will come in the top two before election day, so that vote counters can proceed straight to the preference count after counting primary votes, but sometimes this guess is wrong. It’s not uncommon that booth counts are simply never conducted if the guess is wrong, and we are left guessing about the two-candidate-preferred count until the final distribution of preferences. In the seat of Prahran in Victoria in 2014, we only have a two-party-preferred booth count between the losing Labor and Liberal candidates, but no candidate including the successful Greens candidate.

The NSW Electoral Commission has had similar problems in the past – in a bunch of seats in NSW in 2011 there exists no count between Greens and Coalition by booth, which would reflect the top two parties. In many of these seats, such as Ballina, Lismore and Vaucluse, the Greens maintained their top-two finish but still the count was conducted between Labor and Liberal/Nationals.

In seats like Vaucluse there’s no particular urgency in producing the corrected figures, but in seats like Ballina and Lismore it was substantially harder to predict the result because the NSWEC chose not to conduct a fresh 2CP count between the correct candidates.

The NSWEC is solving this problem in the long-term thanks to their new process whereby all ballots are data-entered into the computer. This will allow the NSWEC to eventually release two-candidate-preferred counts for all conceivable combinations in each seat, which will give even more information than is provided currently by the AEC, and we’ve been promised that data in coming weeks. But it’s still a problem about how they rectify the problem where the NSWEC conducts the wrong 2CP count in a close race.

Of course, there are also problems with how the Australian Electoral Commission conducts elections. In addition to the unusual circumstances of lost ballot papers that triggered the Senate re-election in 2014, the 2013 Senate recount revealed the number of votes changing in a large number of booths across Western Australia. It’s an ongoing problem about how to improve the accuracy of vote-counting, and ensure that temporary election staff are well-trained.

Whatever you think is the cause of these problems, imposing tighter budgets on our electoral commissions won’t help them solve their problems.

I’m considering taking all of the candidate, booth and vote data I have collected over the years and putting them together into a central data repository in a format easy to use for data analysts. Let me know in comments if you would find this useful.
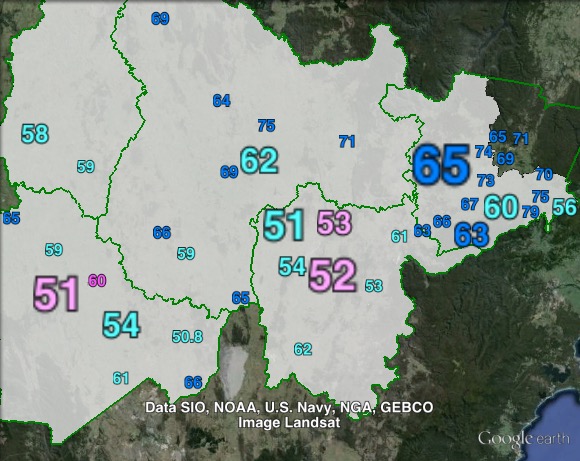
3

NSW 2015 – Legislative Council update

The count in the Legislative Assembly is now largely complete. As of late Thursday evening, the Electoral Commission had “pushed the button” and finished the count in 41 out of 93 seats, including the key seats of Lismore (Nationals beat Greens), East Hills (Liberal beat Labor), Gosford and the Entrance (Labor beat Liberal), giving us a final figure of 54 Coalition, 34 Labor, 3 Greens and two independents.

In the Legislative Council, there has been substantial progress in counting since I last posted eight days ago.

I’ve produced a projection based on comparing the above-the-line votes counted in the first count and second count, and using this to project how the remaining below-the-line votes will flow.

Candidate Party Votes Quotas Projected votes Projected quotas
Courtney Houssos Labor 47,383 0.5699 167,269 0.8583
Robert Borsak Shooters 56,956 0.6851 164,310 0.8431
Fred Nile Christian Dem 54,144 0.6513 121,423 0.6230
Peter Jones No Land Tax 39,828 0.4791 80,485 0.4130
Mark Pearson Animal Justice 33,147 0.3987 75,323 0.3865
Hollie Hughes Liberal 50,453 0.6069 75,209 0.3859
Shayne Higson Voluntary Euthanasia 16,086 0.1935 39,637 0.2034
Justin Field Greens 25,472 0.3064 35,517 0.1822

The first four of these candidates will get elected. On this projection, No Land Tax is leading on primary votes in a very tight race with Animal Justice and the Liberal candidate, leaving open the possibility of preferences being decisive, and/or a court case challenging the result.

Below the fold, I’ll explain the progress of the count and how I came to this projection.

The Electoral Commission is planning to ‘push the button’ sometime between Wednesday and Saturday next week. Read the rest of this entry »

4

Seat in focus – Goulburn

Goulburn, on paper, was a very safe Liberal seat prior to the recent election, with Liberal MP Pru Goward holding the seat by a 26.8% margin.

This masked a lot of change in the area. Goulburn shifted significantly west, taking in Yass and other areas from the abolished Nationals seat of Burrinjuck, and barely half of the seat’s population was included in Goulburn prior to the election.

Nationals MP (and minister) Katrina Hodgkinson held Burrinjuck, and initally planned to run against Goward in Goulburn, before shifting to the neighbouring seat of Cootamundra.

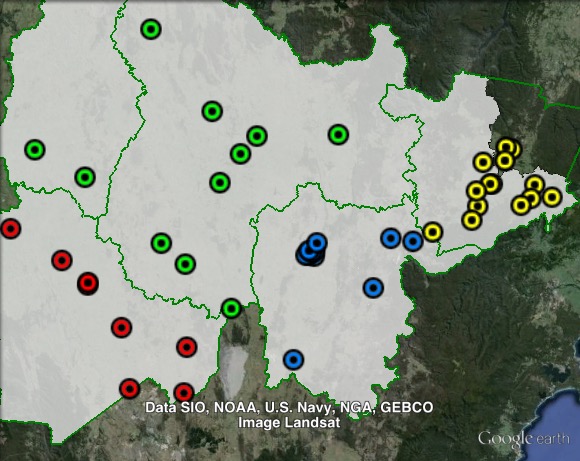
Polling places in Goulburn at the 2015 NSW state election. Goulburn in blue, North-West in green, Southern Highlands in yellow, Yass Valley in red. Click to enlarge.

Polling places in Goulburn at the 2015 NSW state election. Goulburn in blue, North-West in green, Southern Highlands in yellow, Yass Valley in red. Click to enlarge.

At this election, Goward suffered one of the largest swings against the government across the state. Currently the swing sits at 20.1% on a two-party-preferred basis, with most of the special votes not counted. Goward was still comfortably re-elected, but her huge 26.8% margin was cut to a much slimmer 6.7% margin.

There was huge variations in the swing across Goulburn, with Labor winning the vote in the main towns of Goulburn and Yass, while the swing was much less in the Southern Highlands.

In the pre-election guide, I split booths in Goulburn into four parts. Polling places in the Goulburn Mulwaree, Yass Valley and Wingecarribee council areas have been grouped as “Goulburn”, “Yass Valley” and “Southern Highlands” respectively. Polling places in the remaining parts of the seat were grouped as “North-West”.

The entirety of Goulburn and Southern Highlands were in Goulburn prior to the redistribution. All of Yass Valley, and most of the North-West, were contained in Burrinjuck prior to the redistribution.

Voter group LIB 2PP % ALP 2PP % ALP swing Total % of votes
Goulburn 50.7 49.3 22.9 10,269 21.1
Southern Highlands 65.0 35.0 9.6 8,958 18.4
Yass Valley 53.1 46.9 23.0 6,121 12.6
North-West 63.3 36.7 20.5 4,625 9.5
Other votes 54.5 45.5 23.1 18,610 38.3

The swing was large, and well above average, in three out of four areas, ranging from 20.5% in the north-west to 23% in Yass Valley. In the Southern Highlands, the swing to Labor was less than 10%.

Overall, the Liberal Party won a narrow majority in Goulburn, and a slightly larger majority in Yass Valley, to be contrasted with the larger majorities in the southern highlands and the north-west. While there was a large swing against Goward in the north-west, the Coalition majority was so large that she still managed 63% after a large swing.

When you look at the maps, you see an even more interesting trend. Over one-third of the seat’s population lives in the towns of Goulburn and Yass (as opposed to the larger area and population covered by the respective local council areas of Goulburn Mulwaree and Yass Valley).

Labor only won seven booths in the whole of the electorate of Goulburn, and all seven of these booths are in these two larger towns. In Goulburn, Labor won five out of seven booths, and overall won 50.8% of the two-party-preferred vote. In Yass, Labor won both local booths and won 53% of the two-party vote overall.

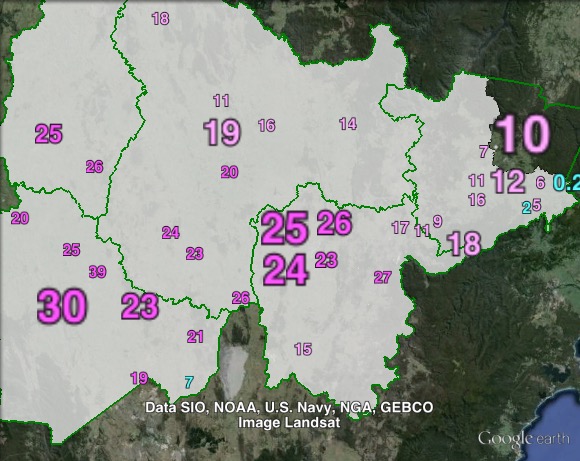
Two-party-preferred votes in Goulburn at the 2015 NSW state election.

Two-party-preferred votes in Goulburn at the 2015 NSW state election.

Two-party-preferred swings in Goulburn at the 2015 NSW state election.

Two-party-preferred swings in Goulburn at the 2015 NSW state election.

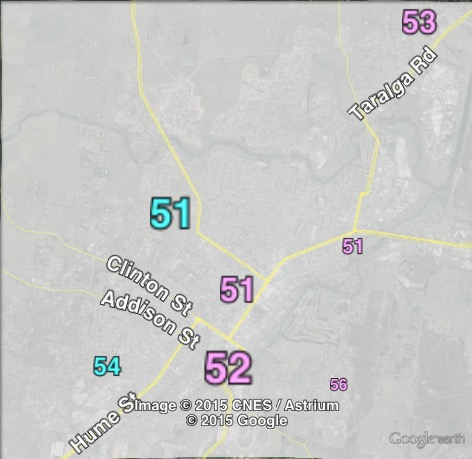
Two-party-preferred votes in the town of Goulburn at the 2015 NSW state election.

Two-party-preferred votes in the town of Goulburn at the 2015 NSW state election.

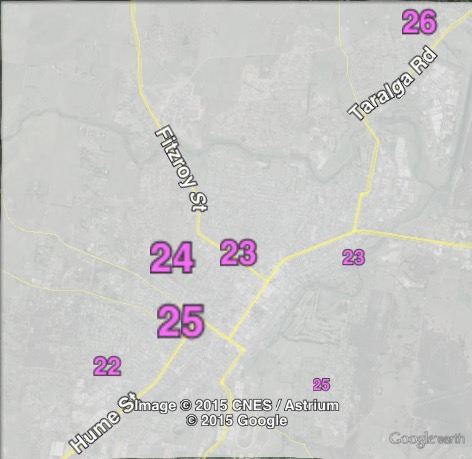
Two-party-preferred swings in the town of Goulburn at the 2015 NSW state election.

Two-party-preferred swings in the town of Goulburn at the 2015 NSW state election.