Maps Archive

11

Map update – South Australia and Tasmanian upper house

I’ve recently completed two new maps for download and use: the (kind of) final boundaries for the 2018 South Australian state election, and draft boundaries for the Tasmanian upper house.

South Australia’s state redistribution was overshadowed by the federal election last year. A final set of boundaries was released late last year, with some significant changes to the draft boundaries in southern Adelaide, but these boundaries are stuck pending a lawsuit by the SA Labor Party. Both the first draft and final draft can be downloaded from the maps page, and the map is embedded here.

I’ve also completed the draft boundaries for the Tasmanian Legislative Council. The Tasmanian upper house consists of fifteen single-member electorates, but its members are elected in a very odd way: only 2-3 seats are elected each year, with members serving a six year term. Boundaries are redistributed roughly once a decade, with the sitting members assigned to finish their term representing a new seat.

There have been some major changes to the boundaries along the east coast of Tasmania. The three Launceston-area seats have remained largely the same, as have the four Hobart-area seats and the two rural seats to the west of Hobart. The west coast seat of Murchison has undergone minor changes.

The east coast seat of Apsley has been chopped up, while the seat of Rumney in the south-eastern corner of the state has been pulled in closer to Hobart, losing Sorell and the Tasman peninsula. A new seat of Prosser stretches halfway up the east coast from the Tasman peninsula to Swansea, while the remainder of Apsley has been moved into a new seat of McIntyre.

The seat of Western Tiers has been chopped up, with the north-western seats of Montgomery and Mersey expanding south and the south-western seat of Derwent expanding north. The remainder of Western Tiers has joined the remainder of Apsley as McIntyre, a strangely-shaped seat curving around Launceston, stretching from Cradle Mountain to Flinders Island.

I would expect the final boundaries for the Tasmanian upper house to be determined later this year, and the new boundaries will be used for the first time in 2018.

5

SA state redistribution – draft boundary analysis

screen-shot-2016-10-19-at-8-22-18-pm
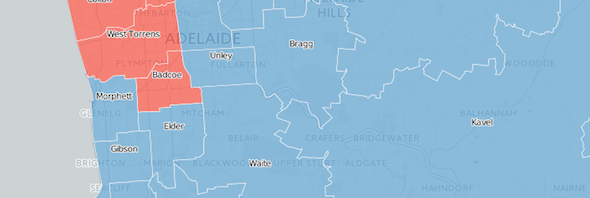
While we were all recovering from the federal election, South Australia was undergoing a redrawing of its state electoral map for the 2018 state election. The draft electoral map was released in mid-August, and I blogged about the underlying statistics driving the redistribution at the time.

It’s taken me some time to get back to this redistribution, what with the many territory elections, council elections and by-elections taking place following the federal election, but it’s now complete.

You can download the 2018 draft map here.

The last election produced a result of 23 Labor seats, 22 Liberal seats and two independents. One of those independents, Geoff Brock, sided with Labor to give them a governing majority, while the other independent, Bob Such, went on sick leave soon after the election and later died of cancer. During Such’s absence, former Liberal leader Martin Hamilton-Smith resigned from the party to join Labor’s cabinet. Labor subsequently won the Fisher by-election, giving them a majority in the House of Assembly.

The Electoral Districts Boundaries Commission is required by law to consider the party-political impact of the redistribution, with the aim of producing a result which will give a majority of seats to the party that wins a majority of the two-party-preferred vote. Despite this requirement, Labor won a majority in 2010 despite a Liberal vote majority after preferences, and achieved government again despite losing the vote in 2014.

In line with their mandate, the EDBC has redrawn the boundaries to boost the Liberal position. Assuming no change from the 2014 election vote which gave the Liberal Party 53% after preferences, the new electorates would give the Liberal Party 24 seats and Labor 22. The last seat, Frome, is drawn as notionally Liberal but is held by an independent. Theoretically this should mean that the Liberal Party should be able to win a majority with no change in their vote (assuming they can win back Hamilton-Smith’s seat), although this theory did not work at the last two elections.

45 electorates remain notionally held by the party that won them in 2014 (either at the general election or, in the case of Labor and the seat of Fisher, at the by-election). The other two seats are Elder, in southern Adelaide, and Mawson, which has moved from being a southern Adelaide seat into a regional electorate by stretching out to take in Kangaroo Island and the Fleurieu Peninsula. Both seats are held by Labor MPs but are now notional Liberal seats.

The following map shows the new electoral map. Click on each seat to see the post-redistribution margin, and who held the seat before the redistribution.

This map is only a draft – we should be expecting a final version of the map to be released in November.

1

What’s going on at the Tally Room

This blog has been pretty quiet since the conclusion of the NSW council elections. I’m working on a few different projects in the background and I just wanted to give a quick update.

Firstly, I’ve been working on a project to collect together all of the results of the NSW council elections to publish in an easy-to-use format for data analysis. This is part of a broader project to publish local and state election results in an easy-to-use format, since so many electoral commissions do not publish results (as well as candidate and booth lists) in accessible formats, unlike the AEC. Unfortunately I’ve hit a wall in scraping the data for the 2016 council elections, although the data for the 2011 and 2012 elections is ready. If you’re an expert on web scraping who can help me with this, drop me a line. Once this is done, I might do some high-level comparisons of the 2012 and 2016 election results.

The ACT election is due this Saturday, and I’ve got guides published for all five electorates which you can read here. I’ve got an article going up at the Guardian today about the election which is also worth a read. Unfortunately I won’t be around to do a liveblog on Saturday night, but I will return to do some overall analysis on the weekend.

Three by-elections are due in New South Wales in November and I’ve published guides for all three seats. This includes a guide to the Wollongong by-election, which was only recently written.

Beyond that, I’ve been making maps for a couple of recent redistributions. The Northern Territory is in the midst of a redistribution, whereby the urban seat of Solomon will lose some areas on the outskirts of Darwin and Palmerston to the seat of Lingiari. This is the first time since the territory was split into two electorates in 2001 that the boundaries will be changed. I’ve completed a map of the new boundaries which you can download from the maps page.

I am currently working on the new draft map for the South Australian state redistribution, and I’ll be publishing that probably next week, and once the draft boundaries are released for the Queensland state redistribution I will also make a map of those boundaries.

Then once all that’s done I plan to get into preparing the guide to the Western Australian state election, for early next year.

So I will pop up from time to time, but mostly I’ll be away in the background for the remainder of this year.

2

Map update – ward maps for NSW and Victoria

Screen Shot 2016-07-18 at 5.46.39 pm

As we get close to the conclusion of the federal election, I’ve started work on some upcoming elections.

There will be council elections in New South Wales in September this year, and in Victoria in October. These elections will cover the whole of Victoria, and roughly half of all NSW councils. Those NSW councils up for election in 2016 are those unaffected by the council amalgamations. Those which have been amalgamated (or who escape amalgamation) are due to have elections in September next year.

I’ve now completed my ward map of Victoria.

I’ve also completed a local government area map of NSW showing the amalgamated councils and, where no decision has yet been taken, the proposed new council.

I’ve also completed a ward map of NSW for all of those councils with confirmed wards. This map includes wards for all of those councils which have elections in 2016, as well as wards for all of those new councils which have been formally created.

For those new councils already formally created, the NSW state government announced new ward boundaries at the same time as the amalgamations were announced. There is a series of councils where the state government has indicated in-principle support for amalgamation pending court challenges, or where no decision has yet been taken, so no wards have yet been announced for these councils.

The Hills Shire is a special case. It won’t be amalgamated, but has lost its southern edge to Parramatta, which means it will require new wards. Those wards have not yet been decided.

I will keep updating the local government area and ward maps of New South Wales as council amalgamations are finalised in the lead-up to the 2017 elections.

I will return with more analysis of these 2016 council elections as we get closer to election day.

3

Introducing new interactive booth maps

As we head into the election I’ve been busily posting election guides – about 63 have now been posted, with the remainder due over the course of the next month. This has meant I haven’t done as much blogging although I have had a number of articles in the Guardian Australia summarising the election in Queensland and South Australia.

I wanted to draw readers’ attention to a new innovation in my guides. I’ve just started making booth maps in CartoDB instead of Google Earth, which should allow me to post them as interactive maps, allowing readers to scroll around, zoom in, look at the vote at individual booths and see what towns are in particular parts of the seat.

Here’s an example of a map I produced for the seat of Mayo. This map shows the Xenophon team’s Senate vote in Mayo booths at the 2013 federal election.

So far I’ve only done this for one seat: Mayo. It’s the only reasonably interesting seat which I hadn’t already done the map for. I’m planning to use this method for the last twenty maps I’m yet to make for this election, and then roll out the technique for future elections.

Unfortunately most of those seats on that list are pretty boring – they’re mostly safe Liberal seats in Victoria, WA and South Australia, along with a couple of almost-marginal Labor seats in Melbourne. I may update my maps to the new method for a few key marginals once the guide is finished, or if they’re useful for a Guardian story, but unfortunately this is a work in progress.

In the meantime if you have feedback on how to make these easier to use please let me know in the comments of this post – please leave the Mayo guide for talking about Mayo.

Tags: ,
6

Tale of three maps: Batman, Macquarie and Richmond

Macquarie2-GRNAs a further taste of the seat guides being posted now on the Tally Room (53 and counting), I thought I’d run through another three interesting seats. Today these three seats are all seats with above-average Greens votes, but also with a wide variation in the Greens vote across the seat.

These seats are: Batman in the inner north of Melbourne, Macquarie on the north-western fringe of Sydney, and Richmond in the north-eastern corner of New South Wales.

I’d like to remind readers that comments are open on all fifty-three seat guides posted so far – comments have been posted on every guide, with almost 800 comments posted so far this month. Please join in and let us know your thoughts about your local seat or another seat that you are familiar with.

Read the rest of this entry »

7

Three key marginals, and their interesting maps

Banks1-2PP

At the time of writing, I’ve finished the first 21 out of 150 seat profiles – covering marginal Coalition seats on margins of 4.4% or less.

This work continues behind the scenes but isn’t often seen by casual readers, so in this post I thought I would run through some of the most interesting maps I’ve produced while making these guides.

The three seats I wanted to cover are Banks, Brisbane and Lyons. Coincidentally, these are all seats the Liberal Party now holds, but were previously held by a longstanding Labor MP who managed to retain the seat from the early 1990s all the way through the Howard government, before losing in 2010 or 2013.

Comments are now open on every seat guide and quite a few have got lively conversations now running about the likely result in that seat. Read the rest of this entry »

0

Brisbane City Council – Lord Mayoral results

The Liberal National Party’s Graham Quirk won a second full term last night as Lord Mayor of Brisbane, the fourth successive win by the LNP after the two wins by Campbell Newman in 2004 and 2008.

He won comfortably with 58.9% of the votes counted so far after preferences, but even that was a swing of about 10% from the highs of 2012.

The following map provides the primary votes and two-party-preferred votes in the lord mayoral race by ward, including the swings from the 2012 results adjusted for the ward redistribution.

I’ll return later today with similar maps for the Brisbane City councillor elections and the statewide referendum.

14

Federal electorate map of NSW finalised

The AEC has released the final maps for the NSW federal redistribution today, after the decisions were first announced in January.

I had made a Google Earth map of my best estimates of the electoral boundaries in January, and these are largely accurate.

The only spots where I was incorrect were:

  • Hume/Eden-Monaro border
  • Grayndler/Reid
  • Hume/Werriwa
  • Fowler/McMahon

You can download the final map here.

0

Queensland council elections – map progress

Queensland goes to the polls to elect their local councils on March 19.

I’m currently working on my guide to the Brisbane City Council election – so far I’ve finished guides to ten wards out of 26.

The other piece of the puzzle is a complete ward map of Queensland, as I have done for every election since 2008.

Unfortunately I haven’t been able to get it done – moving house and taking some time off the blog over the summer slowed me down, and I’ve decided to prioritise finishing the Brisbane guide.

I’ve decided to post my partially-complete map. I’ve completed the boundaries for Banana, Isaac, Rockhampton, Whitsunday and Brisbane, but not Cairns, Tablelands, Townsville, Ipswich, Logan, Moreton Bay, Redland, Scenic Rim, Sunshine Coast, Bundaberg and Fraser Coast.

I plan to finish this map before election day – but maybe not long before the election.

Download the map here.