It was in early August this year when Phil Reid, a climatologist with the Bureau of Meteorology, first noticed something odd happening to the ice around Antarctica.
An area of ice had started to melt in the eastern Weddell Sea even though the region was still in darkness and air temperatures below freezing.
More NSW News Videos
The state of our climate in 2016
Australia is already experiencing an increase in extreme conditions from climate change – and it's projected to get worse.
Confirmed later as a rare sighting of the Weddell polynya – as such melts are known – abnormal sea ice activity began showing up in other regions off the southern continent.
Having set records for area covered by sea ice just over two years ago, the ice has rapidly retreated since late August to set new marks for record-low coverage for this time of year.

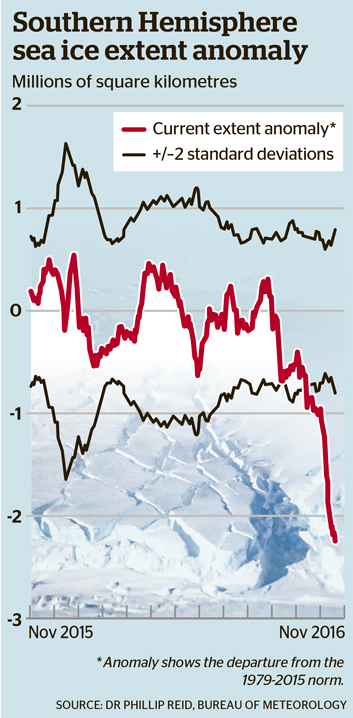
"It's been a pretty remarkable year," Dr Reid said, adding sea ice now totalled about 12.8 million square kilometres, or more than 2 million below average for November. (See chart, with the red line showing the departure from the 1979-2015 norm.)

Polynya appears
But in Antarctica, the relative lack of instruments and complexity added by the continent mean it could be a while before scientists get a clear view of why sea ice extent bounced from record highs to lows so rapidly.
The Weddell polynya indicates there were unusually warm waters beneath, but researchers won't know for sure until they can retrieve and analyse data from floats, Dr Reid said.
Some extreme weather, which also brought in warmer air from the north, may have helped corral the thinning ice into smaller areas. "That atmospheric pattern exacerbated the regions of lower-than-normal sea ice," he said.
Mark Brandon, a polar oceanographer and blogger at the UK's Open University, said the ice was noticeably compacting in three areas – the Ross Sea, the Cosmonauts Sea, and in the Bellingshausen and Weddell seas.
(See tweet map of ice for August 5, 2016 below. Blue shades imply an increased sea ice extent compared with a five-year mean for 1989-93, with reds implying a decreased sea ice extent.)
#Antarctic sea ice 2016: Historic lows. Blog post by @icey_mark https://t.co/TTXHcScWGo pic.twitter.com/cHlMYu9ltq
— Mark Brandon (@icey_mark) November 24, 2016
"We have no long-term wide geographical ranging measurements of sea ice thickness in the Antarctic that are comparable to what we have in the Arctic," he said. "For various technical reasons we don't have [satellite data] – yet – either.
"But with the evidence in the Weddell Sea I would be surprised if the volume is constant given the pack is not being compressed against the coast," he said.
Dr Brandon also posted this animation on Twitter showing the sea ice changes over time:
The #Antarctic 2016 sea ice anomalies. Blog post by @icey_mark https://t.co/PMwlnlDhCj pic.twitter.com/RF8Z15Ky5m
— Mark Brandon (@icey_mark) November 24, 2016
Ice loss spread around
For John Turner, variability climatologist at the British Antarctic Survey, the sea ice anomalies as of November 22 were spread around most of the continent, and so are not merely the result of compaction. (See chart below of the region compared with the average over 2005-15.)
A gauge of the relative strength of the westerly winds that circumnavigate Antarctic – known as the Southern Annular Mode (SAM) – had also turned negative in November.
That means higher-than-usual pressure over the continent and lower pressure at mid-latitudes, a set-up conducive to a hot, dry start to summer, the bureau said this week.
"It's well known that a negative SAM is associated with less sea ice, so it seems likely that this has played a part in the decrease of ice during November," Dr Turner said.
The bureau's Dr Reid said the big El Nino in the Pacific – rated third strongest during the satellite era – was also a factor in making sea ice behaviour down south a more complicated tale than at the North Pole.
"The recent decrease of sea ice is well documented as associated with climate change but there's more uncertainty about the role [of global warming] in the Antarctic," he said.


