Total Fertility Rates by Race in the USA, 1980-2013

Previous posts on fertility rates by race: 1980-2008 and 1980-2010.

I present the latest data on U.S. Total Fertility rates by race through 2013. (Data source links at the end of this post.) You can see herein the full effect of the George W. Bush Housing Bubble in its historical context:
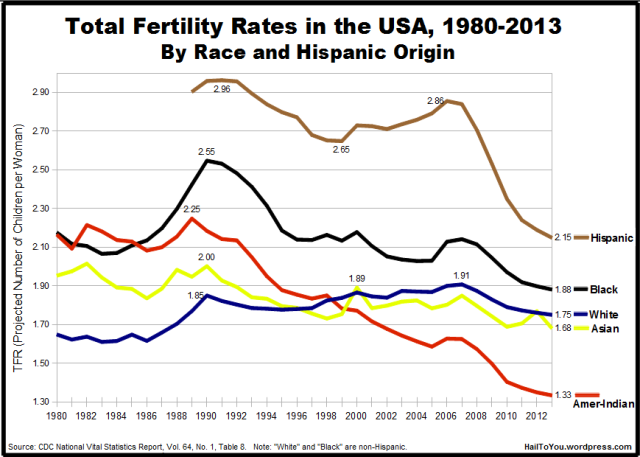
fertility19802013_b.pngNote that this Total Fertility Rate data is based on the race of the mother.

_________________________________________________
The actual number of births in 2013:

  • 2,130,000 babies born to White Non-Hispanic women (54.1%).
  • 580,000 babies born to Black Non-Hispanic women (14.8%).
  • 900,000 babies born to Hispanic women (22.9%).
  • 270,000 babies born to Asian women (6.8%).
  • 46,000 babies born to American-Indian women (1.2%).

_________________________________________________
TFRs for the entire period 1980-2013:

1.97 — Overall USA
1.77 — White non-Hispanic (=child generation is 84% as large as parent generation)
2.16 — Black (=child generation is 103% as large as parents’)
2.70 — Hispanic (’89-’13 only) (=child generation is 129% as large as parents’)
1.84 — Asian (=child generation is 88% as large as parents’)
1.85 — American-Indian (=child generation is 88% as large as parents’)

Note: The size of the child generation is here based on a replacement fertility of exactly 2.10. Higher mortality rates among Blacks and Hispanics partially offset some of this difference. That is, Blacks and Hispanics may have a slightly higher replacement fertility than 2.10.
_________________________________________________

Comments:

(1) The 2000s Housing Boom, or, the 2000s Baby Bubble. The housing bubble brought with it a baby bubble, most especially for Hispanics. The White TFR, too, was apparently lifted by the Housing Bubble, by as much as a sustained one-tenth of a TFR point over a period of years. This amounts to something like a million additional White Americans being born than would have been without the Baby Bubble. (Yes, that gentle bulge in the blue line, from 2000 to 2008 amounts to around a million more White births than would have happened without the bulge.)  However, the number of “extra babies” of other races born during the Housing Bubble considerably exceeds this in relative terms. (With the exception of the luckless Amerindians. See below.)

fertility19802013_b.png

(2) Whites. The good. White Non-Hispanic TFR has been remarkably stable over the past 25 years. White births recovered to 54% of total births by 2013, up from reportedly crossing below the 50% threshold a few years ago (the 2010-2011 period). The bad. White Americans have had sub-replacement fertility since either 1970 or 1971 and TFR reached quite low depths in the later 1970s and 1980s. The current 1.75 children/woman for White women drops to around 1.6 if counting only “White couples,” as about 10% of White women who give birth have a Nonwhite partner according to other data. The verdict. A sustained “all-White” 1.6 TFR means that each child generation is about 75% the size of its parent generation; this means steady population contraction, but no collapse; it puts U.S. Whites better off than very many other ethnic majority populations in the rich world.

(3) Hispanics. Continue reading
Posted in Uncategorized | Tagged , , , , , , , , , , , , , , , , , , , , | 25 Comments

Ancestry of Hillary Clinton

Hillary Clinton 1999

Hillary Clinton is of entirely Northwestern European ancestry, almost entirely British Protestant, but lacks Colonial American ancestry. She was raised a Methodist. She describes her parents and immediate family as “middle class [and] Midwestern” in her autobiography (p.2). She says this of her parents: “They believed in hard work, not entitlement; self-reliance not self-indulgence” (p.2). (The relevant parts of Hillary’s autobiography are included as an appendix below, in which all quotations from it which will be made below can be found).

It seems Hillary identifies personally more with her mother than father (for instance, in her autobiographical breakdown of her personal ancestry, Hillary talks about her mother’s side first, contrary to standard practice; she has much praise for her mother throughout). However, there is some evidence that in terms of abstract, distant ancestry she identifies most strongly with her Welsh ancestors, almost all of which are on her father’s side.

Below are detailed profiles of Hillary Clinton’s eight great-grandparents, with a biographical outline of each person, with a breakdown of his/her personal ancestry. This was partly inspired by Racehist’s recent evaluation of George W. Bush’s (which reveals only 31% New England ancestry).

Earlier ancestry posts are here:
The Hated Richard Nixon’s Ancestry
Mitt Romney’s Ancestry
The German Ancestry of Ron Paul
Newt Gingrich’s Ancestry: The Apple Falls Close.

(A note on the importance of ancestry. I believe that we can gain a special and important insight into a person’s worldview, politics, or motivations, by knowing two related but not identical things: (1) his or her full ancestry and (2) How they see their own ancestry [e.g., which parts they most identify with]. This knowledge can be more highly valuable than volumes of writings, which are subject to social pressures of a given time or place. Most Americans are aware of their own ancestries, and most remain quite “loyal to their ancestry”, all things considered. See also Racehist’s “The 25 Most Influential Liberals in the U.S. Media by Ancestry“.)

Hillary Clinton, circa late 1960s.

Ethnic Breakdown of Hillary Clinton’s Ancestry
— 43.8% England (of which most comes from Northeast England)
— 31.3% Wales
— 13.3% Scotland
— 6.3% France (emigration in the 1830s)
— 5.5% French North American Colonial (Quebec, etc.)
— 0% English-speaking American Colonial

  • Hillary Clinton has no “Colonial American” ancestry at all; that is to say, no English-speaking ancestors in North America prior to Continue reading
Posted in Uncategorized | Tagged , , , , , , , , , , , , , , , , , | 17 Comments

Whites’ Views on Obama 2014-2015, by Demographics (Summary)

White Americans’ Views on Obama by age, gender, income, marital status, children, religion, education, sexual orientation, and more. All graphics are in one post here along with brief summaries. Click on any of the links for more detailed analysis / commentary. Continue reading

Posted in Uncategorized | Tagged , , , , , , , | 1 Comment

[Whites’ Views on Obama] By Education

Whites are mostly negative about Obama, as consistently only around 30% approve of him (despite the Nobel Peace Prize). This 30% figure is far from the whole story. Wide differences in outlook on Obama within the White population are worth considering.

Modern polling allows us to open up a window onto, and look closely at, these differences. There are some surprises.


Using data collected by Reuters’ scientific polling in 2014 and 2015 (for a sample group of over 50,000 Whites), I present an in-depth analysis of White attitudes towards Obama:

1. Whites’ Views on Obama by Age Group, Sex, and Political Involvement
2. Whites’ Views on Obama by Religious Identification (and Race)
3. Whites’ Views on Obama by Sexual Orientation
4. Whites’ Views on Obama by Income
5. Whites’ Views on Obama by Marital Status and Children
6. Whites’ Views on Obama by Education Attained [This Post]

In this post:

Education Attained
Among Whites Over 30

Whites' Views of Obama by Level of Education Attained. [Click to Expand]

Whites’ Views of Obama by Level of Education Attained. [Click to Expand]


Summary of Key Points
The more education attained, the higher the support for Obama. White college degree holders vs. non-degree holders: Ten point jump in support for Obama among men. Fifteen point jump for women. Continue reading

Posted in Uncategorized | Tagged , , , , , , , , , , | 7 Comments

[Whites’ Views on Obama] By Marital Status and Children

Whites are mostly negative about Obama, as consistently only around 30% approve of him (despite the Nobel Peace Prize). This 30% figure is far from the whole story. Wide differences in outlook on Obama within the White population are worth considering.

Modern polling allows us to open up a window onto, and look closely at, these differences. There are some surprises.


Using data collected by Reuters’ scientific polling in 2014 and 2015 (for a sample group of over 50,000 Whites), I present an in-depth analysis of White attitudes towards Obama:

1. Whites’ Views on Obama by Age Group, Sex, and Political Involvement
2. Whites’ Views on Obama by Religious Identification (and Race)
3. Whites’ Views on Obama by Sexual Orientation
4. Whites’ Views on Obama by Income
5. Whites’ Views on Obama by Marital Status and Children [This Post]
6. Whites’ Views on Obama by Education Attained

In this post:

Marital Status and Children, Heterosexuals Over Age 30

Whites' Views on Obama by Marital Status

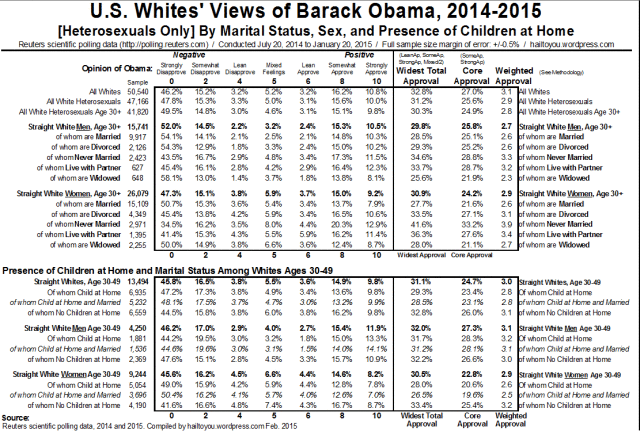
Whites’ Views on Obama by Marital Status and Children. [Click to Expand]


Summary of Key Points
Marriage really affects White women’s politics. White men’s, not as much.
Having children really affects White women’s politics. White men’s, not at all.


Analysis / Commentary
Note: To limit interference, I look at only straight Whites over age 30 at the time of polling (i.e., born before 1985). “Non traditional sexual identities” are excluded because they will skew the “never married” and “no children” categories (we already know that LGBTs are much more pro-Obama than heterosexuals). Under-30s are excluded because many/most who are not yet married are not so by choice but because “it’s not time yet” and will be married by their 30s.

Preliminary Comment: I think this may be the most interesting of all the tables I’ve produced from this polling data. In the first post, I commented that there was apparently “no difference” in White men and White women’s stated views on Obama. Overall, that’s true. Actually, though, there are great differences, revealed by careful analysis:

The Institution of Marriage Affects Women a Lot Continue reading

Posted in Uncategorized | Tagged , , , , , , , , , , , , | 7 Comments

[Whites’ Views on Obama] By Income

Whites are mostly negative about Obama, as consistently only around 30% approve of him (despite the Nobel Peace Prize). This 30% figure is far from the whole story. Wide differences in outlook on Obama within the White population are worth considering.

Modern polling allows us to open up a window onto, and look closely at, these differences. There are some surprises.


Using data collected by Reuters’ scientific polling in 2014 and 2015 (for a sample group of over 50,000 Whites), I present an in-depth analysis of White attitudes towards Obama:

1. Whites’ Views on Obama by Age Group, Sex, and Political Involvement
2. Whites’ Views on Obama by Religious Identification (and Race)
3. Whites’ Views on Obama by Sexual Orientation
4. Whites’ Views on Obama by Income [This Post]
5. Whites’ Views on Obama by Marital Status and Children
6. Whites’ Views on Obama by Education Attained

In this post:

Income

White Views on Barack Obama by Income Level. [Click to Enlarge]

White Views on Barack Obama by Income Level. [Click to Enlarge]


Summary of Key Points
Richer Whites support Obama a little more. Overall, not much difference by income.


Analysis / Commentary

“No Story on Income” is Itself a Story Continue reading

Posted in Uncategorized | Tagged , , , , , , , , , , , , , | 7 Comments

[Whites’ Views on Obama] By Sexual Orientation

Whites are mostly negative about Obama, as consistently only around 30% approve of him (despite the Nobel Peace Prize). This 30% figure is far from the whole story. Wide differences in outlook on Obama within the White population are worth considering.

Modern polling allows us to open up a window onto, and look closely at, these differences. There are some surprises.


Using data collected by Reuters’ scientific polling in 2014 and 2015 (for a sample group of over 50,000 Whites), I present an in-depth analysis of White attitudes towards Obama:

1. Whites’ Views on Obama by Age Group, Sex, and Political Involvement
2. Whites’ Views on Obama by Religious Identification (and Race)
3. Whites’ Views on Obama by Sexual Orientation [This Post]
4. Whites’ Views on Obama by Income
5. Whites’ Views on Obama by Marital Status and Children
6. Whites’ Views on Obama by Education Attained

In this post:

Sexual Orientation

Americans' Views of Barack Obama by Sexual Orientation, 2014-2015. [Click to Enlarge].

White Americans’ Views of Barack Obama by Sexual Orientation, 2014-2015. [Click to Enlarge].


Summary of Key Points
No Gender Gap at all among White heterosexuals. Yes Gender Gap among LGBTs — a surprise. LGBTs more pro-Obama, but Gay men most of all. Tangentially, possible evidence in this data for the social prestige of male homosexuality by the mid-2010s.


Analysis

No Gender Gap at All Among Heterosexuals
“The Gender Gap” is one of the most consistently implied ideas in U.S. political discourse, with it claimed that women (as a whole) are significantly to the left of men. The “Women’s Vote” is often talked about on the basis of this. (This was discussed in the first post in this series as well: White Views on Obama by Age Group ans Sex.) In this data, no gender gap is present at all among White heterosexuals.

The “Core Approval” Continue reading

Posted in Uncategorized | Tagged , , , , , , , , , , | 4 Comments

[Whites’ Views on Obama] By Religious Identification and Race

Whites are mostly negative about Obama, as consistently only around 30% approve of him (despite the Nobel Peace Prize). This 30% figure is far from the whole story. Wide differences in outlook on Obama within the White population are worth considering.

Modern polling allows us to open up a window onto, and look closely at, these differences. There are some surprises.


Using data collected by Reuters’ scientific polling in 2014 and 2015 (for a sample group of over 50,000 Whites), I present an in-depth analysis of White attitudes towards Obama:

1. Whites’ Views on Obama by Age Group, Sex, and Political Involvement
2. White Support for Obama by Religious Identification and Race [This Post]
3. Whites’ Views on Obama by Sexual Orientation
4. Whites’ Views on Obama by Income
5. Whites’ Views on Obama by Marital Status and Children
6. Whites’ Views on Obama by Education Attained

In this post:

Religious Identification and Race

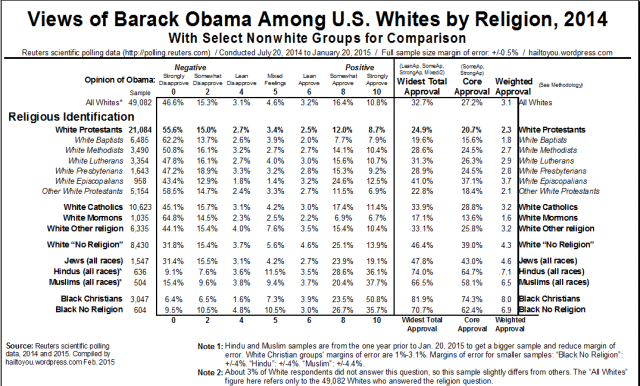
U.S. Views of Barack Obama by Race and Religion, 2014.

U.S. Views of Barack Obama by Race and Religion, 2014. [Click to Enlarge]


Summary of Key Points
Much here is in line with Steve Sailer’s core vs. fringe theory of U.S. politics in the 2000s and 2010s. White Protestants overwhelmingly disapprove of Obama. White Catholics approve of Obama at slightly above the national White average. White Atheist support for Obama is way above the White average. Those eternal outsiders, the Jews, are the most pro-Obama of all. Hindus and Muslims are wildly supportive of Obama in comparison to any Whites. One surprise is that Black Atheists support Obama substantially less than Black Christians, but this can be explained easily if thought about, I think (see below).


Analysis

Protestants
Overall, only one in five White Protestants “strongly” or “somewhat” approves of Obama. This is as expected from actual voting patterns (see analysis on this site of the 2012 Vote by Race and Religion in the South and 2012 Vote by Race and Religion in the Northeast). With the exception of Episcopalians, White Protestants all support Obama at below the national White average, sometimes Continue reading

Posted in Uncategorized | Tagged , , , , , , , , , , , , , , , , , , , , , , , | 7 Comments

[Whites’ Views on Obama] By Age Group, Sex, and Political Involvement

Whites are mostly negative about Obama, as consistently only around 30% approve of him (despite the Nobel Peace Prize). This 30% figure is far from the whole story. Wide differences in outlook on Obama within the White population are worth considering.

Modern polling allows us to open up a window onto, and look closely at, these differences. There are some surprises.


Using data collected by Reuters’ scientific polling in 2014 and 2015 (for a sample group of over 50,000 Whites), I present an in-depth analysis of White attitudes towards Obama:

1. Whites’ Views on Obama by Group, Sex, and Political Involvement [This Post]
2. Whites’ Views on Obama by Religious Identification and Race
3. Whites’ Views on Obama by Sexual Orientation
4. Whites’ Views on Obama by Income
5. Whites’ Views on Obama by Marital Status and Children
6. Whites’ Views on Obama by Education Attained

In this post:

Age, Sex, and Level of Political Involvement

obama_reuterspoll_1agegender

White Americans’ Views of Obama by Age, Gender, and Political Involvement. [Click to Enlarge]


Summary of Key Points
(1) The contention that “White women” or “young White women” represent a core Obama constituency is shown to be false. (2) There is not really a “continuum” of steadily lessening support for Obama with higher age as we might expect, but rather a curiously smooth and neat split into two camps. Among men, those born in or after the mid-1970s support Obama at eleven points higher than those born in the early 1970s or earlier. (Just look at the data above if this is hard to understand in text.)


Analysis

Level of Political Involvement / Enthusiasm Continue reading

Posted in Uncategorized | Tagged , , , , , , , , , , | 7 Comments

The Ethnopolitics of Christmas in the USA

Dr. Greg Johnson, formerly of San Francisco, has emerged over the past five years as a leading voice within the Racialist Right in North America (co-founding the “North American New Right” along the way, along with its flagship webzine Counter Currents). Johnson is a wonder; consistently principled, uncompromising, and committed to a high quality of discourse with neither any “dumbing down” nor any “Pee-Cee-ing up”.


Now, we know that conservative circles chatter about a “War on Christmas” every December. It also so happens that this year saw a member of Congress proclaim that a “War on Whites” exists in the USA. (Finally! Someone said it, exhaled millions.) Greg Johnson has a Christmas-themed essay up reflecting on the ethnopolitics of Christmas (which I think would be a fitting title for the essay) and thus, appropriately, weaves the two aforementioned “wars” together.


Excerpts from an essay on the Ethnopolitics of Christmas by Greg Johnson:

It was about twenty years ago when I first noticed that the greeting “Merry Christmas” was being replaced by the bland, neutral “Season’s Greetings” and “Happy Holidays.” Continue reading

Posted in Uncategorized | Tagged , , , , , , , , , | 1 Comment

The Return of Vanishing American

It was Peter Brimelow who coined the useful phrase “the Historic American Nation” (See the late Lawrence Auster’s post on this concept here). Few, in the past decade, have been as consistent or steadfast in its defense as the blogger Vanishing American (or VA for short) from Texas.

Some time ago, she vanished entirely. I am glad to see that she has risen again. New URL:

VanishingAmericanII.blogspot.com

Her return seems to have been induced by the the Community-Organizer-in-Chief’s “executive amnesty”.

On the purpose of the (revived) blog:

[W]e are still here, we of the ‘old America’, the one now declared obsolete. What are we then? […] Are we people without a country? Aliens in our own birthright country? Continue reading

Posted in Uncategorized | Tagged , , , , , , , , , , | 3 Comments

“A Shabby End to a Mega-Project”: USA’s 2014 Race Riots and the B.H. Obama Legacy

Amid the USA’s race riots of November 2014, we can’t help but think about the legacy of Barack Hussein Obama.

"CNN Shows Depressed Obama and Looters Side by Side" (an observation from Steve Sailer, Nov. 25th, 2014)

“CNN Shows Depressed Obama and Looters Side by Side” (an observation by Steve Sailer, Nov. 25th, 2014)

If there’s any justice, the split screen of the ineffectual Obama and Missouri burning will be the icon of his presidency.
–Percy Gryce, as a comment at Steve Sailer’s.

Just like all the previous anti-White race hoaxes of recent memory, certain powerful people jumped at the chance to prop up the lies around this case, to remind us (again) that “perfidious White malevolence stalks the land in the U.S. of KKK”. They need to feed the beast, you see, a beast I like to call the “Multicultacracy”.


One faithful servant of the Multicultacracy is the disgraced Attorney General Eric “I am a Black Man” Holder. His sympathies are with “his people” (as he once famously phrased it): “[It is] important for local [White] law enforcement authorities to respect the rights of [Black] demonstrators and deescalate tensions by avoiding excessive displays—and uses—of force.”Eric Holder, Nov. 24th, 2014 (Day 1 of the Ferguson rioting).

There are also rumors that Obama and Holder actually ordered the (“racist”?) National Guard to stand down before the rioting. The U.S. Attorney General used to be the foremost lawman of the land. Upholding law and order is a distant second behind Holder’s ethnic activism.


It is in this context that we get this exchange between two Sailer commenters:

Josh wrote:
History books will contain lines like “Despite the achievement of electing the first black president, the 2010s were a time of widespread danger for young black men from Florida to Missouri to California…”

Cagey Beast wrote:
But that is assuming the current political culture will continue into the future rather than fall apart. I’m convinced now that we’re at the end of this era. Have a look at the CNN video and you see the shabby end of a 50yr project and a Continue reading

Posted in Uncategorized | Tagged , , , , , , , , , , , , , , , | Leave a comment

The Community Organizer Didn’t Much Like that Old America.

animosity against white race

“I found a solace in nursing a pervasive sense of grievance
and animosity against my mother’s race [i.e. Whites].”
–Attributed to B.H. Obama

It’s finally happened.

A unilateral declaration of amnesty for “some” of the USA’s teeming millions of illegals, courtesy of B.H. Obama, acting alone but with many accessories before the fact.

Pat Buchanan writes:

[At times like this,] we seem less a nation than some mammoth Mall of America. Continue reading

Posted in Uncategorized | Tagged , , , , , , , , , , , , | Leave a comment

[Movies] Interstellar’s “Blight” as a Racial Metaphor for “Ethnic Third Worldization”

Great science fiction occurs when the skilled writer creates a plausible universe simultaneously exotic and alien, while still politically and philosophically relevant to our world and our society. Great science fiction uses fantasy to comment about reality. –Blogger “Reappropriate

The 2014 blockbuster Interstellar depicts a mid-21st-century USA that has undergone serious decline, in almost all areas, for decades. The USA still hobbles along but has turned into a mushy, faded carbon copy of its former self. Mired in hopelessness, the political apparatus is tasked with managing further decline (which it does in certain pathetic and entertaining ways).

After being shown this vision of our own future, at some point after about the first hour a different movie (in effect) begins. It involves the movie’s titular “interstellar” colonization effort and off we go “through the looking glass” into the wild black yonder of outer space. The rest of the film is only loosely related to the movie we’d seen up to that point.

Staying with the USA as depicted in the film’s first hour: What caused such a steep decline? The answer: “Blight” did it. Blight is only offhandedly-alluded-to on screen and is not explained. So what might it mean? Global warming? Not likely (see point #8 below). It will be shown below that “Blight” in Interstellar can be seen as a racial metaphor for the effects of the ethnocultural displacement of the USA’s core White population by immigrants and resultant Third Worldization.

interstellar_blight

Interstellar: A dust storm in the American Midwest caused by “Blight”

(Preliminary Note 1: On spoilers; Once the major spoilers approach below, you will be warned.)
(Preliminary Note 2: We only see the USA’s Midwest in the movie. There is nothing necessarily USA-centric about Blight as a racial metaphor. It holds for other European-derived societies that are being subject to mass Nonwhite immigration (and, in theory, it can hold for any society at all undergoing such a process]. For simplicity, though, I will limit this analysis to the USA, the setting of the film).

Blight-Induced Decline as Racial-Displacement-Induced Decline
In the universe of Interstellar, social, cultural, and economic decline have all come because of the corrosive effects of “Blight”. “Blight” makes areas unlivable, causes people to emigrate (White Flight), and the spread of Blight, in a few decades’ time, we are told, may spell the end of humanity itself. Let’s be very clear, again: “Blight” means Nonwhite immigration and Third Worldization. Continuing the metaphor, “humanity” by metaphor is the White Core population of the USA.

Consider the following:

(1) Blight acts slowly, over years and decades. People in Interstellar‘s USA may be down on their luck, but they can earn a fair living. They face slow decline. Likewise, real and ongoing racial dispossession is gradual and steady, not a rapid knock-out game. It probably rarely is a rapid process, in any time or place. Racial displacement is generally a process that occurs over decades, even centuries. The USA was nearly 90% White as late as Continue reading

Posted in Uncategorized | Tagged , , , , , , , , , , , , , , , , , , , , , , | 12 Comments

EU Election 2014: Racialist/Nationalist Sympathizers Gain Ground

Slowly, steadily, ominously, Europe’s Race Problem marches on.

A Europe in which the typical man on the street resembles Barack Obama, in which Hip Hop culture rules, in which all of Western Civilization is derided as “racist” and the few remaining Whites are mocked and blamed for ever-growing problems, in which only Islam offers a respite from the nihilism — may be on the horizon (e.g., “White Britons to Become a Minority by 2060s” and already are a clear minority in London). France may be the first to turn majority-Nonwhite (see, e.g., here) but all the Western countries are on the way.

The European Union itself is dedicated to this project and sees it as a moral good. Ultimately is comes from the the masochistic Far-Left. The acquiescent Respectable Right does little, and ultimately has no problem with de-Europeanization. (Perhaps it’s better called the Neglectable Right, as it doesn’t actually offer anything that isn’t so watered-down that one wonders what the use is in drinking it.)

Proponents of ethnocultural continuity for European Mankind (histrionically called “the Far Right”) do exist, and have made great strides in the past decade.

The EU Parliament has just had an election, and the Neglectable Right (by which I primarily here mean the EPP bloc, below) lost ground to parties with racialist or nationalistic sympathies.

And here are the full results (as of this writing), by party bloc, for the 2014 election [with the share of the 751 seats won]:

_______________________________
PRO-EU Blocs [Won 70.4% of EU seats in 2014]
EPP — Center-right [28.4%]
S&D — Center-left (e.g. UK Labor, German SPD) [25.6%]
ALDE— Free-market [8.8%]
Greens — Left-wing Green [7.7%]
_______________________________
EUROSKEPTIC Blocs [29.6%]
GUE — Neo-Communists [5.9%]
ECR — Euroskeptic Respectable Right (led by UK Tories) [9.1%]
EFD — Moderate Nationalists/Racialists (UKIP, Lega Nord, Danish People’s Party, True Finns) [7.2%]
NI — Non-Aligned. These MEPs are mostly “Far Right” often bordering on explicit pro-White racialism (France’s Front National, Jobbik in Hungary, Geert Wilders, Vlaams Belang, Austrian Freedom Party; NI may also include miscellaneous parties like Germany’s “joke parties”, e.g. the Pirate Party, who gained a seat) [7.5%]
_______________________________

Continue reading

Posted in Uncategorized | Tagged , , , , , , , , , | 3 Comments