


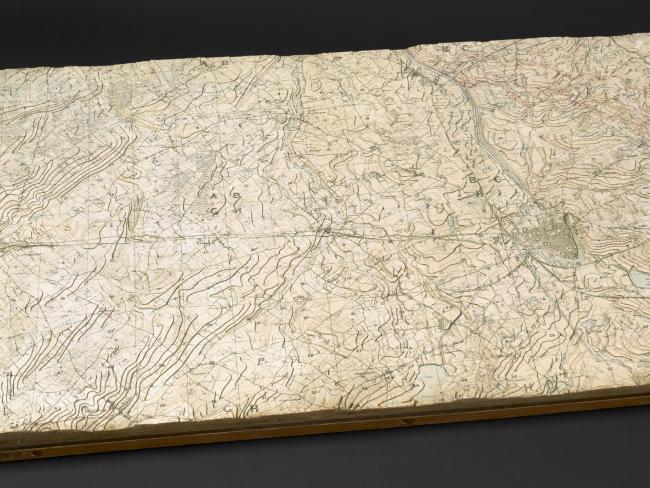
The Soviet Union’s secret map of Brighton in the UK contains extraordinary detail about building use and was one of hundreds produced of major cities around the world. Picture: British Library.

DURING the depths of the Cold War, a secret Soviet project was painstakingly carried out.
Military personnel produced intricate maps of major cities around the world — including in Australia — with buildings colour-coded according to category.
The Australian maps were produced in the 1980s, and include multiple pages of detailed topography for Sydney, Adelaide, Brisbane, Canberra and Perth.
Industrial, military and administrative structures were duly recorded with information on the height of trees, volume of reservoirs and depth and flow of rivers.
The entire project remained secret until 1990 when the breakup of the Soviet Union saw the maps sold off and scattered across Europe.
Collector John Davies, who bought some from a bookshop in Latvia and is compiling them for publication, said it’s unknown why documents of such “astonishing accuracy” were produced under Cold War conditions.
“My guess is that there was an underlying assumption that ‘one day’ communism would prevail peacefully, the Soviet Union would be in charge and this is the kind of information you would need to run the local administration,” he said.

The Soviet maps show buildings coded in different colours and information on the depth of rivers and height of trees. Picture: British Library.Source:Supplied
A map of Brighton, UK, is just one of those on display at the British Library’s latest exhibition, Drawing the Line, which charts the way maps have changed the way we see the world.
Distilled from a collection of more than 4 million, the 200 articles include everything from a 1767 luxury hand-drawn route for the Earl of Bute to travel to his Luton estate to handpainted watercolours of Africa and South America for the inclusion in a 1957 illustrated atlas.
It’s divided into five sections from Mapping the New World to War, Peace, Modernity and Movement. Lead curator Tom Harmer said the 200 “virtual worlds” are “witnesses to the past” that have seen countries change borders, road maps be replaced by GPS and terrain used as a political and economic tool.
Some are objects of beauty and others are “weapons of war” but all have changed the way we live our lives in some way, he said.
“We see maps before we see most places. Maps precede the territory they represent. That gives them incredible power.”
Highlights include hand drawn scrawls showing how Britain and France divided the Ottoman Empire between them and relief models of the front line of World War I.
There are sketches of Tolkein’s Middle Earth and Winne the Pooh’s 100 “aker” wood, sticks used to ocean swells and NASA images showing the early universe before the creation of galaxies.
Russell Crowe, here’s one for you as you can take a look at some of the best below.
I love Maps
— Russell Crowe (@russellcrowe) January 23, 2013

A Portuguese political cartoon showing European powers depicted as animals tearing themselves apart before the outbreak of the First World War.Source:Supplied

The map that British and French diplomats Sir Mark Sykes and Francois Georges-Picot drew on at a secret meeting to carve up the Ottoman Empire. ‘A’ represents French territory including Syria and Lebanon. ‘B’ represents Iraq, Transjordan and Palestine. It became known as the Sykes-Picot agreement.Source:Supplied

An original watercolour of South America done as preparatory artwork for Odham’s New Illustrated Atlas of the World, published in 1957.Source:Supplied

A political cartoon from 1984 showing the “World According to Ronald Reagan”. It features “kangaroos” for Australia.Source:Supplied

The original London tube map designed by engineer Harry Beck in 1931 as a way of clearly communicating to travellers the only information they needed to know. The design is now the basis for public transport maps all around the world.Source:Supplied
A relief model of the front lines in the First World War made by the British Ordnance Survey team for generals on the front lines. It was made by cutting out maps and pasting them on fine layers of wood to give a true perspective of what the territory looked like. Picture: British LibrarySource:Supplied

The Atlantic Ocean floor produced by Marie Tharp and Bruce Heezen which popularised the theory of tectonic plates which make up the earth’s crust. Picture: British LibrarySource:Supplied

Artist Jeremy Wood carried a GPS in his pocket for 16 years and produced this piece called “My Ghost”. The lines in yellow are flightpaths and the white is journeys by car or on foot. Picture: British Library.Source:Supplied
Drawing the Line is on at the British Library, London until March 2017
The Battle of Kursk: Southern Front45:01

This is the story of the largest tank battle in military history, as elite SS troops face off against Russian defenders determined to stop them whatever the cost.