Cheap airfares have hit Flight Centre’s bottom line.

IS FLIGHT Centre doomed for a hard landing, or just going through some turbulence?
There’s no question the travel group is having a rough time. Flight Centre shares have been hammered since Friday, when it announced its full-year profit was set to fall as much as 9 per cent.
The company blamed the projected drop on widespread airfare discounting hitting its bottom line, despite increased transactions. Average international fares sold by Flight Centre in Australia are down seven per cent on the same time a year ago, it said.
The travel group said it was selling more tickets, but that those tickets were cheaper because many airlines are offering substantial discounts, particularly in its key markets of Australia, the US and India.
Flight Centre said its underlying profit was expected to finish between $320-$355 million for the 2017 financial year, compared with $352.4 million in 2016.
The news sent investors heading for the exits, with shares plunging 8 per cent, or $2.65, to close at $30.30. Monday saw continued choppy trade, with Flight Centre shares regaining early losses midmorning before dipping to $30.12 by midday AEST.
Flight Centre managing director Graham Turner said on Friday that despite the lower forecast, it was still expecting to break $20 billion in total transaction volume (TTV) for the first time.
“When we released full-year accounts for FY16, we said we expected to surpass the $20 billion TTV barrier for the first time this year and that we would be disappointed if we didn’t grow underlying [profit],” he said.
“That remains the case, although the internal and external factors that are currently impacting top and bottom-line results mean that we will not be tracking at those levels by the end of the first half, despite a relatively strong sales performance.
“On a positive note, we are recording strong growth in ticket volumes. In Australia, our growth — which is about 9 per cent year-to-date — is outpacing industry growth and appears to be accelerating.
“Travellers have, of course, been the big winners in this low-fare environment and have been snapping up some of the cheapest fares we have ever advertised.”
But despite what appears to be a strong underlying business, it’s clear investors aren’t thrilled. Flight Centre’s high fixed costs from its global network of more than 2500 physical stores has in the past been singled out by analysts as a concern.

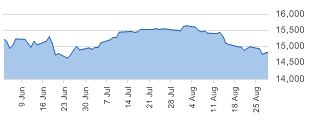
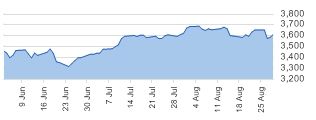
Flight Centre (blue) versus Webjet share performance.Source:Supplied

Over five years, Webjet is up 289 per cent, Flight Centre is up 53 per cent.Source:Supplied
In the past year, Flight Centre’s shares have dropped by nearly 20 per cent. Shares in online-only competitor Webjet, by comparison, are up more than 86 per cent in the same period. Compared with five years ago, Flight Centre shares are up nearly 53 per cent, but Webjet has soared by 289 per cent.
It’s not exactly apples and apples, however. In 2016, Flight Centre's TTV was $19.3 billion, up 9.7 per cent, and revenue was up 11.2 per cent to $2.7 billion. Webjet’s TTV was $1.63 billion, an increase of 28.8 per cent, and revenue was up 29.1 per cent to $155.3 million.
Daniel Mueller, senior equities analyst with Forager Funds Management, said it was still a “reasonably high quality business” but was facing a number of headwinds.
“Even though they’re looking like they’re going to grow TTV, as a retailer there is inherent cost inflation in their business in rents and staff costs,” he said.
“Flight Centre is a fairly mature business now, market share gains have picked up as much as they can in Australia so they’re trying to go overseas for growth, whereas Webject is a smaller, more nimble company.
“It’s added a lot of new offerings, not just flight bookings but packages, hotels and car hire, so they’re able to grow that way.”
Mr Mueller said he “certainly” didn’t think the Flight Centre business model was broken. “It’s just a case of more realistic assumptions for growth over the long-term,” he said. “What we’re seeing now is part of the reaction to that.”
In May, Macquarie warned investors to steer clear of the stock. “While Flight Centre’s balance sheet appears robust with net cash of $400 million, given a high fixed cost base, operational leverage is a key concern,” Macquarie said.
Deutsche Bank also issued its own warning. “Falling airfares used to be a good thing for Flight Centre given lower prices had stimulated sufficient volume uplift historically to more than offset the deflationary impact,” Deutsche said.
“The worry now is that the competition between airlines and capacity increases driving recent falls in airfares mean Flight Centre’s total transaction value is split across more carriers.
“As such, it is not delivering sufficient growth to the incumbent suppliers that is required to earn the super-overrides which have underpinned margins in the past.”
Sean O’Neill from investment website Motley Fool said there was unlikely to be any relief in the near term, with short-seller interest in Flight Centre at 8 per cent.
“I wouldn’t be surprised to see it intensify as an equally weak second half (Flight Centre expects a stronger second half) seems a possibility, given the high levels of competition in the airline business,” he wrote.
But Mr O’Neill said it was important to take away that the group’s underlying business was still growing transaction volumes strongly, despite the decline in ticket prices.
“Flight Centre has a strong balance sheet with minimal debt, and its growing exposure to India and China will give it an important foothold in two huge growth markets over the long term,” he said.
“I continue to believe Flight Centre looks like a good long-term business, but investors should be prepared for volatility in the near term.”