5

SA state redistribution – draft boundary analysis

screen-shot-2016-10-19-at-8-22-18-pm
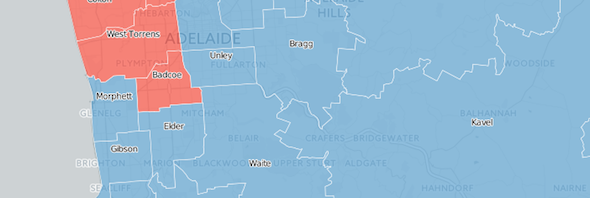
While we were all recovering from the federal election, South Australia was undergoing a redrawing of its state electoral map for the 2018 state election. The draft electoral map was released in mid-August, and I blogged about the underlying statistics driving the redistribution at the time.

It’s taken me some time to get back to this redistribution, what with the many territory elections, council elections and by-elections taking place following the federal election, but it’s now complete.

You can download the 2018 draft map here.

The last election produced a result of 23 Labor seats, 22 Liberal seats and two independents. One of those independents, Geoff Brock, sided with Labor to give them a governing majority, while the other independent, Bob Such, went on sick leave soon after the election and later died of cancer. During Such’s absence, former Liberal leader Martin Hamilton-Smith resigned from the party to join Labor’s cabinet. Labor subsequently won the Fisher by-election, giving them a majority in the House of Assembly.

The Electoral Districts Boundaries Commission is required by law to consider the party-political impact of the redistribution, with the aim of producing a result which will give a majority of seats to the party that wins a majority of the two-party-preferred vote. Despite this requirement, Labor won a majority in 2010 despite a Liberal vote majority after preferences, and achieved government again despite losing the vote in 2014.

In line with their mandate, the EDBC has redrawn the boundaries to boost the Liberal position. Assuming no change from the 2014 election vote which gave the Liberal Party 53% after preferences, the new electorates would give the Liberal Party 24 seats and Labor 22. The last seat, Frome, is drawn as notionally Liberal but is held by an independent. Theoretically this should mean that the Liberal Party should be able to win a majority with no change in their vote (assuming they can win back Hamilton-Smith’s seat), although this theory did not work at the last two elections.

45 electorates remain notionally held by the party that won them in 2014 (either at the general election or, in the case of Labor and the seat of Fisher, at the by-election). The other two seats are Elder, in southern Adelaide, and Mawson, which has moved from being a southern Adelaide seat into a regional electorate by stretching out to take in Kangaroo Island and the Fleurieu Peninsula. Both seats are held by Labor MPs but are now notional Liberal seats.

The following map shows the new electoral map. Click on each seat to see the post-redistribution margin, and who held the seat before the redistribution.

This map is only a draft – we should be expecting a final version of the map to be released in November.

5

ACT election night – results live

11:00pm – Here’s my final update for tonight.

Based on the work I’ve shown in the last few updates, I estimate that Labor has won twelve seats, the Liberals have won nine and the Greens have won two.

Labor has won two in each district, plus a third in Ginninderra and Yerrabi. The Liberal Party is on two seats in all districts except Kurrajong. The Greens have won seats in Kurrajong and Murrumbidgee.

The two other seats still in play are:

  • Brindabella – third Liberal, third Labor or Sex Party.
  • Kurrajong – likely to go to second Liberal, but with the third Labor candidate having an outside chance.

If Labor were to win either of those two outstanding seats they would win a majority in their own right, in which case they wouldn’t need the support of the Greens to govern.

This election has been a good result for Labor. The conventional wisdom before election night was that Labor was in trouble and in danger of losing power, with the light rail damaging their position.

In reality, Labor has slightly increased their vote, while the Liberal vote has been cut by 3.3%. The Greens vote has stayed steady, while the vote for other parties and independents increased by almost 10%. Labor did particularly well in the seat of Yerrabi, with a swing of 2.8%. This area will be the main beneficiary of the first stage of the light rail, and has clearly helped Labor solidify their position.

10:53pm – In Yerrabi, the Liberal Party is on 2.1 quotas, Labor is on 2.7 quotas and the Greens are on 0.4 quotas.

The Liberal Party’s third candidate was about 1000 votes from knocking out the third Labor candidate. The Labor and Greens vote have both increased (by a total of 1.8%) with the addition of paper votes, while the Liberal vote has dropped by 2.1%, so the chance of a third Liberal appears to have faded.

10:43pm – In Murrumbidgee, the Greens are on 0.7 quotas, Labor is on 2.1 quotas and the Liberal Party is on 2.5 quotas.

In the interim distribution of preferences, the Greens’ Caroline Le Couteur defeated third Liberal Peter Hosking by 127 votes (just under 1% of the total). The addition of paper votes has cut the Liberal vote by 1.3%, while increasing the Labor vote by 0.66% and the Greens vote by 0.48%.

It’s hard to see the Greens not winning this seat.

10:34pm – How about Kurrajong?

Labor has polled 2.4 quotas, the Liberal Party 1.7 quotas and the Greens 1.2 quotas.

The distribution of preferences is quite clear, with Labor and Liberal winning two seats each and the Greens winning one.

The Liberal vote has dropped by 2.8% since the distribution of preferences, while the Greens vote has increased by 1.6% and the Labor vote has increased by 0.5%. At the key point in the count, the third Labor candidate was about 7.4% away from outpolling one of the two Liberals. It seems unlikely that this gap will close, but it is possible.

10:23pm – Okay, let’s check out Ginninderra.

Labor is sitting on 2.5 quotas on primary votes, with the Liberals sitting on 1.8 quotas and the Greens on 0.6 quotas.

On the distribution of preferences, Labor wins three seats and the Liberals win two, with the fourth Labor, third Liberal and lead Green all getting knocked out in a tight race.

The Labor and Greens vote has increased slightly on the paper vote, while the Liberal vote dropped from 32.7% to 30.5%.

This drop in the vote should rule out the chance for a third Liberal, although the race for the second Liberal seat is very close – Elizabeth Kikkert outpolled Paul Sweeney by less than one hundred votes.

The third Labor seat is also unclear – Gordon Ramsay outpolled Labor colleague Chris Bourke by only six votes, with the Greens’ Indra Esguerra only 21 votes behind Bourke.

It seems quite possible that Esguerra could overtake one or both of the remaining Labor candidates, but you’d expect Labor preferences to lock out the Greens.

9:44pm – Let’s run through the seats one by one, starting with Brindabella.

Labor sits on two quotas in Brindabella, with that vote evenly distributed between four candidates. Sitting MPs Mick Gentleman and Joy Burch lead on about 0.5 quotas, with two others following on 0.4 quotas. These candidates won’t all make it to the end, but they’ll stay in the race for a long time to collect other parties’ preferences.

The Liberals are sitting on 2.4 quotas in Brindabella, with Andrew Wall and Mark Parton leading with 0.7 and 0.6 quotas respectively. Nicole Lawder (0.5 quotas) is leading in the race for the final seat but the flow of preferences suggest that she will do poorly on preferences.

The Sex Party is on 0.5 quotas, although those votes are reasonably evenly divided between their two candidates.

The Greens’ vote is on 0.3 quotas (possibly the first time the party has been outpolled by the Sex Party).

It appears that the race for the final seat is between one of the Labor candidates, one of the Liberals and the Sex Party candidate. The gap on the interim distribution of preferences between the third Liberal and third Labor is less than 300 votes – and the Liberal vote has dropped amongst the remaining votes.

9:34pm – Kevin Bonham points out that, while the Liberal Party has a strong lead for the fifth seat in Brindabella, they lose a lot of ground in the interim distribution of preferences and could well lose that seat to Labor, while the Sex Party still has a chance.

9:30pm – In case it wasn’t clear, the Labor Party looks set to win re-election. We don’t know for sure whether the seats will split along the lines that the pre-poll distribution of preferences suggest, but the Liberal Party will be unable to win a majority of seats, or find allies on the crossbench.

8:18pm – Let’s look at the swings by district. Labor has gained a swing in Brindabella, lost ground in Ginninderra, Kurrajong and Murrumbidgee and gained a massive swing in Yerrabi.

8:15pm – It is now very clear that the Liberal Party had gone backwards. They were previously one seat short of a majority, and now look likely to be two seats short, and have suffered a 2.4% swing, while the Labor vote has gone up.

8:12pm – We now have interim distributions of preferences for all five seats based on electronic votes, which gives Labor 12 seats, Liberal 11 seats and two seats to the Greens.

7:00pm – I’m going to be logging off for the next hour while I eat dinner, but I’ll return later when we have a larger sample of votes.

6:59pm – More votes have come in in Yerrabi – the Labor vote is down a bit and the Liberals are up but it still seems likely that the left will win three seats.

6:54pm – First results in Yerrabi are good for Labor. Labor is on 2.6 quotas and the Liberal Party is on two quotas, with the Greens on 0.4 quotas. That looks likely to give Labor three seats. But these numbers are very small.

6:52pm – It looks very likely that either Labor or Greens will win the fifth seat in Ginninderra, and that the Greens will win the fifth seat in Kurrajong. This puts the governing alliance on twelve seats. If they can win the final seat in Yerrabi or Murrumbidgee that will mean Labor and the Greens will be able to form another majority.

6:50pm – Those Kurrajong votes are already out of date. Both major parties are now on about 2.2 quotas with the Greens on 0.9 quotas. This suggests a result of 2 Labor, 2 Liberal and one Green.

6:48pm – We have a small sample of pre-poll votes in Kurrajong and it is good for the Liberals: Liberal 2.65 quotas, Labor 1.94 quotas and Greens 0.69 quotas. Antony Green suggests these votes are likely those cast in neighbouring seats.

6:46pm – Remember we have the Robson Rotation system in the ACT. Parties nominate a ticket of up to five candidates, but not in any particular order. Different ballot papers show the candidates in different orders. So if a voter doesn’t have a preference for an individual candidate they would be likely to just donkey vote for the candidates. Robson rotation means these donkey votes are evenly distributed around, and if there isn’t a particularly high-profile candidate the vote for a party can be distributed fairly evenly, as we’ve seen for Labor in Murrumbidgee and Ginninderra.

6:42pm – First numbers for Ginninderra have Labor on 2.6 quotas, Liberals on 1.6 and the Greens on 0.6.

6:40pm – Labor on track for two in Brindabella, and the Liberal Party winning at least two and in a good position to win the third seat. The Sex Party is doing surprisingly well on the electronic vote with 0.4 quotas.

6:39pm – Let’s just zoom out to the overall race. There are five districts of five members each. It’s expected that Labor and Liberal will each win two seats in each district, giving them at least ten seats each, with the final five seats (one per district) up in the air.

It seems very likely that the Greens will win the fifth seat in Kurrajong and the Liberal Party will win in Brindabella, with Labor or Greens likely to win the fifth seat in Ginninderra. This leaves Yerrabi and Murrumbidgee as the two swing seats. If the Liberal Party can win third seats in these two districts that will give them a slim majority in the Assembly – if they go to Labor or Greens it will give the centre-left alliance a majority.

6:35pm – First chunk of votes is pre-poll votes for Murrumbidgee. Bear in mind that Murrumbidgee is one of the key swing districts where the Liberals will need to win three seats to have a shot at winning a majority. The Liberals are on 2.65 quotas, Labor is on 2 quotas, and the Greens on 0.63. On those figures, the third Liberal and the Greens candidate would be competing for the final seat, but it’s interesting to note how evenly distributed the Labor vote is between their candidates, none of whom are incumbents.

6:30pm – I’m having trouble getting the Elections ACT results website loading – hopefully this works itself out soon but it doesn’t appear there are any concrete figures yet.

6:10pm – Just in case you missed Antony Green explain this on the ABC – the electronic votes should mostly report primary vote figures before 7pm, and we’ll start to get paper ballot vote-counts after 7pm, and later this evening we’ll get a distribution of preferences for just the electronic votes. Hopefully we’ll be able to compare the primary vote between electronic and paper votes to get a sense of how the distribution of preferences should be adjusted.

6:05pm – I’m reminded of the last New Zealand election. There had been a large increase in votes cast electronically, which were counted very early in the night. In the past there had been a bias in the early electronic vote count, but the number of votes cast electronically had grown significantly, and this resulted in the electronic vote being more representative. In the past the electronic vote has favoured the Greens, but as more people use this option you’d expect such a bias to become less significant.

6:00pm – Polls have just closed in the ACT election. I’ll be covering the results tonight but not as comprehensive as always, and I’ll be absent for most of the time from 7pm until 8pm. A large proportion of votes in the ACT will have been cast electronically, so those votes should be counted pretty quickly. There has also been a large increase in pre-poll voting, from 61,660 votes in 2012 to 83,743, an increase of almost 36%. Stick with us.

Tags:
1

What’s going on at the Tally Room

This blog has been pretty quiet since the conclusion of the NSW council elections. I’m working on a few different projects in the background and I just wanted to give a quick update.

Firstly, I’ve been working on a project to collect together all of the results of the NSW council elections to publish in an easy-to-use format for data analysis. This is part of a broader project to publish local and state election results in an easy-to-use format, since so many electoral commissions do not publish results (as well as candidate and booth lists) in accessible formats, unlike the AEC. Unfortunately I’ve hit a wall in scraping the data for the 2016 council elections, although the data for the 2011 and 2012 elections is ready. If you’re an expert on web scraping who can help me with this, drop me a line. Once this is done, I might do some high-level comparisons of the 2012 and 2016 election results.

The ACT election is due this Saturday, and I’ve got guides published for all five electorates which you can read here. I’ve got an article going up at the Guardian today about the election which is also worth a read. Unfortunately I won’t be around to do a liveblog on Saturday night, but I will return to do some overall analysis on the weekend.

Three by-elections are due in New South Wales in November and I’ve published guides for all three seats. This includes a guide to the Wollongong by-election, which was only recently written.

Beyond that, I’ve been making maps for a couple of recent redistributions. The Northern Territory is in the midst of a redistribution, whereby the urban seat of Solomon will lose some areas on the outskirts of Darwin and Palmerston to the seat of Lingiari. This is the first time since the territory was split into two electorates in 2001 that the boundaries will be changed. I’ve completed a map of the new boundaries which you can download from the maps page.

I am currently working on the new draft map for the South Australian state redistribution, and I’ll be publishing that probably next week, and once the draft boundaries are released for the Queensland state redistribution I will also make a map of those boundaries.

Then once all that’s done I plan to get into preparing the guide to the Western Australian state election, for early next year.

So I will pop up from time to time, but mostly I’ll be away in the background for the remainder of this year.

22

NSW council election – statewide results

screen-shot-2016-09-15-at-9-34-25-amCoverage of local council elections understandably focus on local stories, but this can make it hard to get a broad perspective on how an election has gone. A poor result in one high-profile council doesn’t necessarily mean that party has done poorly in most places they have run, and it’s always possible to focus on success stories over failures. Most frustratingly, council stories are rarely in proportion to the sizes of councils. I’ve tried to remedy this by focusing on the eight most populous councils, most of which are in Western Sydney.

I’ve been working on pulling together booth-level and ward-level data for the 2012 council election. It’s not quite finished, but later this year I’ll be publishing data for this election, along with a few other elections where data is hard to access.

This has allowed me to run a comparison of the election results for the areas that went to the polls on Saturday, looking at the same areas in 2012.

In this post I’ll run through the statewide totals for each party, note some unusual trends and talk about the difference between the councils up for election this year and next year.

Party Votes % Swing
Labor 406,737 24.4 +5.9
Liberal 266,983 16.0 -0.4
Greens 102,276 6.1 +0.5
Other parties 23,196 1.4 -0.4
Independents 870,204 52.1 -5.7

Read the rest of this entry »

12

NSW councils election night results

12:10am – Last comment from me, a summary of the state of the race in the nine biggest councils:

  • Blacktown – Labor has regained its majority on Blacktown council, winning at least nine seats, and possibly ten. No independents will be elected, with 5-6 Liberals filling the remaining seats.
  • Sutherland – The Liberal Party has lost its majority. They will need one extra vote for a governing majority, and will likely rely on Steve Simpson, who was a Liberal until recently.
  • Fairfield – This council remains up in the air, with the mayoralty a close race between Labor’s Del Bennett and the incumbent Frank Carbonne. Labor has won at least five out of twelve council seats, and could win as many as seven. Carbonne’s independent ticket (along with Dai Le) has won at least two council seats, but could win as many as four. So this council could see Bennett at the head of an enlarged Labor majority, or Carbonne as mayor of a divided council, with a bloc of five Labor councillors and five members of the Carbonne/Le group.
  • Sydney – Clover Moore has thoroughly seen off the challenge to her leadership. Her group looks likely to win six council seats (not counting her mayoral seat). Labor and Liberal have each retained one seat. The last seat is a race between conservative independent Angela Vithoulkas and the Greens’ Lindsay Johnston. There’s a lot more Liberal preferences than Labor preferences, and Vithoulkas should benefit from late counting, so it seems likely the Greens will be wiped out.
  • Liverpool – Labor’s Wendy Waller looks set to be re-elected as mayor. Labor will need the vote of one of the two members of the Liverpool Community Independents Team for a working majority.
  • Penrith – Labor has rebounded from four to seven seats, but will need the support of an independent to have a working majority. They can choose between longstanding independent Jim Aitken, right-wing ex-Liberal Marcus Cornish, or possibly the Greens’ Michelle Tormey or longstanding independent Kevin Crameri, if either of them wins the final seat in the north ward.
  • Lake Macquarie – Labor has won a majority on the council, and strengthened their hold on the mayoralty, while the centre-left Independent Lake Alliance has dropped to a new low.
  • Campbelltown – Labor has rebounded, winning seven of fifteen seats. Labor will have a number of options for a working majority, including the Greens’ Ben Moroney and independent Fred Borg.

And with that, I’ll call an end to this liveblog.

12:06am – Okay, some final thoughts and I’ll check out.

Labor are big winners from tonight. Labor has regained control of Blacktown and Campbelltown councils, while winning majorities in Lake Macquarie and Cessnock. Labor has bounced back in Penrith and Liverpool, although they will have tenuous working majorities. The Liberal Party went backwards in most of these councils, and also lost their majority in Sutherland. Labor’s biggest black mark was in Fairfield, but even there they may well strengthen their majority.

Clover Moore is a big local winner, holding on against targeted legislation to remove her. Moore has strengthened her majority, squeezing out the other parties.

The result is mixed for the Greens. They haven’t done particularly well in the big eight councils, only winning a seat in Campbelltown, where the quota is very low. Losing their sole seat in the City of Sydney will be disappointing – the party has been made effectively redundant by Clover Moore. The other big council where the Greens should have had a good chance of winning seats was Lake Macquarie, where an unforced error saw the party fail to successfully nominate candidates. It was always going to be very difficult for the Greens to win seats on councils like Fairfield, Liverpool, Blacktown, Sutherland or even Penrith, but in most of these places the Greens haven’t moved any closer to winning.

But the Greens have had some very good results, strengthening their hold in Byron and doing very well in Shoalhaven, and winning seats on councils like Kyogle and Albury.

11:51pm – Some general thoughts: this year has been bad for independents in major urban councils. Independents went backwards significantly in Lake Macquarie, where they used to govern. Less independents will be elected in Penrith and Cessnock, while Sutherland is now overwhelmingly dominated by parties. Labor has emerged on Shoalhaven council along with a bigger bloc of Greens, while no independents look likely to win in Blacktown. Campbelltown council’s system allows for broad diversity, but we’re seeing minor parties displace independents. One longstanding independent looks set to lose her seat to the Christian Democratic Party, while another independent elected in 2012 joined Labor.

Fairfield is the most obvious exception to this rule, with both major parties splintering off into effectively a third party of independents.

11:45pm – In 2012, Labor fell short of a majority in Cessnock, winning five of twelve council seats plus the mayoralty. They’ve regained that majority, winning seven council seats plus the mayoralty. The Liberal Party has held on to their three seats. The previous council included one Green and three independents. The Greens won’t be returning to Cessnock in the next term, while only two independents have held on.

11:33pm – Well Shoalhaven is interesting. I wish I had been able to do coverage of the next most populous council up for election, after the eight I did cover. The current council includes three members of the Shoalhaven Independents Group, one Green, and nine independents including incumbent mayor and former federal Liberal MP Joanna Gash. The new council will include five members of SIG, three Greens (with a full quota in all three wards), one Labor and three members of Gash’s team.

The mayoral race is even more interesting. Joanna Gash leads on 36.5%, followed by the Greens’ Amanda Findley on 33.7% and SIG’s Greg Watson on 29.8%. I’m told that Watson’s preferences favour Findley. If this takes place, Findley will become the third directly-elected Greens mayor after Jan Barham and Simon Richardson (both from Byron), but for a council three times the size of Byron.

11:28pm – Some other councils I haven’t covered:

  • Hawkesbury – the Liberal Party has lost their fifth seat, while Labor has gained a second seat and the Greens have held on to their seat. The other five seats remain held by independents, and I’m not across their political persuasion. A referendum on introducing wards to Hawkesbury Council was overwhelmingly defeated.
  • Byron – the Greens had been reduced to two councillors (in addition to the mayor’s seat) in 2012. This time the Greens have polled almost four full quotas. If they had run a bigger ticket, they would have won a majority. But they only ran four candidates, and one of those will be disqualified as he will be elected mayor. So a full quota of Greens votes will flow as preferences, presumably helping elect other progressive candidates.

11:08pm – In addition to holding on to the Lake Macquarie mayoralty with an increased vote, Labor has also won an additional council seat. The party won five council seats in 2012, they’ve increased this to six in 2016, which combined with the mayor’s vote gives them a majority. The Liberal Party has held on to their three seats: one in each ward. The Independent Lake Alliance, who dominated the council before the 2012 election, has been further diminished. The alliance held on to four seats in 2012, but could win as few as one, with the far-right Lake Macquarie Independents challenging the Alliance for their seats in two wards.

The Lake Macquarie Independents candidates have polled around 0.85 quotas in the east and north wards, ahead of the Independent Lake Alliance candidates on around 0.74 quotas. There is 0.4 quotas of Labor surplus in the north ward, and 0.2 quotas in the east ward – if those votes flow to the ILA they could hold on to these two seats, but it will be uphill. The ILA has definitely lost their second council seat in their west ward stronghold.

10:53pm – While Labor is struggling to win the Fairfield mayoralty, they could well win a majority on the council. Labor has won five seats, the Liberal Party has won two, and prominent councillors Dai Le and Frank Carbonne have been re-elected as councillors. Carbonne’s seat will pass on to his running mate, former state Liberal MP Andrew Rohan, if he wins the mayoralty. There is one seat up for grabs in each ward.

In Cabravale ward, the race is between the first Liberal and independent Kevin Lam, with an outside chance for sitting independent councillor Nhan Tran. In Fairfield ward, the last seat is a race between Labor and Charbel Saliba, an ex-Liberal councillor running on the Carbonne/Le independent ticket. In Parks ward, the last seat is a race between Labor and Frank Carbonne’s second candidate (or third, if Carbonne wins the mayoralty).

If things go Labor’s way, they could win seven out of twelve councillors. If they don’t, the Carbonne/Le ticket could win third and fourth seats, possibly giving them five if Carbonne wins the mayoralty.

10:36pm – We now have a majority of the vote counted in Campbelltown, which consists of fifteen councillors elected to cover the whole council (no wards). Labor has gained a sixth and seventh seat (although they gained a sixth councillor in the last term after an independent councillor joined the party). The Liberal Party have held on to three of their four seats, while the Greens have returned to the council. Independents Paul Lake, Fred Borg and Bob Thompson also look set to be re-elected. The last seat appears to be a race between the lead Christian Democratic Party candidate (0.59 quotas), the second candidate on Fred Borg’s ticket (0.52 quotas) with longstanding independent Sue Dobson trailing on 0.47 quotas. In addition to the Liberal Party losing their fourth seat, and Dobson possibly losing her seat, Liberal Democrat councillor Clinton Mead has fallen far short.

Labor’s only allies in the last council were those elected on Fred Borg’s ticket, but presumably they will also have the support of the Greens. This means the centre-left coalition will hold 9-10 seats on the new council.

10:29pm – I’ve avoided the results for council for Fairfield, Penrith and Lake Macquarie because they require some data entry to make sense. Let’s now look at Penrith.

In 2012, Liberal independents won six seats, while Labor won four, out of a total of fifteen. Labor appears to have gained an extra seat in all three wards, giving them a total of seven. The Liberal Party has held on to five of their seats. Independents Jim Aitken and Marcus Cornish (an ex-Liberal) have also held on to their seats. The last seat in the north ward is a race between second Liberal Glenn Gardiner (0.6861 quotas), sitting independent councillor Kevin Crameri (0.6824) with an outside shot for sitting Greens councillor Michelle Tormey (0.5461). So while Labor looks set to bounce back, they will need the support of Aitken, Cornish or possibly Crameri or Tormey to hold a majority,

10:13pm – In Liverpool, Labor’s Wendy Waller has extended her lead and looks likely to win. Labor and Liberal will each win two seats in each of the two wards, along with the Liverpool Community Independents Team winning a seat in each ward. If Waller wins the mayoralty, this leaves Labor one seat short of a majority. This is similar to the situation from 2008 until 2012, when Labor held the mayoralty but a coalition of Liberals and three independents effectively ran the shop. The LCIT held the balance of power in 2008-12 and favoured the Liberals, but their incumbent councillor has fallen out with the Liberals in the last term.

10:03pm – Let’s look at Blue Mountains. Labor has won 5 seats, the Liberal Party has won at least three, along with one independent and one Green. In Ward 2, the last two seats are in play. Labor is on 1.5 quotas, while the Liberal Party and independent Rob Thompson are both around 0.86 quotas. The Greens trail on 0.74 quotas. If the Greens have benefited from preferences, they have a chance of overtaking the Liberal or Thompson.

9:58pm – I’ve got some requests for information about other councils. In Camden, the Liberal Party won five seats in 2012, alongside four independents. This was the first time the Liberal Party had run a solid campaign. This time Labor has joined them, and Camden looks set to become another partisan council. The Liberal Party is on track for four seats, along with three Labor and two independents: Eva Campbell and Scott Metcalfe. CORRECTION: most of the votes for Metcalfe’s ticket are votes for his running mate Robert Mills below the line, so Mills looks likely to win.

9:49pm – I haven’t had time to look at other results going on. The Northern Star has good coverage of the results in the north coast, and regular commenter Nick Casmirri has been tweeting a variety of results.

9:39pm – Looking at the council results for the City of Sydney, Clover Moore appears to have won her largest council majority. With about 14% of the vote counted, Moore’s team has won at least five seats, with Liberal and Labor each winning a seat. The last two seats appear to be a race between Moore’s sixth candidate, the second Liberal and independent Angela Vithoulkas. Ex-Liberal Edward Mandla (running second on Vithoulkas’ ticket) has lost his seat and the Greens appear to have lost their seat after three terms on the council.

9:22pm – Let’s look at Sutherland Shire. It looks like the Liberal Party has lost their majority, and will need to work with independent Steve Simpson, who was a Liberal prior to losing preselection before this election. The Liberal Party won nine out of fifteen seats in 2012, and that increased to eleven during the last term. The A and C wards have cleanly split as 2 Liberal, 1 Labor. Labor has won two out of three in D ward. In B ward, the second Labor candidate is narrowly behind the second Liberal for the final seat, but there is 12.6% of the vote in Greens preferences, so that will likely see Labor win. That would give Labor and Liberal 6 seats each.

In E ward, the Liberal Party and independent ex-Liberal Steve Simpson have both won a seat, with the final seat a race between Labor and the last remaining Shire Watch independent Peter Towell. This looks likely to give us a council of seven Liberals, six-seven Labor, one ex-Liberal independent and possibly one other independent. In this situation, the Liberal Party would need to work with Simpson to govern.

8:40pm – Labor is clearly on track to win a majority on Blacktown council, possibly with as many as ten out of fifteen seats. In Ward 1 (currently represented by 2 Liberals and 1 Labor), the second Labor is about 3% ahead of the second Liberal for the last seat. That would be one seat gain. In Ward 2 (also covered by 2 Liberals and 1 Labor), the Liberal Party is down to just 1.1 quotas, with Labor leading for the last seat with 1.6 quotas. In the third ward, Labor is on almost two quotas, with the first Liberal and independent Russ Dickens competing for the final seat. In Ward 4, Labor is well over two quotas, with the Liberal Party on one. This leaves independent ex-Liberal Jacqueline Donaldson stranded on just over 30% of a quota. If these results hold, Labor will hold ten seats and the Liberal Party five.

8:17pm – Labor is solidifying their hold on the Lake Macquarie mayoralty. Labor’s Kay Fraser is on 45.25% (up 12.4%), ahead of the ILA’s Laurie Coghlan on 20% (down 5.5%) and Liberal Jason Pauling on 19.95% (down 2.4%). We don’t know much about the council results, but this suggests Labor’s position will be stronger.

8:14pm – With roughly one quarter of the vote in for the Fairfield mayoral vote, Labor’s Del Bennett leads on 31.95%, followed by Labor-turned-independent mayor Frank Carbone on 28.3%, with Liberal-turned-independent councillor Dai Le on 17.2% and official Liberal candidate Joe Molluso on 12.4%. This means the two Liberals will decide which of the Labor candidates will win the mayoralty. Dai Le preferenced Carbone explicitly – the two candidates ran an integrated campaign with similar how-to-votes, and you’d expect her preferences to favour Carbone, making him the favourite. We won’t know a result tonight.

8:07pm – We have a very small sample from Campbelltown council – their council ballot is quite large and will take time to count, but it appears that the Labor vote is up substantially and the Liberal vote is down substantially, which will likely put Labor in a leading position in forming a majority coalition.

8:04pm – With 16% of the vote counted in the Liverpool mayoral race, the Liberal Party’s Tony Hadchiti is on 33.6% (a swing of over 10% away from the Liberal Party) while Labor’s Wendy Waller is on 36.7%, which is a swing of almost 7%. Not clear if that’s enough for Labor to win, but a big improvement. There was a jump in the vote for the Liverpool Community Independents Team candidate, up from 6% to 10%. We have very little from the council, but if those numbers are accurate the Liberal Party would be worried about losing a seat in each ward, plus the mayoralty.

8:00pm – Numbers are very small in the four other Blacktown wards, but in Ward 1 we have results from ten out of 19 ordinary booths. This is the best ward for the Liberal Party, and they hold two seats in the ward. There has been a 4% swing to Labor and away from the Liberal Party. The Liberal Party’s second candidate is on 0.74 quotas, just ahead of Labor’s second candidate on 0.63 quotas. If Labor can gain this seat and hold all their others, they will win a majority on the council.

7:52pm – So we have about 19.4% of enrolled votes cast so far in the City of Sydney and Clover Moore is on almost 59.4% of the primary vote. That’s a swing of over 8% towards Moore. The Liberal Party’s Christine Forster is on just under 17%, a swing of 1%. Labor’s Linda Scott is on 10%, which roughly what she got in 2012. Angela Vithoulkas’ vote is down from 9.8% to 7.9%. The Greens’ Lindsay Johnston is on 5.3%, which is down from 6.6% in 2012 and over 13% in 2008.

7:44pm – Apologies for the absence – I’ve just come from the Giants-Swans game and am now going to get into the results as we have them.

6:00pm – Polls have just closed. I’ll be joining you in about an hour to track the results in some of the biggest councils.


2

NSW council election day

Polls have just opened in those NSW councils holding elections today.

I won’t be blogging during the day, but will be doing some results coverage tonight. Feel free to use this post as an open thread.

I’ve written guides to the eight most populous councils. These councils are marked in blue on the below map, and if you click on a council you can click through to the guide. You can also access the guides from the menu at the top of the site.

0

Campbelltown City Council election – read the guide

Screen Shot 2016-09-02 at 10.04.20 amCampbelltown City is the eighth-most populous council up for election on Saturday, covering parts of south-western Sydney.

The council is elected as a single group, with 15 councillors representing the whole city. This makes the result very proportional and has allowed a block of independents to each win election at multiple elections thanks to a low vote spread across the council.

Labor has traditionally governed Campbelltown in alliance with a small number of independents, with Labor and independents alternating in holding the mayoral office from at least 1991 until 2012. The 2012 election was a difficult result for Labor, who were reduced to one third of seats on the council. The four Liberal councillors allied with three independents and the sole Liberal Democrat councillor to form a new alliance, and they have locked Labor out of power for the last four years.

It seems likely that Labor will regain control in 2016, likely in alliance with independents and possibly a Greens councillor, but the Liberal Party is a much stronger presence in Campbelltown than they were in past decades.

Read more

0

Penrith council election – read the guide

Screen Shot 2016-08-31 at 10.11.44 amThe Liberal Party chose not to endorse an official ticket for Penrith City Council in 2012, but Liberals managed to win six seats on unofficial Liberal tickets. Labor managed four seats, along with three independents, and one seat each for the Greens and Australia First.

The Liberal Party governed the council in alliance with two independents from 2008 until 2014, when the alliance broke down. For the last two years, the mayoralty has been shared between the two major parties.

Labor will be hoping to rebound in Penrith in 2016, but they are a long way away from a clear majority on the council.

Read more

0

City of Sydney council election – read the guide

Screen Shot 2016-08-29 at 9.56.12 pmThe City of Sydney is the only council in central Sydney going to the polls this September, and it should be a contentious battle for control of Town Hall.

Independent lord mayor Clover Moore is running for a fourth term, with conservative candidates running a big campaign to defeat Moore. A change to the voting system will massively increase the number of business votes, but Moore should be able to win a decent share of the business vote which may help her hold on in the mayoral election.

While Moore remains the favourite to win the mayoralty, it’s hard to see her alliance of independents maintaining a majority on the council, which may force Moore to rely on Labor and Greens councillors to govern the council.

Read more

0

Liverpool council election – read the guide

liverpoolLiverpool council has traditionally leaned to Labor, but the Liberal Party managed to win half the council seats and the mayoralty in 2012.

Liberal mayor Ned Mannoun had a tumultuous four years in office, ending with an ICAC raid and a council motion prohibiting him from speaking on behalf of the council. Mannoun was denied Liberal preselection for the mayoralty at the election.

It seems likely that the Labor Party will regain seats from the Liberal Party in 2016, but it’s unclear whether they’ll be able to gain enough ground to regain control of the council.

Read more