Posts By Michael Taft

bins

Bin Charges: From Private Circus to Public Service

, , Comment Closed

The bin charges debacle is spiralling into chaos.  We have areas where two or three or four bin companies operate and other areas where companies are threatening to leave; escalating charges becoming an intolerable burden on many low-income households; considerable price variations between counties; off-shored private companies pursuing wage suppression to increase profits; considerable illegal dumping; charges for recycling which dis-incentivises a social good; and on and on.  This is not a waste management policy; it is a circus.

The Minister is set to introduce a freeze on bin charges which would at least give us some breathing space.   The following sets out an alternative outline to waste management.  This is not a hard proposal; others will come up with better ideas.  However, it is clear that the current situation is not sustainable – from an environmental, economic, and social perspective.

1.    A Public Service

Waste collection should be a public service.  In the late 19th century great strides in public health came from water, sewerage and waste collection services; all provided as a public good.  We should return to this principle.  This does not necessarily mean that waste collection would be provided directly by the local authority or some other public agency (but it could – see below).  However, rather than relying on market-forces to provide the service or set the charges, local authorities should re-assert active management and control of waste collection.

Read Post →

ulsea2

Warning: Ultra-Low Spend Economy Ahead

, , Comment Closed

We are potentially heading down a dangerous stretch of road ahead –leading us into the Ultra-Low spend zone.  In this zone, investment declines and, so competitiveness and productivity; health and education services suffer; income supports falter adding fuel to the inequality engine.  A low-service, low-waged, low-productivity future awaits.

Of course, spending a lot of money doesn’t guarantee you optimal results.  But spending too little certainly won’t get you optimal results.  So how far behind are we falling?  Let’s compare public spending (excluding interest – this is called ‘primary’ expenditure) in the EU-15 countries.

I’ll use the method devised by Seamus Coffey who hangs out at Economic-Incentives.  He excluded elderly-related expenditure and then compared Ireland with the rest of Europe.  He did this because Ireland has an advantage here – we don’t have to spend as much on pensions and related expenditure because we have a smaller proportion of elderly.  In the EU-15, the over 65 cohort makes up 19 percent of the population; in Ireland, this cohort makes up 13 percent. 

2014 is the latest year we have data for old-age expenditure.  In the following, old-age expenditure is subtracted from total primary spending.  For instance, Ireland spent 37.2 percent of its adjusted GDP (adjusted per the Irish Fiscal Council’s hybrid-GDP estimate that factors in the accounting practices of multi-nationals).  It spent 4 percent on the elderly, leaving an expenditure level of 33.2 percent excluding elderly-related spending.  Figures for European categories are mean averages. 

PS1

Ireland ranks below all the European averages.  What difference would it have made in 2014 in actual Euros and cents?

  • To reach the average of other EU-15 countries, we would have had to increase public spending by €6.5 billion
  • The next comparison is with other Northern and Central European economies (other NCEE). This is the EU-15 excluding the poorer Mediterranean countries like Greece and Portugal.   To reach this average, we would have had to spend an additional €9.6 billion.
  • The final comparison is with Other Small Open Economies, a category used by the IMF. These are economies with a small domestic market and a high reliance on exports.  Austria, Belgium, Denmark, Finland and Sweden are in this category.  This is arguably our peer group.  To reach this average we would have had to spend an additional €15.5 billion.

[Note:  some will say that defence spending should also be factored in as other European countries spend more than us.  This is true.  In the EU-15, defence spending makes up approximately 1.3 percent of GDP; it’s 0.4 percent in Ireland.  In any event, defence spending is a policy choice and, in my opinion, shouldn’t be excluded from comparisons.  But if you insist, knock off about €1.5 billion off the numbers above.]

In 2014, it could be argued that we are already a low-spend economy but as I wrote here, the situation could actually be worse.  I have reservations about Seamus’s method.  Excluding old age expenditure not only removes the demographic driven part of overall spending, it removes policy choices.  Most other EU-15 countries spend more on elderly per capita than we do.  Second, if we are to adjust for the elderly population, then we should also adjust for youth demographics.  In Ireland, under-20s make up 28 percent of the population, compared to 21 percent in the EU-15. 

Read Post →

its-time-to-get-realz

Time to Get Real

, , Comment Closed

The Stability Programme Update, the latest economic and fiscal projections, signals the start of the budgetary politics that will inform the next Government.  In particular, it shows the level of money available for the Government for spending increases and tax cuts.  Speaking in the Dail yesterday, the Finance Minister stated:

‘On foot of these changes, my Department currently estimates the net fiscal space to be somewhere in the region of €10 billion to €11 billion over the period 2017 to 2021.’

Remember all that stuff about the fiscal space during the election?  It was stated that there would be €8.6 billion available over the next five budgets.  This has been increased by approximately €2 billion due to changes in the complex calculations.   So, we have €10.5 billion.

 An extra €2 billion:  sound good?  Not really – not when you look at the detail.

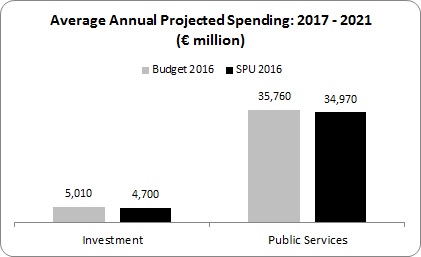
Let’s compare two main budgetary projections that were presented in Budget 2016 – only a few months ago – and the current projections published in the Stability Programme Update:  investment and expenditure on public services (Government consumption).

to1

Spending on investment and public services has been revised downwards in the current projections.  The differences may seem small but it puts the increased €2 billion in ‘fiscal space’ the Minister referred to in perspective. 

For instance, in the budget last year the Government projected investment spending over the five years to be €25 billion.  They have revised this downwards to €23.5 billion – a cut of 6.2 percent.  We’d have to increase investment by €1.5 billion just to get back to the projections in the budget – and that was already one of the lowest levels of investment in the EU. 

Regarding expenditure on public services, over the five years the Government has revised this downwards by nearly €4 billion.  Get the picture?  Now let’s factor in inflation (using the GDP deflator – unfortunately, we don’t have an inflation projection for public services). 

Read Post →

scambridge-protests-390x285

Turning Failure Into Hope

, , Comment Closed

The Sunday Business Post’s investigation into JobBridge was devastating.  The programme has been used to staff the HSE, Hewlett-Packard, public enterprises, supermarkets and universities.  A large number of interns report frustrations, especially as they have almost no workplace rights, while the investigation showed a scheme that grew out of control lacking robust monitoring and compliance mechanisms. 

It’s time JobBridge was closed down.  The youth section of Unite the Union has long campaign for its abolition; Impact has recently called for the programme to go.   It’s already being reduced.  The programme will be cut from €70 million last year to €51 million this year.  Cut the rest of it. 

And let’s use the money to create a real programme of work, targeted at people who are having a hard time in the market.  Long-term unemployment can be a dismal experience.  The longer you are out of work, the more difficult it can be to get back in:  your current skills may be become degraded, previous work routines are undermine, there can be mental health issues, you get stuck so far into a rut that it is difficult to pull yourself out.  Training programmes work best when the person is motivated and there is a belief that a job is possible at the other end.  Long-term unemployment is the ultimate de-motivating experience, leaving people with little hope.

In 2015, long-term unemployment (without a job for more than a year) averaged 114,000.  That amounts to 5.3 percent of the labour force.  By contrast, long-term unemployment in the EU-15 makes up 4.7 percent.  

When we turn to what can be called ‘chronic’ long-term unemployment – two years and longer – we find, on average, 83,000 stuck in this situation and, of this, 50,000 have been unemployed for four years or longer.

So let’s redirect the resources – approximately €85 million – from the JobBridge and Gateway programme) into a guaranteed real job programme.  In other words, the state should become an employer of last resort; when people cannot find work in the labour market, the state will provide that work.  What would such a programme look like?

Read Post →

3_MT3

Ask the Right Questions

, , Comment Closed

The National Competitiveness Council (NCC) has released its latest Cost of Doing Business in Ireland.  It is always an interesting compilation of graphs, charts and statistics that compare Irish competitiveness against other countries.    The current release has been accompanied with a media bustle about ‘high-cost’ Ireland.  This, of course, has long been the case.  The NCC lists a number of culprits:  transport, utilities, credit and childcare.

And what would a ‘competitiveness’ review be without mentioning ‘labour costs’ (I think they mean ‘employee compensation’ which is not a cost but I’ll let that go for now).  Once again, the NCC has produced a misleading picture about labour cost trends. This has resulted in media reports referring to the ‘high cost’ of wages.  The NCC has even produced a graph to give the appearance that labour costs have been rising faster than the Eurozone average. I reproduce the graph below.

1_MT

You might think, from a first glance, that since 2010 Irish workers have been getting pay rises that exceed the Eurozone average.  The general picture is that, while wages fell between 2007 and 2010, since then they have been rising at a pretty swift pace.  Thus, we have to watch out; otherwise our wage levels will become ‘uncompetitive’.  Thus, we have to be more moderate, or ‘sustainable’.

The only problem with this picture is that it is wrong and misleading.  The NCC graph is based on the data from Eurostat’s Quarterly Labour cost index which can be accessed here (it would be helpful if the NCC actually sourced the data source and not just the agency that produced the data).  In this dataset, you can choose different types of measurement.  I’m assuming the NCC is using the ‘percentage change compared to same period in previous year’ not seasonally adjusted (it works in some respects). 

The measurement that the NCC uses tells you what it tells you but, at the same time, it can distort the picture.  Here is an example.  Let’s say that wages fall by 1 percent in year-on-year quarter.  Then the next quarter it falls by 0.5 percent.  Well, you’d say that wages are still falling though at a slower rate– and you’d be correct.  However, using way the NCC measures it, it would show wages rising since the ½ percent fall is less than a 1 percent.  This is the stuff of statistical battles.

Read Post →

twt

Victory to all Retail Workers

, , Comment Closed

Workers at Tesco’s have voted overwhelmingly for industrial action to resist the proposed wage cuts that management is demanding.  The issue is now going to the Workplace Relation Commission.  This post is not about the details of the Tesco dispute (you can read about it here).  However, it is timely to take a step back and look at wages that not only Tesco but all retail workers earn.  And when you sneak that peak you will find that retail workers in Ireland are some of the poorest paid in the EU-15. 

12345

According to Eurostat (the baseline figures are from 2012, brought up to 2014 with the Labour Cost Index), Irish retail workers rank 12th in the EU-15.  And these wages are well behind European averages.

  • Irish retail workers would need a 20 percent increase to reach the EU-15 average.

But when we compare Ireland with our peer group, the comparison deteriorates dramatically.  One peer group are Northern and Central European economies (NCEE).  This is the EU-15 figure excluding the poorer Mediterranean countries (though it’s worth noting that Italian retail workers earn more than Irish).  In this comparison:

  • Irish retail workers would need a 35 percent increase in the hourly average wage.

A second peer group is other Small Open Economies (other SOE).  This is a comparison used by the IMF and it refers to economies with small domestic markets and a high reliance on exports, just like Ireland.   This category includes Austria, Belgium, Denmark, Finland and Sweden.  In this comparison:

  • Irish retail workers would need a 54 percent increase in the hourly average wage.

Some may object to this, claiming that if a company is not profitable, it cannot increase wages.  This is true enough.  But we are confronted with a problem:  the last year we have comparative enterprise data in the retail sector is 2012 – a bottom point in the retail business cycle with the economy still mired in a domestic demand sector.  Although profits per employed was about 15 percent below the EU-15, profits in the foreign-owned sector (such as Tesco) was the highest in the EU-15.  So even with the consumer economy at rock bottom, a substantial part of the retail sector was doing ok.

Read Post →

beaker-512

The Experimenting Government

, , Comment Closed

We will soon have a government.  What kind will it be?  Time and a Programme for Government will tell.  But what we really need is an experimenting government; one that uses resources and creativity to experiment with different proposals.  There are many good ideas out there but it is hard to know how they might impact on the economy and society were they introduced in one go.  Commissions, green papers and studies can only tell you so much.  We should experiment – trialling ideas for a limited period in different contexts and sectors.  We can then assess the results to see if they are runners.  Here are a few examples.

1.    Shorter Working Week

I wrote about this here.  In Sweden a number of trials are being conducted to assess the impact of a shorter working week in terms of cost, productivity, firm or agency performance, customer satisfaction and the health and well-being of the employees.  Why not trial it here?  We could select public and private sector workplaces to run 18-24 month experiments in reducing the working day.  A study of productivity and all other elements would be done before and after the trial period and the results made public for study and debate.

2.    Basic Income

Basic Income – a guaranteed payment to everyone regardless of employment status – is attracting more attention and discussion.  Arguments centre around a new era of reduced formal work opportunities, the growing complexity of welfare states, strengthening workers’ bargaining power (if I have a living income to fall back on, I can walk away from the boss’s grief), etc.

But there are downsides:  the high cost of implementation, inflation, unknown impact on the labour market.  This is complicated by right-wing arguments that with Basic Income we can abolish the welfare state and minimum wages. 

It is unlikely that a Government would introduce Basic Income all at once, or across the board.  If it didn’t work out it would be very expensive to undo the policies and repair the damage.  However, some places are conducting experiments – for instance,Utrecht and other Dutch cities.  It will be limited to a certain cohort but the hope is to discover how it changes people’s behaviour and what the fiscal and bureaucratic impact would be.  So why don’t we do the same thing – we could model it on the Dutch experiments so we don’t have to re-invent the wheel.  It could be run out in urban and rural areas for a time-limited period with the effects to be studied afterwards.

3.    Labour-Managed Enterprises

There has been increased academic interest in the performance of labour-managed enterprises (workers’ cooperatives, employee-ownership and other models).  While extremely limited in Ireland, there are a considerable number operating in other countries – notably France, Spain and Italy – throughout the industrial and service sectors.  Proponents argue that such enterprises increase productivity and firm performance while generating higher investment and reduced wage inequality. 

Here is an opportunity to run a trial programme – through Enterprise Ireland, local enterprise boards or a new agency if that is seen a better fit.  It would provide funding and training, and work with firms that are closing down due to poor performance or owner-retirement as well as greenfield start-ups.  This experiment would take time – a firm may survive the first and even second year but could fold soon afterwards.  However, this could be an on-going process, with periodic reports and analysis.  This shouldn’t be too contentious – after all, it is about generating indigenous enterprises and putting people back to work.  What we might find is that labour-managed firms are a better route to those goals, with positive spill-over effects in the community.

Read Post →

landsdown_rd

Open Season on Public Sector Pay (Again)

, , 1 Comment

It’s starting.  When the penny drops and the incoming Government finds there is less money in the kitty than their manifesto promises were based on, the scramble for scarce resources will be on.  And the scramble to have a go at public sector workers – that will be on, too.  This from management consultant Eddie Molloy in the Sunday Business Post (behind a paywall):

‘That (the Lansdowne Road Agreement) was clearly a sweetener with the prospect of an election ahead.  Before disability, homelessness, flooding or anything else got a look in, a big chunk of the available funds had already been given away.  The government chose pay restoration over services restoration.’

Ah, c’mon; public sector workers – in particular, the low-paid (the Lansdowne Road Agreement gave these workers an additional boost) – took from the disabled and the homeless?  Interesting that Molloy didn’t write: ‘The Government chose tax breaks for high income groups over services restoration’ or ‘massive subsidies to the corporate sector over services restoration.’   No, just public sector workers.   This is the type of argument we’re going to get – and it will probably get even more extreme.

Colm McCarthy, too, is not too keen about public sector pay increases.  But at least his argument is one that can be engaged with.  He rightly states that there’s little fiscal space; that’s probably an overstatement.  He goes on to say:

‘Should a government be formed, an immediate priority should be to inject some reality into the discussions about public service pay. Are public servants poorly paid, relative to those in the private sector and in comparable public employment in the UK and elsewhere? The best way to compare, taking account of pensions and job security, would be a thorough benchmarking exercise, done openly and with all details published.’

Ok, let’s throw some reality into this discussion.

First, let’s measure public sector pay (employee compensation) as a percentage of GDP.  For Ireland, I use the Irish Fiscal Council’s hybrid-GDP measurement, a compromise between GDP and GNP.

PS Pay 1

Ireland is well into the bottom half of the table, below the average of other countries.  It should be noted that in some countries like Germany not all public sector pay is on the books.  For instance, in the public health system, public sector pay is off-the-books, courtesy of quasi-public corporations (money spent is categorised in different ways). 

It should also be noted that according to the Irish Government, public sector pay will fall from 9.8 percent in 2016 to 8.4 percent by 2021 (using the hybrid-measurement).  And that’s including the full cost of the Lansdowne Road Agreement. 

Read Post →

underpaid

Are We Getting a Fair Deal?

, , Comment Closed

With all the talk about industrial action and wage claims and wage offers and summer of discontent, etc. etc. etc. it is worth taking a step back and to look at the big picture.  Are Irish workers paid too much in comparison with other EU-15 countries?   This blog written by the Director of the Nevin Economic Research Institute, Dr. Tom Healy, looks at the adjusted wage share in the economy.  That’s one way of measuring wages – and it shows Ireland performing pretty badly in comparison. 

Here I am going to approach this issue by quantifying the proportion of the economy that goes on wages.  But whenever you go down this route you are faced with a big question.  Do we use GDP which is inflated by multi-national profits which are not generated here but are imported to take advantage of our corporate tax regime?  Do we use GNP even though this is also inadequate as it excludes actual productive activity?  Or do we use the Irish Fiscal Advisory Council’s hybrid-GDP which attempts to measure our actual economic or fiscal capacity?

Let’s take a cautious, conservative approach and use GNP.  In terms of EU comparisons this means using Gross National Income (GNI) which is essentially GNP including payments from the EU (CAP funding, etc.).  When we do this we find Irish workers, collectively, are paid a small percentage relative to workers in other EU countries.

TEC1

The EU Commission’s AMECO database estimates for 2016 finds that Irish employee compensation is near the bottom of the EU-15 table.  Employee compensation combines both wages and employer social insurance contributions; this is the standard measurement of wages and, as such, can be taken as a very close proxy to ‘labour costs’.  

Throughout the EU-15, wages make up 48 percent of GNI.  In Ireland compensation makes up only 40 percent – equal to Italy and ahead of lowly Greece (if we used GDP or the Fiscal Council’s hybrid-GDP, the percentage would be even lower).

What would happen if Irish wages rose to the average EU-15 level?

  • Total wages would rise by €15.4 billion, or 20 percent more than today.
  • That is the equivalent of €9,400 per Irish employee.

Of course, economies and wages are never so simple; therefore, you can’t run a slide-rule over gross numbers and extrapolate an optimal wage figure.  Much depends on the bargaining power of workers vis-à-vis employers, the position in the business cycle, the sectoral structure of the economy (high-tech?  medium-tech?), compositional effect, productivity levels, etc.  However, we can’t get away from the fact that Irish wages take up far less of Gross National Income than in almost all other EU-15 countries.

Read Post →

LivingStandards3

Its All About Living Standards

, , Comment Closed

Following on from my recent blog about the squeezed middle which showed that middle income groups received less than the national share of income than the EU-15 average (due to high income groups taking more) it might be worth having a look at general living standards in comparison with other European countries. This is about living standards, not just income.

Eurostat measures living standards through actual individual consumption. Unlike private consumption (i.e. consumer spending) actual individual consumption

‘ . . . encompasses consumer goods and services purchased directly by households, as well as services provided by non-profit institutions and the government for individual consumption (e.g., health and education services).’

It, therefore, measures consumption not only of goods and services, but public services provided by the government. As Eurostat states:

‘Although GDP per capita is an important and widely used indicator of countries’ level of economic welfare, (actual individual) consumption per capita may be more useful for comparing the relative welfare of consumers across various countries.’

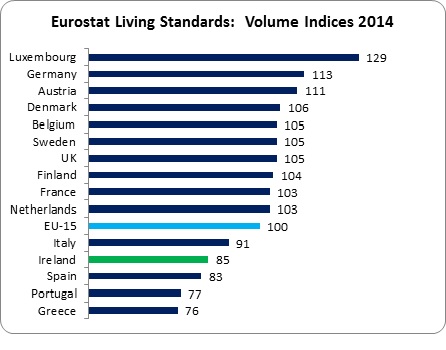
In short, actual individual consumption can be treated a proxy for living standards. So what is the relative welfare of consumers (i.e. everyone) across Europe? The following captures the relationship of real (after inflation) living standards in purchasing power parities between al l EU-15 countries and the EU-15 average.

LivingStandards1

We can see that Ireland is in the bottom half of the table – 15 percent below the average. Our living standards are closer to Greece and Portugal than it is to the EU-15 average and the majority of countries.

Read Post →

crisis

Over Crisis-ed and Under-Paid

, , Comment Closed

We have a housing crisis, a homeless crisis, a health crisis, an investment crisis; our education system is under-resourced, our indigenous enterprise sector is out to lunch and the Dail can’t seem to put together a government.

And if all that wasn’t bad enough, we are under-paid.

Some new data regarding employee compensation and wage levels in Europe has come on stream. Here we will review the headline figures. Over the next few weeks we’ll get into the detail.

First up is a comparison of employee compensation. Employee compensation combines both the direct wage the employer pays you and the social wage which the employer pays to a social insurance fund that allows you access to income supports and public services (e.g. health). This is the standard measurement of workers’ wages, used by the CSO, Eurostat, OECD, etc. So at a total-economy level, how do we compare with other EU-15 countries?

Underpaid 1

There’s Ireland – below the EU-15 average and in 10th place, only ahead of low-pay UK and the poorer Mediterranean countries (the data can be found here and here.   To get to the EU-15 average we’d need an increase of 6 percent – but we’d still be in a lowly 10th place.

However, when we look at other central and northern European countries (removing the four peripheral Mediterranean countries), we fall well behind. We’d need an increase of 18 percent.

Employee compensation is not equal to ‘labour costs’ (I really hate that value-laden term). In some other countries, employers pay higher payroll taxes than just employee compensation. For instance, in Sweden, employers pay a social wage (social insurance) of 17 percent of the workers’ wage. However, they also pay an additional 12 percent in other payroll taxes – money that can go into public services and income supports not related to social insurance. In Austria, employers pay 17 percent in social wage and another 7 percent in payroll taxes. In Ireland, employers pay 8 percent social wage and another 0.5 percent in payroll taxes.


Read Post →

luas

Un-Squeezing the Middle

, , Comment Closed

Seamus Coffey has been digging up some numbers which he self- deprecatingly refers to as one more ‘silly addition’ to what can be done with income distribution statistic. But silly they are not. They give insight into another aspect of Ireland’s income structure.

When we debate income distribution we usually do so through the prism of the relationship between the ‘top’ and ‘bottom’ income groups or the Gini co-efficient. What Seamus looks at are the fortunes of the middle income group and specifically compares Ireland with Sweden in the middle deciles (a decile represents 10 percent of the population). I reproduce Seamus’s table below but if it is difficult to read you can access it here.

Squeezed Middle 3

The numbers measure the percentage of ‘equivalised income’ each decile receives (equivalised factors in household size). In the table we see that in green Ireland, the lowest 10 percent income group receives 3.2 percent of all income; the top 10 percent receives 24.4 percent – or nearly a quarter of all income. Regardless of the magnitude, there is nothing surprising in this. Top income groups take more than low-income groups.

However, Seamus points us to the middle of the decile group – what has been described in the debate as the ‘squeezed middle’ and compares us to blue Sweden. There is a huge gap between the two countries in these middle deciles – 4th to 7th. Indeed, if Irish squeezed middle households took as much of a percentage of total income as Swedish middle decile households, each Irish household would be, on average, €5,000 better off according to Seamus. That’s a tidy sum.

Using the Eurostat data here is my own take. Rather than compare Ireland to Sweden (Sweden is pretty egalitarian but they’ve been at it for decades), I compare Ireland with the average of our peer group – other small open economies: Austria, Belgium, Denmark, Finland and Sweden. And since I’ve used the middle 60 percent in the past I’ll keep to that and calculate the income for households in the 3rd to 8th decile. That’s a bigger middle.

Squeezed Middle 1

Ireland’s low and middle income groups are below the share of those same groups in the other small open economies. However the Irish top 20 percent group take considerably more than their counterparts in the other five countries. What does this mean in Euros? If Ireland had the same share of disposable income:

  • Households in the lower income group would receive, on average, an extra €2,200.
  • Households in the middle income group would receive, on average, an extra €2,300.
  • Households in the high income groups would, however, lose on average €9,100.

In small open economies, low and average income groups make more at the expense of their high income groups.

Read Post →

posters

The Economy is What Happens When You’re Busy Making Election Plans

, , Comment Closed

An interesting piece of information came out from the CSO last week, three days before polling day. It showed increases in employment falling to a trickle. Are we seeing a new pattern emerging or just a short-term blip on the long road to full employment? Let’s look at the trend.

notf1

There are a couple of points to make here.

First, a significant part of the big increase during 2013 is likely to have been statistical (I discussed this here). During this period the CSO was making adjustments to its sampling base and specifically warned against interpreting trends. Employment increased phenomenally during this period even though we were still in a domestic demand recession which is be a big strange. Once the CSO ended their adjustments employment increases fell to almost nil – one more suggestion that the 2013 surge has to be treated cautiously. This is more than just a historical point; it may go some way in explaining why people weren’t feeling the recovery – because tens of thousands of jobs were only created on paper.

After 2013, employment statistics are more robust. It started off slow and rose to 16,000 jobs created in the second quarter of last year. But now we come to the second point.

In in the second half of last year employment increases slowed substantially. In the last quarter in 2015, employment rose by less than 5,000 – nearly two-thirds down on what was happening only six months previously. In the first half of 2015 employment rose by 30,000; in the second, 12,000. That’s a considerable deceleration.

How do we explain this? As mentioned, it could be a blip – one has to look at the long-term trend. Or we could be seeing pent-up demand coming through in 2014 as the economy burst out of a lengthy period of recession and stagnation. As the economy settles down – the Government expects GDP growth to slow considerably in a couple of years – so will employment. Are we seeing the beginning of those trends?

Read Post →

bridWin

After the Votes

, , 1 Comment

So what’s it going to be? Coalition? Minority Government? Extended stalemate?  What we do know is that support for the Government collapsed – by over half. Labour’s decline was anticipated, Fine Gael’s wasn’t – at least not in the pre-election polls.

We also witnessed Fianna Fail’s significant advance with a 40 percent increase in their first preference vote, winning an additional 25 seats.

In the new Dail Fine Gael and Fianna Fail look set to take 94 seats (at the time of this writing). In 2011 they won 95 seats. However, this is a smaller Dail. In percentage terms, the two conservative parties won 57.2 percent of seats in the 2011 Dail; now they won 59.5 percent. The conservative vote didn’t fall; it just swapped between the two parties. And this doesn’t count the increase in conservative and gene-pool TDs who look to increase from six to eleven seats.

Progressive parties and independents put in a credible performance. However, the breakthrough that many were hoping for (including me) didn’t come. Sinn Fein increased their popular vote by 3.9 percentage points with the AAA-PbP increasing by 1.5 percentage points. Combined, these two parties look set to gain 13 seats at the time of this writing – positive but about half the Fianna Fail increase. The Social Democrats took three percent but couldn’t increase on their outgoing total while the Greens are back in parliament with two seats. However, the number of progressive independent TDs doesn’t appear to be increasing of this writing.

So where next for progressives? Much will depend on the formation of government and potentially an election in the short-term. But for the medium-term here are a few suggestions.

1.    Start an Honest Conversation

In policy terms, wipe the slate clean. One of the messages coming out of the election was that people didn’t believe the promises to cut taxes, increase public spending and establish fiscal stability. Rightly so. There is little fiscal space – far less than parties claimed. The future is extremely uncertain: low Eurozone growth, interest rates, oil prices, currency movements, the stability or otherwise of the European banking system. Then there’s the question of the character of the recovery (how much real, how much statistical). And what about Ireland’s continuing and unsustainable reliance on a corporate tax regime which works at the expense of other countries. Start an honest conversation about the challenges we face over the next decade – and don’t be surprise how many people will thank us for it.

Read Post →