
 A post I wrote a little over two years ago concluded that solar PV capacity factors in the US ranged between 13% and 19% with an average of around 16%. Recently, however, the US Energy Information Agency published a table showing an average capacity factor of around 28% for utility-sized PV plants in the US in 2015. This post looks into the reasons for this large difference and also addresses the question of whether the EIA estimates can be used to predict future US solar PV output.
Continue reading
 This is the last in my mini-series on global nuclear power. There are 441 reactors operational world wide today with an average age of 29.3 years. The current fleet is ageing. The oldest reactors in service today are 47 years old. By assuming that reactors will close aged 50 and by making simple assumptions about the commissioning of reactors under construction and those planned I estimate that come 2036 the fleet will comprise 424 units. The number is slightly down on today but the increase in mean power rating suggests that installed capacity will increase by about 25%.
 The UN Food and Agriculture Organization claims that global warming is having negative impacts on world food production, and since 2016 is widely expected to be the hottest year yet we would expect to see at least some evidence of this in 2016 crop yields. This week’s Blowout therefore takes pleasure in featuring the world’s bumper 2016 wheat harvest, which was largely a result of “benign weather” in most of the major wheat-producing countries:
 While governments fixate on cutting emissions from the electricity sector, the larger problem of cutting emissions from the non-electricity sector is generally ignored. In this post I present data from the G20 countries, which between them consume 80% of the world’s energy, summarizing the present situation. The results show that the G20 countries obtain only 41.5% of their total energy from electricity and the remaining 58.5% dominantly from oil, coal and gas consumed in the non-electric sector (transportation, industrial processes, heating etc). So even if they eventually succeed in obtaining all their electricity from low-carbon sources they would still be getting more than half their energy from high-carbon sources if no progress is made in decarbonizing their non-electric sectors.
 This week’s Blowout focuses on the “formal commitment” of Presidents Xi of China and Obama of the U.S. to the Paris Climate Accord. Xi may be in a position to commit China but it’s questionable whether Obama has the ability to commit the U.S. without congressional approval. The last time the U.S. signed a major climate accord (Kyoto in 1997) it was promptly and unanimously repudiated by the U.S. Senate:
 World total liquids bounced by a further 790,000 bpd in July partly on the back of continued recovery in Canada. Total liquids now stand at 97.01 Mbpd, down a meagre 70,000 bpd since July 2015.
 This week we return to the shaky state of UK energy security, with Barclays projecting that an investment of £215bn by 2030, which presently is nowhere to be seen, will be needed to decarbonize the electricity sector while keeping the lights on.
 Enno Peters maintains a web site called
  This week’s Blowout features the arrival within the next few weeks of the first of many shiploads of US fracked shale gas scheduled to be delivered to Scotland, which fracking supporters hope will “undermine arguments against fracking for shale gas in Scotland’s central belt”. The SHALE GAS FOR PROGRESS painted on the ships’ sides alone (inset) will be like a red rag to a bull to the anti-frackers, so prepare for protests:
 A
A  A smart grid is a computerized management system designed to distribute the power available to the grid in an efficient manner relative to demand while maintaining grid stability. It does not generate any power except in so far as it saves some energy that would be wasted with a less efficient system. Because of limited storage capacity a smart grid is also capable of maximizing energy use over only short periods; it will not solve the intermittency problem over longer ones. Consequently there will be extended periods over which the smart grid will have little or no renewable energy to deliver. Installation is also likely to be costly, and there are questions as to whether current designs based on computer simulations will work in practice.
 This week we return to Hinkley Point, where yet another potentially deal-breaking complication has arisen as a result of the US filing suit against the China General Nuclear Power Company – a 33.5% stakeholder in Hinkley – for nuclear espionage. China has warned that retaliatory measures may be taken if the UK now dumps Hinkley. So what happens next?
 Asking what it costs to produce a barrel of oil is rather like asking how long is a piece of string? The answer can be anything you want between $1 and $500. But of course the cost of producing oil in an ideal world should be well below the price of oil, leaving room for taxes and profits. The global oil market sets the price and producers need to adjust and adapt their strategies to maintain costs below prevailing prices from time to time. That is the theory at least.
 During July the hybrid wind-hydro Gorona del Viento (GdV) plant set a new record of 65.9% renewable energy delivered to the El Hierro grid, handily exceeding the previous record of 53.9% achieved in June. This was dominantly a result of a continuation of the sustained northerly winds that began in mid-June. Total renewables generation since full operations began at GdV in June 2015 is now 37.8%, up from 34.6% at the beginning of the month. (Data on GdV plant layout, operation and capacities are given in the
  This week we feature the Greenland ice sheet, buried in which is the abandoned Camp Century U.S. Army base, a relic of the Cold War. Camp Century still houses, among other things, a nuclear reactor. What happens when climate change removes the overlying ice and exposes the “serious pollutants” –presumably nuclear waste – that Camp Century reportedly contains?
 With Hinkley Point C and nuclear new-build in the UK very much in the public eye, I have found the range of nuclear options being discussed rather confusing. This post provides an overview of the 6 main reactor designs that are vying for the global market today focussing on the large, >1 GW Generation III reactors. While the post focusses on the UK, the part on generic designs should be of interest to all readers. [image from the “The Heroes of Telemark” a British – Norwegian raid during WWII aimed to prevent the Nazis gaining heavy water reactor technology. Or was it? Keep reading to CANDU to learn more.]
 Global total liquids bounced by +600,000 bpd in June as Canada partially recovered from the Fort McMurray wild fire and Saudi Arabia flexed its muscles raising production by 200,000 bpd compared with May.
Click to visit KiteGen
Donate to Energy Matters

Click to view advertisers' package

Leo Smith: Gridwatch
Click image to download live UK grid data
Clive Best: Live UK grid
EDF: UK nuclear status

El Hierro Live Grid

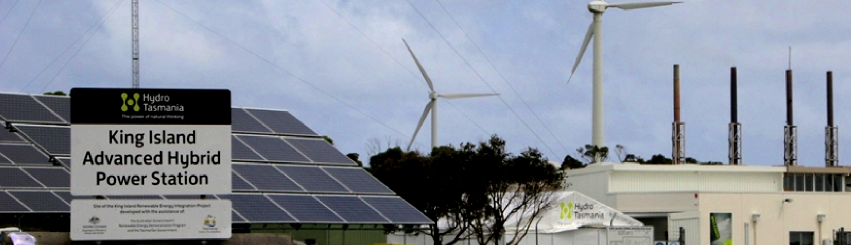
King Island Tasmania Live Grid
Germany live grid

-
Recent Posts
Recent Comments
- Greg Kaan on Solar PV capacity factors in the US – the EIA data
- Peter Lang on Solar PV capacity factors in the US – the EIA data
- Peter Lang on Solar PV capacity factors in the US – the EIA data
- Alex on Solar PV capacity factors in the US – the EIA data
- Alex on Solar PV capacity factors in the US – the EIA data
Archives
- September 2016
- August 2016
- July 2016
- June 2016
- May 2016
- April 2016
- March 2016
- February 2016
- January 2016
- December 2015
- November 2015
- October 2015
- September 2015
- August 2015
- July 2015
- June 2015
- May 2015
- April 2015
- March 2015
- February 2015
- January 2015
- December 2014
- November 2014
- October 2014
- September 2014
- August 2014
- July 2014
- June 2014
- May 2014
- April 2014
- March 2014
- February 2014
- January 2014
- December 2013
- November 2013
- October 2013
- September 2013
Categories
Education
Energy blogs
Energy news
Energy data
Climate blogs
Climate data
Oil Drummers
Energy Matters tag cloud
100% renewables blackouts bp ccs climate change CO2 co2 emissions coal DECC electricity el hierro energy policy energy security energy storage gas gdp germany global warming hinkley point iea ipcc iran iraq libya lto nuclear nuclear power oil oil price oil price crash opec renewables rig count roger andrews russia saudi arabia shale gas shale oil solar solar pv UK ukraine usa wind wind powerMeta
UK Wind Constraint Payments
The amount of UK wind that is constrained is growing with the level of penetration. At 10% wind penetration, 6% of the wind power available is constrained (Figure 9).
Continue reading →
Share this: