Imagico.de

blog

ounianga_crop1.ann

March 17, 2016
by chris
0 comments

Lakes of Ounianga

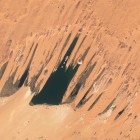
The Lakes of Ounianga are a unique and fairly remarkable feature of the Sahara desert. In the middle of the otherwise extremely dry desert of North-Eastern Chad there are a handful of lakes which are fed by fossile groundwater.

The two groups of lakes can be seen in this Sentinel-2 image from February. The lakes’ forms are shaped by the prevailing winds coming from the northeast and the resulting sand drift.

On the surface of many of the lakes layers of floating plants reduce evaporation and thereby help maintaining the lakes.

But since the groundwater feeding the lakes is not replenished in today’s dry climate and the same groundwater is quite excessively used for irrigation throughout the Sahara it is unclear how long these lakes will still exist.

Satellite images are based on Copernicus Sentinel data from 2016. A full size version is available on services.imagico.de.

LC80351162016068LGN00_expose.ann

March 12, 2016
by chris
0 comments

Bay of Whales 2016

Last year i showed an image from the Bay of Whales in Antarctica. Here is a newer Landsat image from the same area from approximately a year later.

And here is the same in direct comparison to the 2015 image showing how the ice changed.


The Ross ice shelf on the right moves about one kilometer per year at the outer edge changing the whole configuration significantly from year to year.

March 11, 2016
by chris
0 comments

Landsat and Sentinel-2 acquisition numbers

In my recent comparison of Landsat and Sentinel-2 as image data sources i mentioned the approximate number of images currently taken by those satellites every day. In reality this of course varies so i have put up a simple plot showing the recent scene numbers per day for Landsat 8, Landsat 7 and Sentinel-2.

These plots are based on data that is updated about every two hours – which might occasionally lead to a short delay when you request the page for the first time.

I would also have liked to show the actual daily coverage of the scenes counted in these plots. However as i already criticized for Sentinel-2 actual scene footprint data is hidden deeply in their file structure and difficult to access. More importantly it is also faulty in some cases, i.e. for scenes directly north of the Equator. This means there is no easy way to generate accurate Sentinel-2 coverage plots based on the ESA data without downloading all of the data at the moment.

That’s the thing with metadata – ESA provides tons of it but it seems they are not able to do proper quality assurance for that which seriously limits practical usefulness of course.

New simplified water polygons

February 28, 2016
by chris
0 comments

On slicing the world – news from openstreetmapdata.com

On openstreetmapdata.com Jochen and me provide daily updated processed OpenStreetMap coastline data for use in maps and elsewhere. It is used for example by the standard map on openstreetmap.org to provide an up-to-date rendering of the coastline. This data is available in a number of different forms:

  • land and water polygons – depending on what you want to do you might need either of them
  • as large polygons covering whole continents or split into smaller chunks easy to process
  • in the full resolution available in the OSM database or in a simplified version significantly reduced in data volume for more efficient rendering of map tiles for low zoom levels
  • in Mercator projection or in geographic coordinates

Not all combinations of these variants are available which mostly has good reasons:

  • The water polygons are only available in a split version since creating one giant polygon with an inner ring for every island on Earth might be theoretically possible but hardly any program would be able to process it.
  • The simplified version is only available in Mercator projection since it is only intended for rendering web maps at low zoom levels, not for anything else.

simplified water polygons

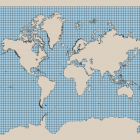
What we have not provided to date either are simplified water polygons in Mercator projection and this is one of the most frequent requests we get. Since many map styles use water polygons this is a frequent problem and many data users try to run ST_Simplify() on the full resolution water polygons which of course is a bad idea and leads to clearly visible problems because of the splits:


To properly simplify the coastline this needs to be done before splitting the polygons. We generate the new simplified water polygons by inverting the simplified land polygons. The method for doing this is similar to the approach we used for the Antarctic icesheet data. The tools for that are available as open source.

You can download the new simplified water polygon file on the water polygons page. A number of things should be kept in mind when using this data:

  • The polygons are split with minimal overlap. The normal split polygons have considerable overlap to prevent rendering artefacts with AGG renderers like Mapnik. This is not necessary here since the splits are pixel aligned at all zoom levels.
  • Do not try to reproject this data into other projections, it won’t work. If you need different projections use the data in geographic coordinates (see below).
  • The geometry should exactly match the simplified land polygons and is equally meant to be used for z=0-9.

When using either the simplified land or water polygons keep in mind: they are only meant for improving performance and reducing data volume at the low zoom levels. This should have no or a negligible visual effect. If you want a generalized version of the coastline data for a better readable map or more freedom in styling have a look at the generalized coastline data we offer as well.

split polygons for reprojection

Another problem we had is with the files in geographic coordinates. These are primarily meant for reprojection into other coordinate systems to produce maps in arbitrary projections. This however was normally only possible with the unsplit versions of the files since the splitting was done in a way that cannot generally be reprojected without causing gaps in the polygons at the splits.

To avoid this and to provide split polygons that can be reprojected we now generate an alternative splitting that can be reprojected without problems. You can find these temporarily on

http://data.openstreetmapdata.com/land-polygons-split-regular-4326.zip
http://data.openstreetmapdata.com/water-polygons-split-regular-4326.zip

We intend to replace the current split files in geographic coordinates with these in the long term so if there is anyone using the old files in ways where these new versions would not be a suitable replacement let us know.

These polygons are split in a 1×1 degree tiling and are produced with some overlap except of course at the 180-degree-meridian and at the poles. If your use depends on this overlap you will have to take special care of these areas like done in the following example from the south pole by dissolving these splits after reprojection.

coastline validity

Apart from these new features we have now moved to a new verification system to detect larger errors in the OpenStreetMap data before rolling out a new version of the files. As a reminder: the OSM coastline data is somewhat fragile and although OSMCoastline can fix a number of the most common errors automatically there are cases where automatic fixing does not work and we do not put up the broken data then to avoid maps and other applications using our files to get larger errors. Instead when a larger unfixable error is detected we do not make available the new broken data set but keep the previous one.

The check to detect larger errors is done by rasterizing the data and comparing the new land-water-mask with the old one. The new comparison technique based on gdal_maskcompare will be more systematic and predictable and errors everywhere on earth should be treated equally. We hope this will lead to less frequent lockups because larger edits are wrongly identified as errors as well as less situations where true errors like islands going missing because their coastline is damaged are not noticed. Of course all of this is no alternative to diligence and restraint on side of the mappers when making larger coastline changes. Recently there have been a lot of changes made in coastline tagging of larger lakes so our files could not be updated for more than a month – something like that will always lead to problems.

And finally – if you find this data useful or just enjoy having frequently updated coastlines on openstreetmap.org please contribute to the operation costs of openstreetmapdata.com or support us in other ways – the donation button is not there for decoration.
reef_980

February 20, 2016
by chris
0 comments

Reefs and beaches in the OpenStreetMap standard style

The latest version of the OpenStreetMap standard map style contains a change from me adding and improving rendering of some coastal features.

First it adds support for rendering areas tagged natural=reef using a blue dot pattern:

Reefs in OpenStreetMap are underwater features close to the surface that are either obstacles/hazards to navigation or areas of ecological or recreational value.

A frequent error in reef mapping in OpenStreetMap currently is that fringing reefs around islands are mapped across the islands and not around them. This is well visible in rendering now and can be easily fixed.

Since reefs are below water they are not always covered in the usual image sources. In principle however many reefs, especially coral reefs in tropical waters, are well visible on satellite imagery.

The other improvement concerns beaches (natural=beach ) – they are now rendered with a pattern depending on the surface tag, a fine dot pattern is used for beaches tagged with surface=sand, a coarser pattern is shown for beaches with other surface values.

Beach with surface=sand

Beach with surface=pebbles

A few notes on mapping of beaches in OpenStreetMap in general – since this is often not done correctly. The defining property of beaches is that they are formed by water waves. This means they always consist of loose material with grain sizes between fine sand and larger stones. Rocky coasts or shores stabilized by vegetation are not beaches. Beaches can exists at lakes but they usually are fairly narrow there. Beaches created artificially by filling up sand from elsewhere are not beaches in the strict sense but are generally tagged as such in OpenStreetMap.

The extent of a beach is generally limited at the lower end to where waves start to break and at the upper end to where the water reaches during storms. This means the beach usually extents across the coastline. Visual distinction of parts of the beach above the high water line and those below it does not currently work in the OSM standard style though. Coastal dunes are not part of a beach, they should be tagged natural=sand when mostly without vegetation.

Since beaches are always formed by waves they generally have a significant slope. Typically they are at most a few hundred meters wide. Larger flat areas that are sometimes above, sometimes below water depending on tides should be tagged natural=wetland + wetland=tidalflat.

Finally areas tagged natural=shoal are now rendered like beaches. Shoals are essentially what lies between reefs and islands, they are high enough to reach above the water at low tide but so low they at least occasionally are washed over by water. Often the term shoal is also applied to some relatively flat islands – the tag in OSM is however not meant to be used for that.

For reference here some short definitions of all these tags and a few others that apply to similar areas:

  • natural=reef – shallow areas permanently under water.
  • natural=shoal – protrusion, usually in form of a bank or bar, that extents above water at low tide but that is occasionally washed over by water.
  • natural=wetland + wetland=tidalflat – flat, unvegetated area in the tidal zone with sand or mud as surface material.
  • natural=beach – unvegetated stretch at the coast with loose surface material that is shaped by waves.
  • natural=sand – bare, unvegetated area of sand of any origin that is not a beach or shoal.
  • natural=shingle – bare, unvegetated area of gravel/pebbles that have been rounded and sorted by water transport, usually in river beds.
  • natural=scree – bare, unvegetated area of rocks in size between gravel and boulders resulting from rockfall.
S2A_R121_N28_20160117_crop1.ann

February 18, 2016
by chris
0 comments

Winter impressions from Sentinel-2

Here a number of further impressions from the northern hemisphere winter based on Sentinel-2 data from the last few weeks:

Himalaya

Mount Everest

Reykjavík, Iceland

southern Iceland

Grand Canyon

Zion Canyon

Mount Logan

Nabesna Glacier

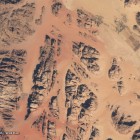
Wadi Rum

northwest Saudi Arabia

Since probably not everyone is familiar with all of these places here a map showing all the locations:

February 16, 2016
by chris
0 comments

Sentinel 3A satellite launch

ESA today launched another Sentinel satellite. In the PR materials and accordingly also in various media reports Sentinel-3A is generally described as being targeted primarily at ocean observation. More useful is probably to compare it to other existing satellite systems. While Sentinel-2 is quite similar to Landsat in both capabilities and mission profile Sentinel-3 can be best compared to the MODIS and VIIRS. The two main Sentinel-3 instruments, the OLCI and SLSTR, record various visible and infrared wavelengths with near-daily coverage of the whole planet with a resolution of 300m/500m. In addition there is a low spatial resolution altimeter primarily for measuring ocean topography.

I included the visible light sensitivities of the two main Sentinel-3 instruments in my recent comparison:

There are a number of mostly relatively subtle differences between the capabilities of MODIS, VIIRS and OLCI/SLSTR – both in spectral bands and in other characteristics:

  • MODIS data has 250m resolution only in the red band and 500m in the other visible bands, it provides near-daily coverage (~2300km field of view, around the equator some parts only every second day) and shows a morning (Terra) and afternoon (Aqua) timeframe
  • VIIRS provides 375m resolution in some bands and 750m in others, gives true daily global coverage (~3000km field of view) and shows an afternoon timeframe.
  • Sentinel 3 OLCI/SLSTR provides 300m (OLCI) and 500m (SLSTR) resolution, records images every second day near the equator (~1300km field of view, near full daily coverage with two satellites) and covers a morning time frame (both satellites).

More important than the formal capabilities is going to be what data products are made available based on these. Published plans indicate that there will only be swath products, i.e. no data resampled into a common coordinate system or composites from several days. But there will apparently be some higher level analytic products indicating atmosphere and surface properties. Somewhat amusing: while Sentinel-1 used GeoTIFF as primary file format and for Sentinel-2 they chose JPEG2000 Sentinel-3 data will apparently come in form of netCDF files – looks to me like a typical European approach to balancing different preferences.

kamtschatka_v_crop2.ann

February 15, 2016
by chris
0 comments

Kamchatka volcanoes

Ongoing volcanic eruptions are often well visible on satellite images due to the clouds of ash and steam emitted by the eruption. In Kamchatka during winter you can also usually well identify recently active volcanoes even after the eruption ended due to the winter snow being darkened by falling ash where it was carried by the wind.

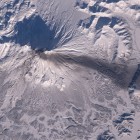
The following Landsat image from a few days ago well illustrates this.

On top you see an active eruption on the Karymsky with an ash plume and its shadow extending towards the northeast.

But you can also see extensive dark streaks of ash towards the southeast that were deposited earlier during the eruption with a different wind direction. Likewise for a second volcano further south – the Zhupanovsky.

February 10, 2016
by chris
0 comments

Survey for Copernicus data users

In connection to my recent review of the Sentinel-2 data i want to point to a survey the EU commission is doing for current and potential future data users.

This kind of survey is of course prone to misinterpretations and neither the ESA or the EU commission have a good track record when it comes to sensible and efficient use of resources and listening to people outside their bubble. But there is at least a chance to articulate what is important for current and future users of earth observation data products. There are also free form fields in many parts of the survey that allow you to put in specific requests or suggestions. And even if you are just a hobbyist working with satellite images in your spare time don’t let the orientation towards companies scare you, they specifically include micro-companies with less than ten employees.

What i would especially suggest everyone to emphasize is that open and non-discriminating access to data is of fundamental importance, not only for the idealists among us but also for a functioning market with healthy competition. For data financed to a large part by tax money this should be self-evident but it apparently is not. The Copernicus program beyond the Sentinel satellites is largely the opposite of open data with staged access rights and special privileges granted to those deemed worthy by the powers that be. Equal rights and chances for everyone and no tax money for data that is for exclusive use by only a few should be the basic principles of an European earth observation program.

So fill out the survey and let them know what you think.

February 10, 2016
by chris
0 comments

More images for mapping in OSM

Once more it is time for a number of new images in the OSM images for mapping:

First the two Landsat off-nadir images i showed in the previous post are available – other image sources provide nothing of use in these areas.

Then there is another Landsat image of Fogo, Cape Verde, this is partly covered with high resolution images in other sources but from before the recent volcanic eruption.

While we are talking about volcanoes – i also added a recent image of Calbuco which erupted in early 2015. Note although the mountain appears to be mostly ice free this is partly due to the glaciers being covered by ash.

Then i have a Sentinel-2 image of Elephant Island and Clarence Island off the Antarctic coast. These islands are nearly always obscured by clouds, a clear view is very rare. This should especially provide more up-to-date glacier information than the 15 year old images elsewhere.

And finally i added two higher resolution aerial images from the NASA IceBridge mission showing the settlement of Qasigiannguit at the Greenland west coast:

and the Thule Air Base in the northwest of Greenland:

These images are not that well aligned but provide details not visible in other sources. There are also higher resolution images of Thule from lower altitude overflights but not any more reliable regarding the absolute position.

As before you can use the images for mapping in OSM by entering the following as image source

tms:http://imagico.de/map/osmim_tiles.php?z={zoom}&x={x}&y={-y}

or in JOSM by entering http://www.imagico.de/map/osmim-imagicode.xml as additional image layer source in the preferences (imagery.layers.sites).

anti_980

February 8, 2016
by chris
0 comments

Off-nadir Landsat images in the Antarctic

During the last days the USGS recorded some sequences of off-nadir Landsat images in the Antarctic. I wrote about the off-nadir capability of Landsat 8 previously, regularly Landsat can only record images up to about 82.66 degrees latitude. By tilting the view slightly Landsat 8 can record also images somewhat beyond this. In principle the not recordable area around the pole is thereby reduced from a radius of about 800km to about 600km.

Until now this had only been used once to record a sequence in the north in May 2013 – otherwise off nadir images were only occasionally recorded at lower latitudes. The USGS recently showed plans to integrate such recordings into their normal schedule and they now started doing so in the Antarctic. Quite a number of sequences were made to systematically cover the edges of the otherwise uncovered area south of 82.66 degrees.

I will only show those parts here with significant features visible, most of the region is nearly featureless ice. The two areas i cover are shown in the following map. All images are approximately north oriented.

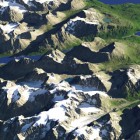
The first image is from the Pensacola Mountains south of the Davis Valley which i featured in an image previously.

On the left side you see the Foundation Ice Stream. The following crops show details from this image.

The second view is from the Transantarctic Mountains right south of what is shown here.

This image shows the Queen Elizabeth Range and the Queen Alexandra Range as well as the northern part of the Beardmore Glacier, famous for having been the way for Ernest Shackleton and a few years later Robert Scott to access the polar plateau more than hundred years ago.

The lower end of the Beardmore Glacier can be seen in the following crop.

At the southern edge the image also contains Mount Kirkpatrick, the highest peak of the Transantarctic Mountains.

Both of these images are based on scenes recorded directly south of the regular Landsat limit. They extend the coverage to about 84.5 degrees latitude which is quite close to 85.11 degrees which is the edge of usual web maps in Mercator projection a.k.a. the end of the world according to Google. The southmost parts of the Transantarctic Mountains extend quite a bit further south of course as visible in the map above.