On Nutrition Data, you'll find detailed nutrition information, plus unique analysis tools that tell you more about how foods affect your health and make it easier to choose healthy foods.

ESTIMATED GLYCEMIC LOAD™ Glycemic load is a way of expressing a food or meal's effect on blood-sugar levels. Nutrition Data’s patent-pending Estimated Glycemic Load™ (eGL) is available for every food in the database as well as custom foods and recipes.
How to interpret the values: Experts vary on their recommendations for what your total glycemic load should be each day. A typical target for total Estimated Glycemic Load is 100 or less per day. If you have diabetes or metabolic syndrome, you might want to aim a little lower. If you are not overweight and are physically active, a little higher is acceptable.
Read more about the eGL

IF (INFLAMMATION FACTOR) RATING
The IF (Inflammation Factor) Rating™ estimates the inflammatory or anti-inflammatory potential of individual foods or combinations of foods by calculating the net effect of different nutritional factors, such as fatty acids, antioxidants, and glycemic impact.
How to interpret the values: Foods with positive IF Ratings are considered anti-inflammatory, and those with negative IF Ratings are considered inflammatory. The higher the number, the stronger the effect. The goal is to balance negative foods with positive foods so that the combined rating for all foods eaten in a single day is positive.
Read more about the IF Rating

The Nutritional Target Map™
The Nutritional Target Map™ allows you to see at a glance how foods line up with your nutritional and weight-management goals. The closer a food is to the right edge of the map, the more essential nutrients per calorie it contains. For a more nutritious diet, select foods that fall on the right half of the map.
The closer a food is to the top edge of the map, the more likely it is to fill you up with fewer calories. If you want to restrict your caloric intake without feeling hungry, choose foods from the top half of the map.
Foods that are close to the bottom edge are more calorie-dense. If you want to increase your calorie intake without getting too full, choose foods from the bottom half of the map.
Read more about the Nutritional Target Map

The Caloric Ratio Pyramid™
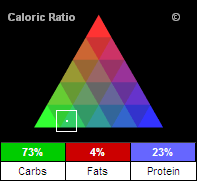
The Caloric Ratio Pyramid appears in every ND analysis, and also on ND's Total Consumption report. This symbol lets you see at a glance how the Calories in the food are distributed, and can help you determine if the food aligns with common macronutrient-based diet plans, such as low-carb (e.g Atkins™ or South Beach™), low-fat, high-protein, or Zone™.
The three numbers at the bottom of this symbol indicate the percentage of the food's Calories that are derived from the three main macronutrients ý carbohydrates, fats, and protein. If the food contains alcohol, a fourth number will appear that indicates the percentage of Calories derived from alcohol.
Read more about the Caloric Ratio Pyramid™
Nutrition glossary: Common nutrition terms defined
Sensible diet advice
Find foods highest in any vitamin or mineral or lowest in carbs, saturated fats, or sugars
Weight loss tips, news, and tools
My ND: Create and analyze recipes, track your diet, and save your favorite foods.
Quick start: Just one click stocks your My Foods list with foods that fit your diet, such as low-carb, low-calorie, low-fat, heart-healthy, quick and healthy, or super-nutritious


