Relevant and even prescient commentary on news, politics and the economy.

Low Unemployment with falling Capacity Utilization… Not a good sign for Fed Liftoff

Should the Fed raise the base interest rate? They really shouldn’t at this point. Will they? They probably will because they still see years of growth. I do not see years of growth ahead… Let me explain.

Almost one year ago I wrote that capacity utilization would start falling. (link) It has fallen since that time, even until today’s report that capacity utilization in August was 77.6%. This number was below expectations but perfectly in line with a limit line in a model that I use.

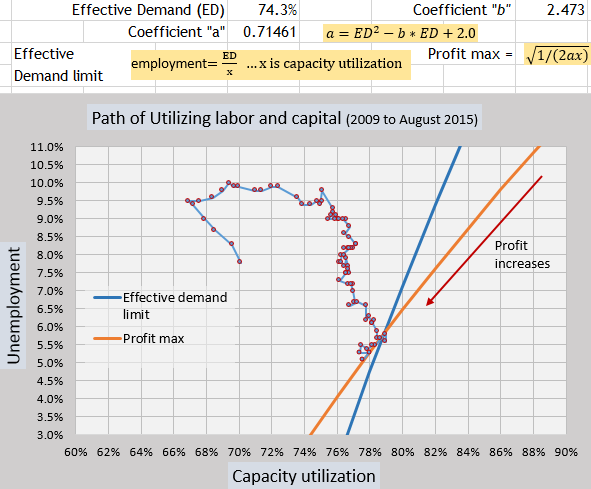
The model plots the movement of capacity utilization and unemployment. The model has two limit lines that act upon the increasing utilization of labor and capital. One for Effective Demand (basically labor share) and one for Profit Maximization (equation in graphs). The utilization of labor and capital moves toward the limits during a business cycle to increase profits. Once the movement hits the limits, profits are further increased by only moving downward along the limits, which means that capacity utilization will decrease as unemployment falls. This pattern has existed for decades before a recession. When the plot starts to pull away from the limits, a recession is beginning.

Here is the model from a year ago.

3d sept 2014

When I saw the plot reaching the limit lines last year, I wrote…

“My sense is that firms are in a race to maintain profit shares at the end of a business cycle. They felt the chill of declining profits in September. From here on out, firms will have to contract in order to maintain profit shares, as seen by the plot hitting the orange line. Now firms will have to contract capital utilization while trying to maintain the same output in order to maintain profit rates.”

So here is the model with data since September of 2014. The coefficients seen at the top are the same in both graphs for easier comparison. The coefficients though can change if labor share was to significantly change.

update 3d monthly

Yes, everyone loves the fact that unemployment is falling, but at the same time capacity utilization is falling perfectly to keep profits maximizing. Is that a good thing? Well, the business cycle stays alive and more people get hired. However, this process has its limits. Capacity utilization is now being maxed out on profits. Generally throughout the economy, it is currently only profitable to lower unemployment at some cost of capacity utilization. When capacity gets restricted too much without labor share rising, a recession becomes easier to trigger. Then we would see the plot moving up and to the left with capacity utilization falling and unemployment rising.

So the Fed decides this week whether they should raise the Fed rate or not. They are encouraged by the low unemployment number. Yet, from my perspective, the economy is very close to the end of the business cycle and too sensitive to tightening of monetary policy. The Fed could push the economy into a recession with a Fed rate rise. Basically, the Fed can no longer raise the Fed rate during this business cycle. It is too late.

According to the graphs, the natural rate of unemployment would be where the plot touches the limit lines. In this business cycle, it appears to be around 5.6%. So we have already passed the natural rate of unemployment. It is doubtful that we will see much if any inflation as conditions just do not support inflation with low interest rates promoting supply vis-a-vis weak labor share of income.

So the Fed is seeing that unemployment will drop further, and they expect some rise in inflation. However, if they are expecting a few more years of growth in this business cycle… I beg to differ.

In order to extend the life of this business cycle, the Fed should really not liftoff the interest rate.

Update:

J.Goodwin in the comments below requested a look at this model for the 1980′s. Here it is. You will see that the effective demand limit was higher at 80.2%. The “b” coefficient is the same as now. The movement of capacity utilization and unemployment headed straight for the crossing point of the two limits as they did in this business cycle. You will also see that in mid 1989, capacity utilization started to fall abruptly leading up to the recession a bit later.

You will also notice in the middle of the plot that in 1986, capacity utilization fell abruptly while unemployment stayed fairly steady. 1986 and 1987 were a global crisis of foreign debt which stressed business. But in the end the economy pushed through the problems because there was still effective demand to expand the utilization of capital and labor together.

1980s 3d

Comments (16) | |

Capital Flows, Credit Booms and Bank Crises

by Joseph Joyce

Capital Flows, Credit Booms and Bank Crises

Studies of the impact of capital inflows have established that debt inflows can lead to bank crises (see here and here). Unlike equity, payments on debt are contractual and can not be cancelled if there is an economic downturn, which intensifies any shocks to the financial system. In the case of short-term debt, a foreign lender may decide not to roll over credit at the time when it is most needed. But recent papers have shown that foreign debt can also be a determinant of the credit booms that lead to the bank crises.

Philip Lane of Trinity College and Peter McQuade of the European Central Bank (working paper version here) looked at the relationship of domestic credit growth and capital flows in Europe during the period of 1993-2008. They suggest that financial flows can encourage more rapid credit growth by increasing the ability of domestic banks to extend loans, while also contributing to a rise in asset prices that encouraged financial activity. They found that debt flows contributed to domestic credit growth but equity flows did not. Moreover, the linkage of debt and domestic credit was strongest during the 2003-08 pre-crisis period.

Tags: Comments (0) | |

70% Defaulted in 2013

To add to this attention getter, 70% of all the students who defaulted in 2013 went to non-traditional schools or “for-profit” schools. Of students who graduated from traditional schools and were required to start paying back student loans in 2011, two percent of graduate students and eight percent of undergraduate students defaulted as compared to ~21% of students from non-traditional schools within two years. Mind you, this does not exonerate traditional schools from the financial burden placed upon graduating students. The only cost increasing at a faster rate than healthcare is the cost of pursuing a college education.

invisible hand

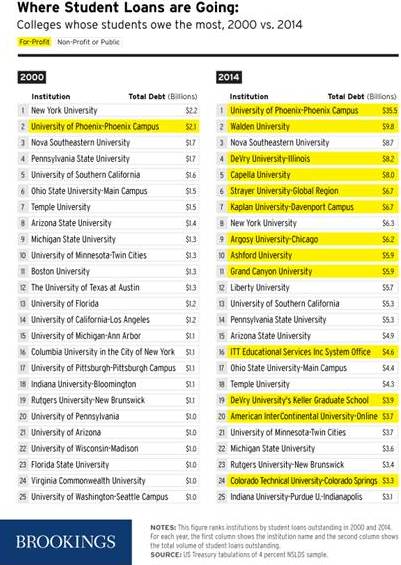
In 2000, one nontraditional school of the top ten schools was the second highest with associated student loan debt to attend it. University of Phoenix was second to a traditional school at $2.1 billion. In 2014, the University of Phoenix moved to #1 at $35 billion of associated student loan debt to attend it. Of the next 10 schools, 8 were non-traditional and 2 were traditional schools in 2014. New York University went from 1st on the list in 2000 to 8th on the list in 2014 with triple the amount of student debt associated with getting a degree there. The number two school in 2000, University of Phoenix amassed student loan debt of $35 billion to attend. This was more than 17 times what the University of Phoenix had in 2000.

The numbers of student loan borrowers doubled from 2000 to 2014 to 42 million and the debt quadrupled to $1.1 trillion. With this explosion in borrowers and increase in debt, defaults reached its highest level in 20 years. “Half of the borrowers exiting college in 2011 had attended a for-profit school or a 2 year college and represented 70% of the student loan defaults. As reported in “A Crisis in Student Loans?,” the default crisis centered around borrowers who attended non-traditional schools such as Phoenix and to a lesser extent two year colleges. In the past those who attended non-traditional schools represented a small portion of borrowers and those attending two year schools did not require borrowed funds to attend. So what changed?

Student loans are the roach motels of the banking/lending industry. Once you sign on the dotted line at 18 years old, you are little more than an indentured servant to the ultimate bill collector, the government, until the loan is paid off or you become disabled or die. This type of loan can not be discharged in bankruptcy. However, this is not just a story about young men and women going to college at 18. From 2000 onward with the decrease in higher paying and lower skill jobs, many older and low income people went back to school to improve their skills and knowledge in the hope of becoming technicians, nurses, etc. Especially in 2008 and afterwards when companies laid-off thousands of people, Labor went back to school as a panacea to lack of work. It did not work quite as they had hoped.

Schools and especially nontraditional schools engaged in deceptive advertisements for job placement and graduation rates advertising their offering of additional education in specific fields as the elixir to a lack of jobs in the less skilled fields. I am sure you have seen the TV commercials and billboards advertising making more money. Furthermore, most nontraditional schools did not offer grants or scholarships; however, the lower income students were eligible for the ~$5,000/year Pell Grants. 73% of the lower income students enrolled in nontraditional schools applied for these grants as opposed to 37 to 45% of students at traditional colleges and universities. Unfortunately, the Pell Grant paid only a portion of the average yearly tuition of ~$15,000 at a nontraditional school.

Nontraditional school students ran up against a limitation on Federal backed loans. The Federal Government restricts what an 18-year-old undergraduate can take out in loans to ~$31,000 and ~$57,000 for older, independent students. As a result, students at nontraditional schools needing more money turned to the shark-pool of commercial loans which also can not be discharged in bankruptcy and with the government acting as the “ultimate” bill collector again. Some nontraditional colleges also offered in-house student loans. Now in bankruptcy, Corinthian Colleges was one of the nontraditional schools offering their “Genesis Loan” with an interest rate sometimes as high as 15%. Finally waking up after the bankruptcy, the Consumer Financial Protection Bureau is suing the college for setting tuition as high as $75,000 for a bachelor’s degree forcing students to take loans, guiding students to in-house loans to pay the tuition, and partaking of some of the lender loan fees. This was also a practice engaged in by traditional schools, which ended in the late nineties as the government cracked down on the practice

As Adam Looney and Constantine Yannelis reported in A Crisis in Student Loans? the numbers of those defaulting on educational loans has dropped for nontraditional for-profit schools which means the twenty year high will also decrease over time. I would point out the schools such as the bankrupt Corinthian Colleges as well as DeVry, Kaplan, ITT Tech, and others are under government investigation for deceptive recruitment tactics, falsifying job placement, and graduation rates. There has been no solution for the thousands who took out loans in the hope of bettering their future. In the mean time, the government will continue ham-fisted-bill-collecting role for private businesses making the loans.

References
These are the Schools Driving America’s Student Loan CrisisJim Tankersley and Danielle Douglas-Gabriel, The Washington Post, September 10, 2015

A crisis in student loans? Adam Looney and Constantine Yannelis, BPEA Conference Draft, September 10 – 11, 2015

Comments (21) | |

Conceding too much to Supply Siders

This is my usual post lamenting the fact that reasonable people allow supply side dynamic scorers to set the terms of debate. They confidently assert that tax cuts for the rich cause more rapid GDP growth and want to argue whether that means they pay for themselves . Jeb!’s economists admit that they don’t without 2 magic asterisks. But if one concedes that the effect on growth is positive and argues about the magnitude then one should concede that taxes on the rich should be cut — we don’t dislike deficits because they cause us pain by themselves but rather because they harm the economy.

There is no reason to believe that cutting the top marginal tax rate will cause higher GDP growth. The evidence points the other way.

The very excellent Kevin Drum makes my knee jerk with one sentence (with which I don’t even disagree) in this excellent post on the conservative Tax Policy Center’s analysis of Jeb!’s proposed tax cuts.

My comment.

Nice catch and post. However I think you (impicitly) conceded too much when you wrote “The Tax Foundation has a very rosy view of dynamic effects, which are almost certainly far less than they estimate.” The reason is that “less” can mean smaller (closer to zero) or lower (closer to negative infinity). In principle, it is also possible to argue that Jeb’s tax cuts will cause 20% lower GDP. is this less than the effect the tax policy center asserts ? It’s larger in absolute value.

I haven’t run the numbers (I can’t) but I am confident that Jeb’s plan would cause lower growth. Partly this is because of post WWII data on top marginal tax rates (I admit on labor income) and growth in OECD countries. Atheoretic estimates, if taken literally, suggest that the growth is maximized at a top rate of over 50% (some estimates are 70%). In contrast, I know of essentially no evidence published in the peer reviewed literature that lower rates cause more rapid growth (the essentially is in regressions which consider convergence that is incude initial per capita GDP as a regressor — it’s negative coefficient is overwhelmingly statistically significant for the sample.

The Jeb team analysis (not tax policy center but Feldstein Hubbard et al) assumes additional growth from unspecified regulatory reform and also assumes unspecified spending cuts. They consider no effects of spending but costs — that is assume the spending is pure waste. In standard models, eliminating wasteful government spending causes increased growth, but the assertion that government spending is waste is completely unproven in the Jeb team analysis — it is just assumed.

This is important because if the tax cuts without the magic spending cuts cause higher deficits, the higher deficits will cause higher interest rates (The Fed is lifting off the zero lower bound soon or in a few months) which cause lower investment which causes lower growth.

Back to atheoretic data analysis — deficits are strongly negatively correlated with growth. Of course the case against supply side voodoo is very familiar to Americans who follow the news with the Clinton tax increase followed by a boom and the W Bush tax cuts followed by disaster and the 2013 tax increases followed by a (slight) increase in GDP growth.

My point is that international evidence and reasonable theory support the impression that the Tax Policy center didn’t just get the magnitude of the dynamic effect wrong but also are wrong about its sign.

Comments (19) | |

Rapid Progress Towards Real Reporting at the New York Times

At 12:07 Eastern standard time 9/10/2015 Alan Rappaport wrote an article on Jeb Bush’s tax proposal whose headline seemed to me to be the title of a Bush campaign press release — it stressed the proposal to close the carried interest loophole and not the huge cuts to top tax rates. About 4 hours later Rappaport and Matt Flegenheimer wrote a Ballanced article whith a headline which noted both.

timestrashJPG

Then after 2 more hours Josh Barro wrote a serious analysis of the proposal noting that it, like all Republican tax proposals, would amount a to huge gigantic tax cut for the rich (and small piddling tax cuts for the non rich).

barrotimes

I think this shows the huge gap between beat reporters who aim to please sources and blogging related journalistic activities which are based on looking up the facts and analysing them. The problem is that the Barro article in the upshot will get much less attention than the Rappaport and Flegenheimer article on the web front page.

To me the key question is whether the new blogger influenced fact based journalism of the Upshot, Vox, Wonkblog, TPM etc will prevent Republicans from tricking voters about their plans to serve the rich as George Bush did in 2000.

Do opinions on shape of planet still differ ?

update:
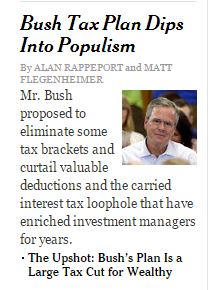
This has become very strange. The front page includes a link to Barro’s article but the headline on the Rappaport and Flegenheimer article has regressed describing huge tax cuts for the rich as “populism”. The NYTimes headline writer is debating with himself or herself. I guess the insane new main headline was needed to Ballance Barro.

timesvtimes

I wonder if part of the issue is innumeracy. Vastly more dollars are involved in the rate cuts than the carried interest loophole but rate cuts consist of replacing a number with another number while “the carried interest loophole” is a phrase. I don’t see how anyone with any sense for numbers can present both in parallel in the same abstract as if they were remotely similar in scale.

update:Well the blogosphere sure is on it. The NY Times and especially the un-named Times person who wrote “populism” in the headline is being denounced vigorously
ed Kilgore links to

Jonathan Chait who covers the coverage much better than I do. Chait has an anti-blogger past (really he wasn’t always a blogger) so he contrasts narrative based journalism and data driven journalism. He admits he doesn’t know how it will turn out (data journalism is still relatively obscure — will the front page journalists be willing to learn from the nerds on the back pages ?). But the point is just read Chait — he’s done more research than I have (a low bar to clear) and writes better (a lower bar).

Comments (17) | |

Consumption by Capital Income surges in 2nd Quarter

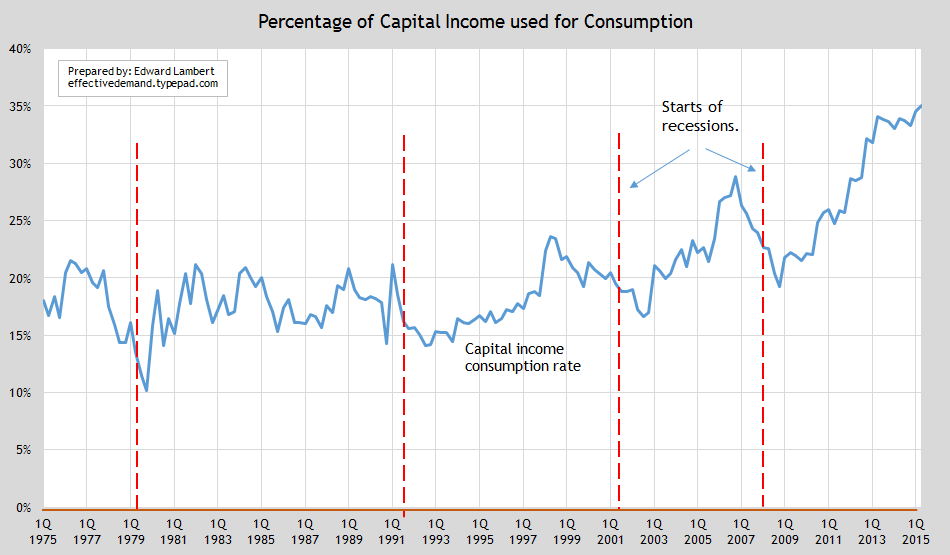
I track an estimation of consumption by capital income through the NIPA numbers and labor’s income share. Changes in this estimation give insights into how well capital income is doing. What do I find? The percentage of capital’s income used for consumption surged in the 2nd quarter 2015.

update perc capital consump b

To me, this is crazy. The dynamics of the economy are making the rich feel even richer.

One problem is that the economy is becoming more unstable, more top heavy. We see this because capital income’s consumption sagged before the previous recessions. This isn’t happening yet though. But we need to watch for it. Measures around the world from loose monetary policy are propping up capital income. But the situation is just becoming more unstable as time goes on.

The balanced economy of the past is a thing of the past.

Labor needs more income.

Update:

If you wonder how capital income could be so strong, here is a video to watch.


Comments (18) | |

Wages and the Fed.

Both bulls and bears are examining wage growth for signs of incipient inflationary pressures. The current debate seems to assume that wages are completely determined by how much slack there is in the labor market and overall economy. Both conservatives and liberals seem to believe that if employment fall below current levels that wage growth must accelerate. Standard analysis seems to completely ignore the point that inflation expectations plays a significant role in the wage setting mechanisms.

I have been using a wage equation that I first developed some 20 years ago and it has worked extremely well to explain average hourly earnings growth as far back as the wage data goes, 1964. The equation has three variables, unemployment, manufacturing capacity utilization and the trailing three year change in the CPI. This is used as a proxy for inflation expectations because other measures of inflation expectations do not have a long enough consistent history. For those of you that like to duplicate work they see online, the equation does have a fourth variable that I call Nixon. It is a dummy variable for wage price controls in the early 1970s.3 yr cpi
As you can see the equation explains wages very well through the acceleration of wage growth in the 1960s and 1970 and wage moderation in the 1980s and 1990s. The only time it fails is when it called for wages to fall after the great recession. I believe this is just another example of how wages are sticky and that business had good reasons to not implement widespread wage cuts after the Great Recession.
cpi 3

The second chart shows the three year trailing CPI. At 1.3% is at the lowest level experienced since the 1950s. Moreover, it is in line with other widely quoted measures of inflation expectations. This means that low inflation expectations are offsetting some of the upward pressure on wages from the low unemployment rate and high capacity utilization. Consequently, I believe that the Fed – as well as those who have been warnings that runaway inflation is just around the corner — are overly concerned with the risk of employment gains leading to higher wages and inflation. This fed can easily leave rates at low levels with little fear that wages growth and inflation will accelerate.

Comments (32) | |