
On Friday, the big news was that the unemployment rate had fallen below 6 percent for the first time in six years. That’s swell news, but the headline unemployment rate tells us virtually nothing at all about the real employment situation. Since the unemployment rate is a function of both the labor force size and the total number of people who self-report as employed, we need to get a sense of both labor force dynamics and total employment. Below, I’m going to use the government’s own numbers, so keep in mind this data is the rosiest picture that BLS could credibly paint. I will not be using the so-called “seasonally adjusted” (SA) numbers, because they’re more heavily manipulated than the not-seasonally adjusted (NSA) numbers. Also, seasonal adjustment is simply unnecessary and adds totally unnecessary complexity to the data. Everything I look at below is not adjusted, and is from the BLS.
Here’s the unemployment rate graph:
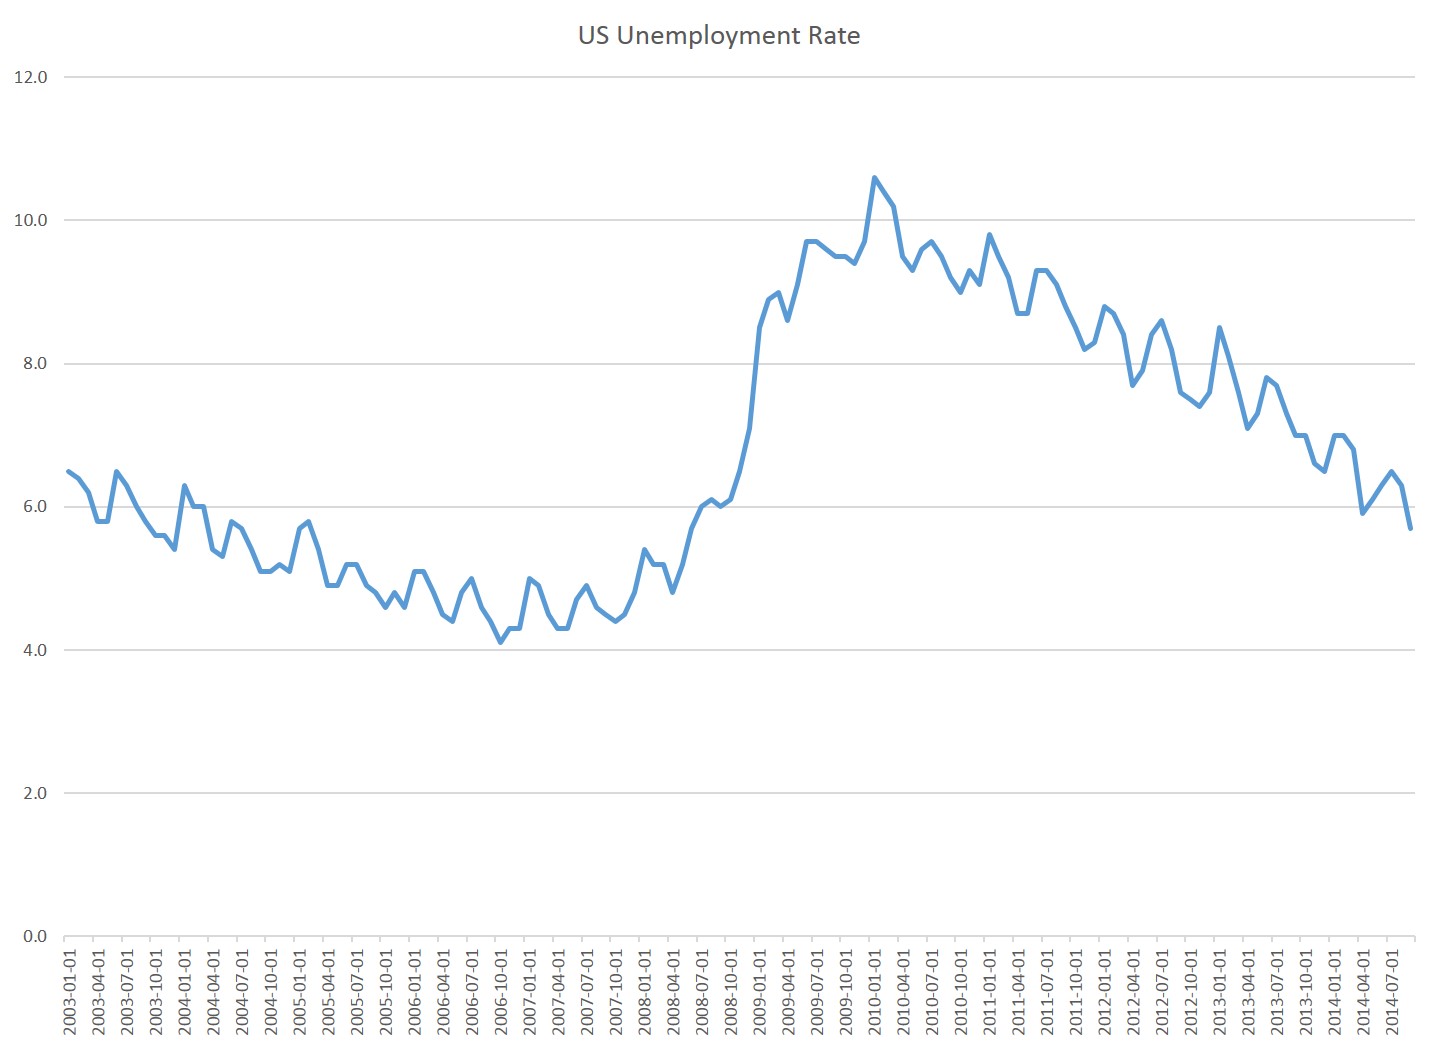
The unemployment rate bottomed out near 4 percent during the last expansion (2002-2008), and it then shot up to over 10 percent. Ever since then, it’s been heading down steadily. The headline SA number for September 2014 was 5.9 percent, and in this case the NSA number was even lower, at 5.7 percent for September. That’s down from a year earlier, when the rate was 7.0 percent.
How great! What a big drop. We’re finally back to what was ten years ago considered a mediocre unemployment rate. But it’s better than ten percent, right?
Sure, it’s better, but what really matters, in terms of the unemployment-stats game is how much actual employment opportunity there is. The fact of the matter is, the total number of employed persons in the US has gone basically nowhere since 2007. We see this if we look at the components of the unemployment rate, which are the labor force size and the total number of employment persons. This is the Household Survey, which means that the data is based on surveys of actual persons who are asked if they want to be employed, and if they have actually managed to find employment. People who have given up looking for work, or gone back to school, or just accepted a lower standard of living because they’re premature retirees who’ve given up permanently, are all excluded from the labor force. So, looking at the components of the unemployment rate, we see:
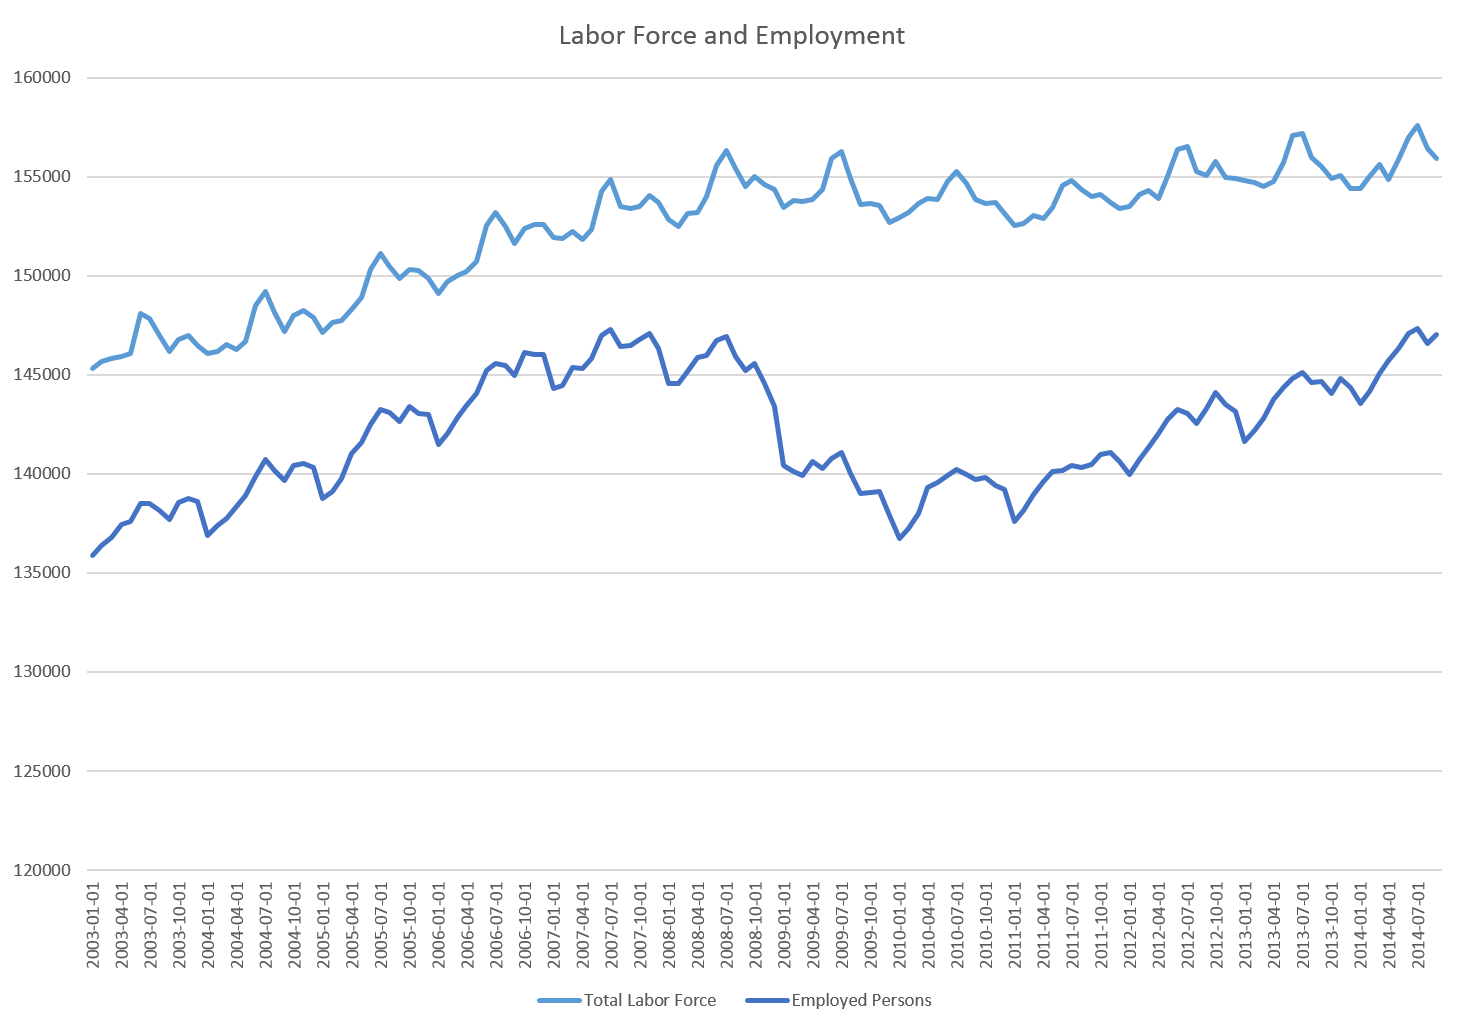
When the gap between the two lines is big, the unemployment rate is high. And when the gap is small, the unemployment rate is smaller. It’s perfectly possible to get a decline in the unemployment rate without adding any new jobs at all. All you need to have is a decline in the size of the labor force. We saw this at work back in 2010 and 2011, when the unemployment rate was dropping, but employment growth was near-stagnant. This was because the labor force size fell slightly, in spite of the fact that 3.3 million people continued to graduate from high school each year. Did 100% of them go to college full time? And what happened to all the people who graduated from college in those years? Well, they apparently didn’t enter the labor force. Labor force growth continues to be anemic, and it’s certainly not just because baby boomers are retiring. Many people are simply electing to leave the work force for a variety of reasons, including declines in opportunities for work. Many critics of the administration have correctly pointed to the fact that labor force participation is at very low levels.


Recent Comments