This web site was last updated on January 27, 2006. For current jobs and unemployment data and analysis, check out EPI's Economy Track. |
The state of jobs and wages
Lee Price and Jared Bernstein
Economy up, wages down
The year 2005 was a solid economic year by some indicators, as the economy expanded for the fourth consecutive year. Real hourly wages, however, fell for most workers.
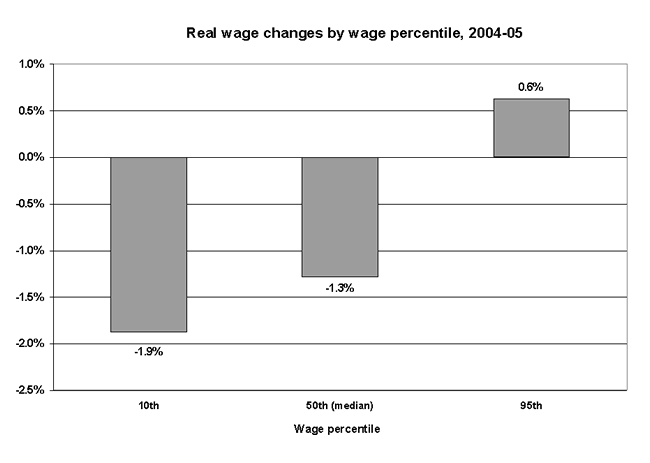
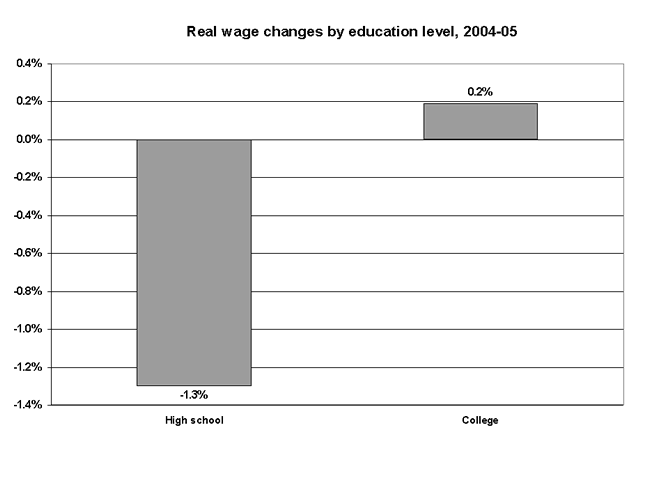
Each bar in Figure A and Figure B represents the percent change in the buying power of the wage for different groups of workers. Figure A shows the real wage changes of low-, middle-, and high-wage workers, corresponding to wages at the tenth, fiftieth, and ninety-fifth percentile of the wage scale. Figure B shows the change in average real wages by education level for high-school and college graduates (four-year degrees).


For low- and middle-wage workers, as well as those with a high school degree, real wages fell last year by 1%-2%. Those at the top of the wage scale experienced marginal gains, and real wages were essentially unchanged for college graduates.
The decline in real wages for these groups of workers was the result of a variety of factors. As shown in an earlier analysis, nominal wage growth slowed over the past few years as the slack in the job market ultimately slowed the momentum coming out of the full-employment job market of the latter 1990s. Inflation was also a factor last year, as energy costs drove prices higher (on average for the year, inflation was up 2.7% in 2004 and 3.4% in 2005). Thus, nominal wages needed to grow that much faster to beat price growth.
Other factors contributing to the decline in real wages are those that reduce the bargaining leverage of many in the workforce, including: the erosion of union power, the fall in the real value of the minimum wage, the growing imbalance in international trade, and the offshoring of white-collar jobs. As long as these forces are in play, the headwinds pushing against real wage gains for many in the workforce will remain strong.
Sluggish private job growth indicates failure of tax cuts
Changes in tax law since 2001 reduced federal government revenue by $870 billion through September 2005. Supporters of these tax cuts have touted them as great contributors to growth in jobs and pay. But, in reality, private-sector job growth since 2001 has been disappointing, and a closer look at the new jobs created shows that federal spending—not tax cuts—are responsible for the jobs created in the past five years.
If tax cuts have created jobs at all since 2001, it will have happened in the private sector. Assuming that job growth in 2006 matches the Bush Administration's projections, the economy will have added about 2.0 million jobs to the private sector from FY2001 through FY2006. But how many of these two million jobs actually can be attributed to tax cuts and how many to increased government spending—particularly increased defense spending—in this period?

Based on Defense Department estimates of the number of private-sector jobs created by its own spending, we project that additional defense spending will account for a 1.495 million gain in private sector jobs between FY2001 and FY2006. Furthermore, increases in non-defense discretionary spending since 2001 will have added yet another 1.325 million jobs in the private sector, for a total of 2.82 million jobs created by increased government spending. Increased mandatory government spending—which is not even included in these estimates or the accompanying chart—would account for even more job creation. The mere fact that the projected job growth resulting from increased defense and other government spending exceeds the actual number of jobs projected to be added to the economy through 2006 clearly indicates that the tax cuts hardly seem plausible as the engine of the modest job growth in the economy since 2001.
Recent job gains lag far behind historical norms
President Bush has noted that 2 million jobs were created over the course of 2005 and that we have added 4.6 million jobs since the decline in jobs ended in May 2003. But does that mean the labor market is getting back to normal?
Unfortunately, no. Recent job gains lag far behind historical norms. Last year's 2 million new jobs represented a gain of 1.5%, a sluggish growth rate by historical standards (see chart below). In fact, it is less than half of the average growth rate of 3.5% for the same stage of previous business cycles that lasted as long. At that pace, we would have created 4.6 million jobs last year. If jobs had grown last year at the pace of even the slowest of the prior cycles—2.1% in the 1980s—we would have added 2.8 million jobs. Over the last half century, the only 12-month spans with job growth as low as 1.5% were those that actually included recession months, occurred just before a recession, or were during the "jobless recovery" of 1992 and early 1993.

For further analysis, consult the following EPI publications:
Why people are so dissatisfied with today's economy (Issue Brief #219)
The wage squeeze and higher health care costs (Issue Brief #218)
Copyright © 2006 by The Economic Policy Institute. All rights reserved.
|
Are the 2003 Bush tax cuts creating jobs? |
